Category Archives: interest rates

Chart of the Day: Campbell Red Lake Mines

Below is the annual 52-week low for Campbell Red Lake Mines (CRK) from 1960 to 1968.  We’ve also included the Effective Fed Funds Rate as a comparison to show how gold mining stocks perform against the backdrop of rising interest rates.

image

In this example, the Effective Fed Funds Rate increased from 1.98% to 6.02%.  Meanwhile, Campbell Red Lake Mines (CRK) had a 52-week low range from $9.63 to $24.00.

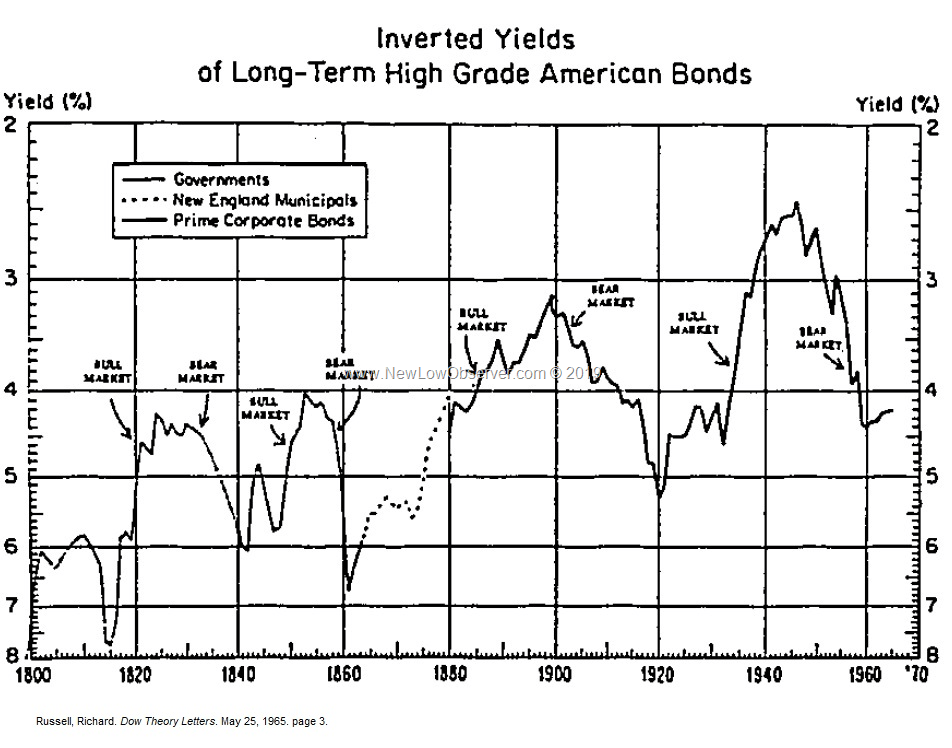
Chart of the Day: Inverted Yields from 1800 to 1965

Below is a chart of inverted yields of American bonds as published in Richard Russell’s Dow Theory Letters on May 25, 1965.  What is most conspicuous about this chart?  The overall trend of lower highs (yields) and lower lows (yields).

image

Chart of the Day

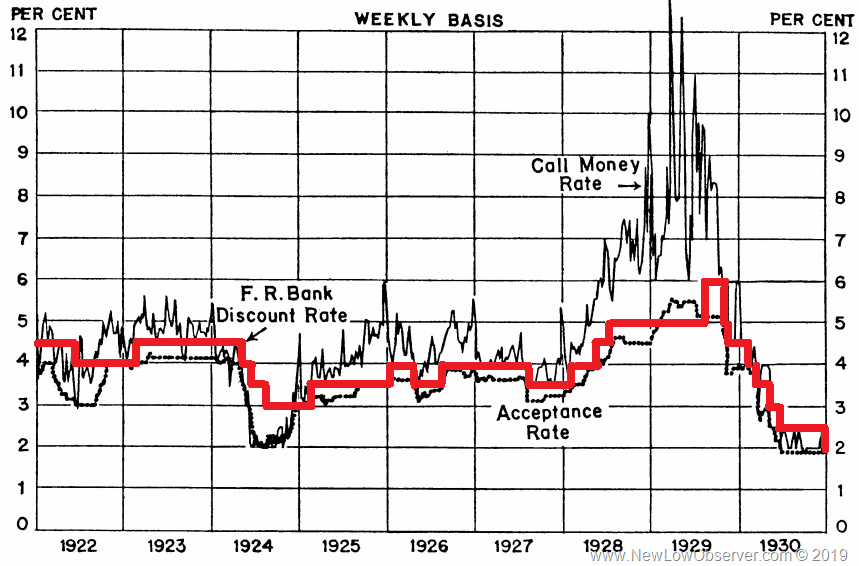
Below is a chart of the Discount Rate from 1928 to 1943.  The point of this chart is to show that the restrictive rate policy from 1928 to 1929 saw the stock market and economy increase significantly.  Meanwhile, the easy money policy period from 1929 to 1943 were the most devastating for the U.S. economy and stock market.

image

This is an ironic twist on the idea that if the Federal Reserve lowers interest rates then that should explain why the U.S. economy improved from 2009 to 2019.  Interest rate policy and the Fed’s role is not the reason the economy turns around.  This explains why Japan has not recovered from the 1990 bust as outlined in our article “The ‘Even Greater’ Depression of 1990 to 2019.”

The “Even Greater” Depression of 1990 to 2019

As the saying goes, “it is a recession when it happens to others and a depression when it happens to you.”

In the last “Great” Depression from 1929 to 1945, Americans were well aware of the pain and misery that was wrought on the nation.  There are even some who wrongly claim that the only reason the United States got out of the “Great” Depression was World War II.  Debates aside, below is a percentage change chart of the Dow Jones Industrial Average from 1929 to 1954, the period of time that it took for the index to get back to “break even.”

image

There is no debate among the average American or Harvard economist about when the last “Great” Depression occurred in the United States.  However, when the exact same thing happens to one of our allies, it seem difficult for even the most esteem experts on the “Great” Depression to recognize the current depression simply because it isn’t happening to us.

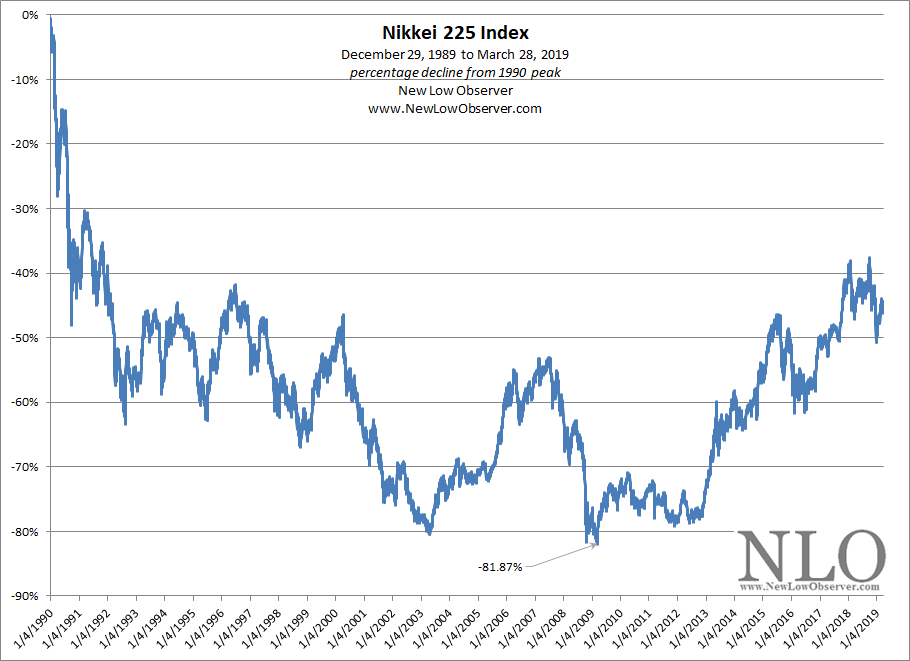
That ally is Japan. To put our claim in context, we will show you the stock market of Japan as represented by the Nikkei 225 Index in exactly the same format as the Dow Jones Industrial Average above.

image

Someone please tell us that what Japan is going through isn’t a depression. We use the stock market as the most accurate real-time reflection of the economy, politics, and social well being, which is nothing new to long-time readers of our work.

Let’s reflect for a moment, in Japan from 1989 to 2008:

  • interest rates have been in decline
  • quantitative easing has been applied
  • banks that were among the top 6 of 10 in 1989 are now either defunct or merged into each other

How is it possible, that a key measure of the health of a nation like Japan could suffer so much and not be recognized to be in an “Even Greater” Depression?

Look at the Dow Jones Industrial Average from 1929 to 1954 again.  It took 25 years for the index to break even.  Now look at the Nikkei 225 Index, it has already been 29 years and the index is still –40% below the prior peak.

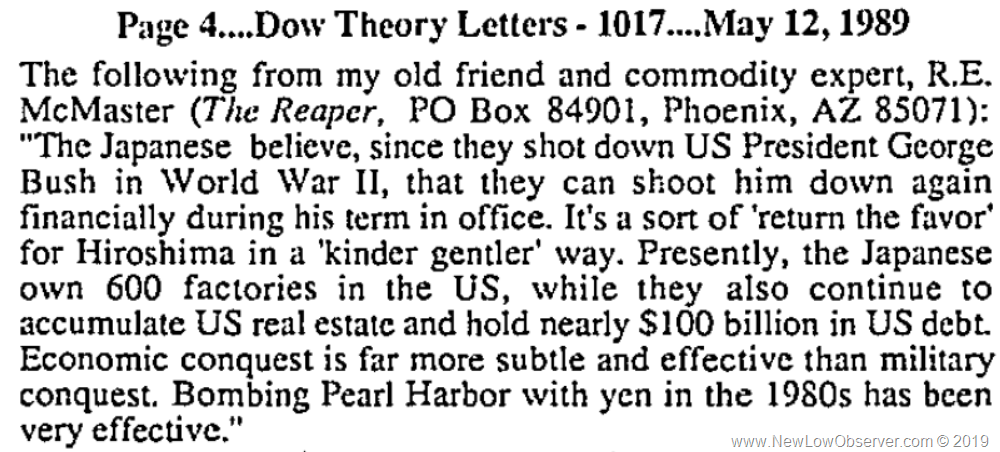
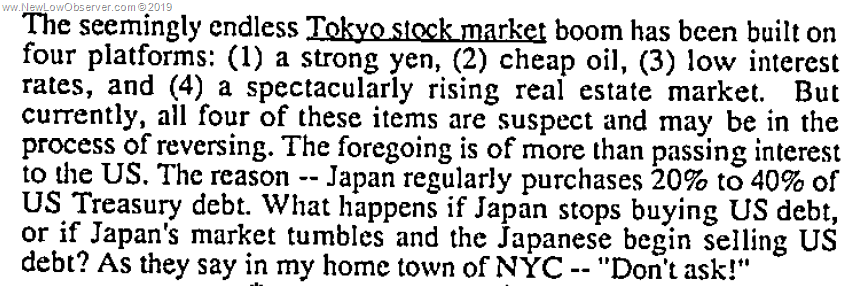
Let’s take a brief refresher course on what was said of Japan prior to the decline of 1990, this from the Dow Theory Letters as published by Richard Russell and dated May 12, 1989:

image

Or how about the following, dated October 18, 1989:

image

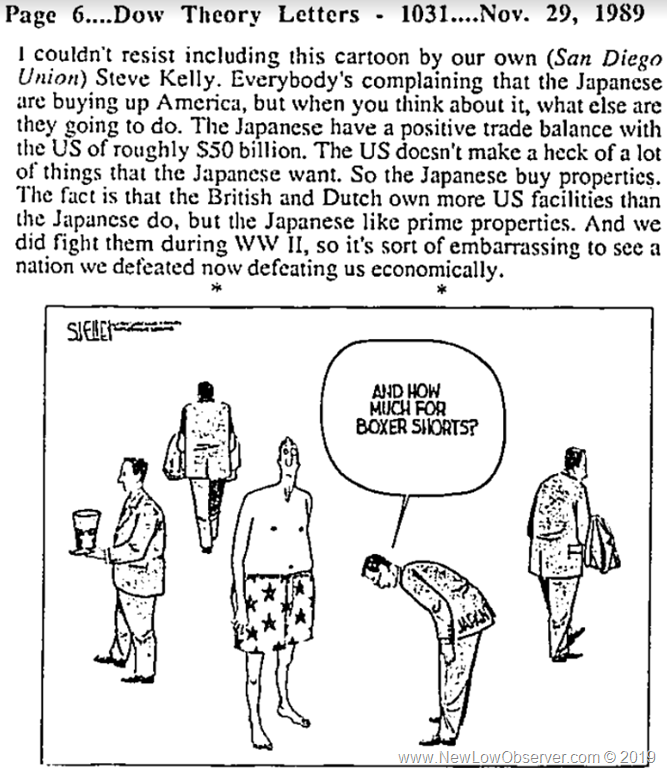
And this from November 29, 1989:

image

And finally, this from April 5, 1989:

image

It is not an uniquely American attribute to forget the past but to blithely walk past the “Even Greater” Depression within our midst while it impacts our ally is a brewing storm.

Investors, politicians, and citizens alike would do well to note the exact same (subtle and not so subtle) slights and invectives being lobbed around today.  Meanwhile, due diligence is necessary to first acknowledge the plight of an ally and act in the interest of both nations before it is too late.

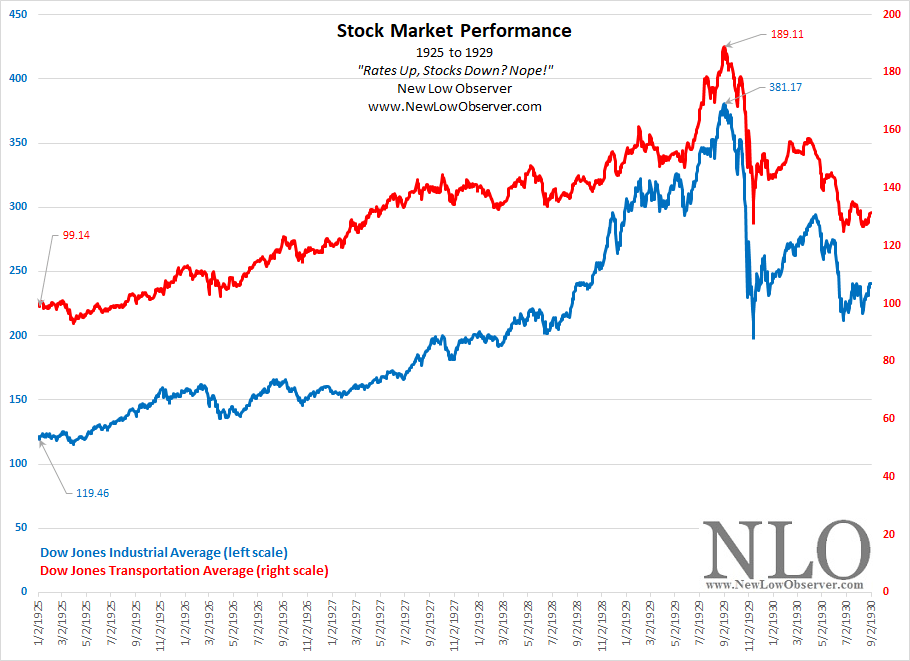
Rates Up, Stocks Down? Nope!

There is a contingent of analysts and economists who stand in the way of progress in economic and financial understanding of how stock markets work.  One prevailing view is that the rise of interest rates is followed by a decline in the stock market.  Worse still, there is the belief that reducing interest rates is the Federal Reserve’s primary tool for dealing with slowing economic growth.

Below, we show how, in spite of a cyclical increase of the Federal Reserve’s discount rate, from early 1925 to mid-1929, the stock market defied modern analysts and economists claims.

image

In the period from 1925 to 1929, the Federal Reserve embarked in a policy of increasing the discount rate.  Below is the performance of the Dow Jones Industrial Average and Dow Jones Transportation Average in the period from 1925 to 1929.

image

As we all know, the period that followed the peak in stock market in 1929 was declining interest rates and a subsequent stock market decline of nearly –90%. 

Were we biased in our selection of the data?  Absolutely!  We chose the cyclical (short-term) period for one of the most notorious stock market rises and declines and added the cyclical period of rising interest rates to prove a point. 

However, if you want to see how the stock market did during a secular (long-term) period of rising interest rates then see our posting titled “The False Narrative of Stocks and Interest Rates” published on January 7, 2019.

sources:

  • A.C. Miller. “Responsibility for Federal Reserve Policies: 1927-1929”. The American Economic Review. September 1935. pages 442-458. accessed 2/10/2019. JSTOR

Interest Rate Monitor: January 2019

Below are the downside targets for the 3-month Treasury from the beginning of the Fed’s interest rate increasing campaign. Continue reading →

The False Narrative of Stocks and Interest Rates

The good news about the Dow Jones Industrial Average is that it has been around for the last two secular periods of rising interest rates.  The first period is from 1898 to 1925 (27 years) and the second period is from 1942 to 1981 (26 years).  In this posting, we show how the crowd that claims rate increases are the death of stocks is false.

The False Narrative

The false narrative is as follows, “…the reason for the wealth creation in the U.S. since 2009 is due to the decline in interest rates.  Therefore, when interest rates start to increase there will be a crash in stock prices.”

The Facts

Let us review the performance of the Dow Jones Industrial Average from 1896 to 1925 within a secular trend of rising interest rates.

image

Let us review the performance of the Dow Jones Industrial Average from 1942 to 1981, within the last secular trend of rising interest rates.

image

In both instances, within the entire period of rising interest rates/inflation, the Dow Jones Industrial Average increased significantly.  Most interesting is the fact that the period from 1896 to 1925 had stocks offering substantial total returns due to lopsided par value stock and high dividend yields.  This puts much of the gains not calculated in the Dow Jones Industrial Average in the pockets of investors and not the price of the index.

The False Narrative Crowd

It is very easy to make false claims.  However, the data tells a completely different story.  There will be stock market crashes in either secular trend in interest rates for various other reasons.  Strictly because rates are rising isn’t necessarily one of them.

Interest Rate Monitor: November 2018

On November 21, 2015, we said the following:

“While a Fed rate increase is what everyone is waiting for, history suggests that Fed policy  (government regulated) follows short-term Treasuries (market driven).

image

“In a barely perceptible way, the chart above demonstrates that all Federal Reserve rate increases were preceded by a rise in the 3-month Treasury.  The blue arrows indicate the reversal in the declining trend before 3-month Treasuries increased.  From this point, we can easily see that the Federal Reserve’s discount rate follows to the upside not long after.  We’ve only included the point in the interest rate cycle that corresponds to the phase that we are entering, coming from an all-time low to an eventual all-time high.”

We are clearly in the early stages of a secular rising trend in interest rates.  As noted above, the direction is up for the foreseeable future.  What concerns us now, as always, is the cyclical declines which can be dramatic.   Below we trace out the first decline in the previous secular trend and see what that would look like in the current rate environment. Continue reading →

Interest Rate Monitor: October 2018

On September 26, 2018, the Federal Reserve Bank increased interest rates.

image

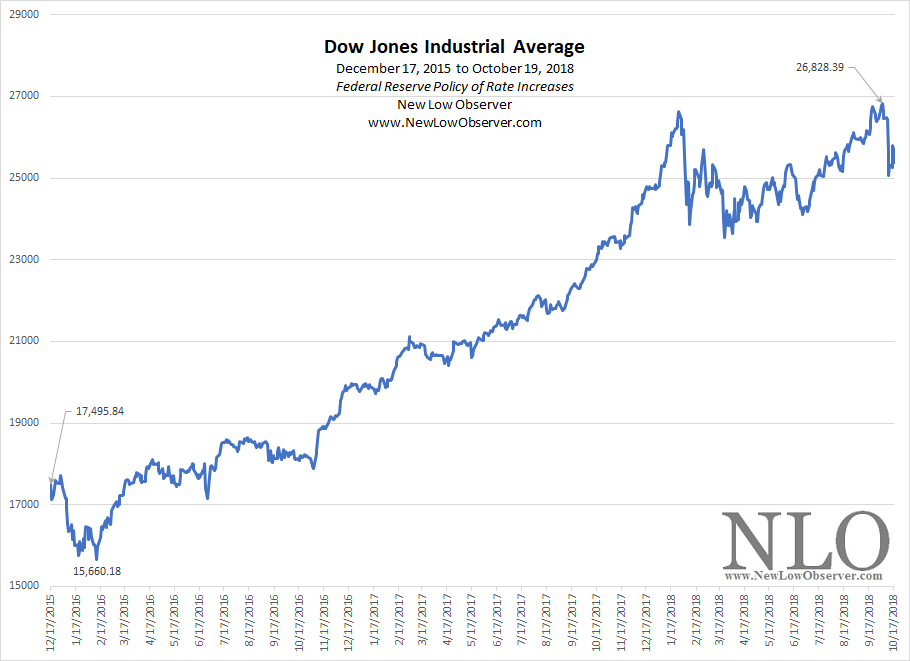
How has this policy of rate increases affected the stock market? Since the first rate increase after the “financial crisis” on December 17, 2015, the Dow Jones Industrial Average has defied the scaremongers who assert that rising rates will crash the market.

image

The Dow is up +45% since the rate increasing policy began.

How is it possible that the Dow Jones Industrial Average is up so much in spite of eight consecutive rate increases?  Why have the scaremongers been so wrong? Two key articles that we’ve written address this perplexing issue and anticipated much of what we’re seeing in the current rise of the market with rising interest rates.

The first article, published April 20, 2011 titled “The Myth of ‘Inflation Proof’ Stocks” highlighted the performance of the Dow Jones Industrial Average from 1940 to 1966 while the 3-month Treasury increased from 0.01% to as high as 4.59%.  In that period, the DJIA increased more than +900%.

The second article, published September 4, 2014 titled “Utility Stocks and Rising Interest Rates” flipped the script on the scaremongers by contrasting the performance of interest rate sensitive stocks against the backdrop of a rising rate environment.  Like the Dow Jones Industrial Average, the Dow Jones Utility Average increased more than +500% in the period from 1939 to 1966.  As a bonus, we included the earning and stock performance of seven regional utilities from 1949 to 1953.

Below is the 3-month Treasury and the upside resistance levels that we’re watching for a possible pullback from the rising trend. Continue reading →

Interest Rates and the Dow

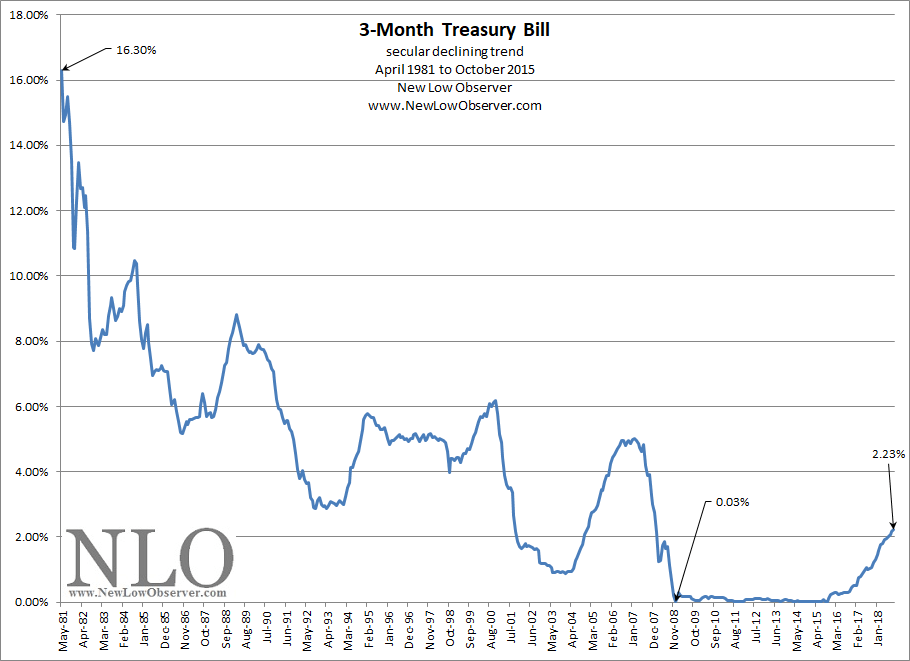
The secular trend for interest rates is clearly up after declining since April 1981.

image

There are “experts” on the topic of interest rates and the stock market claiming that the Federal Reserve policy of “artificially low” interest rates is the reason the stock market is up since the low of 2009 and as a supplemental proof of their lack of knowledge, the “experts” include the Dow increase from the 2001-2003 lows as the devil’s handiwork.  These same “experts” also claim that the stock market will crash if rates start to go up.

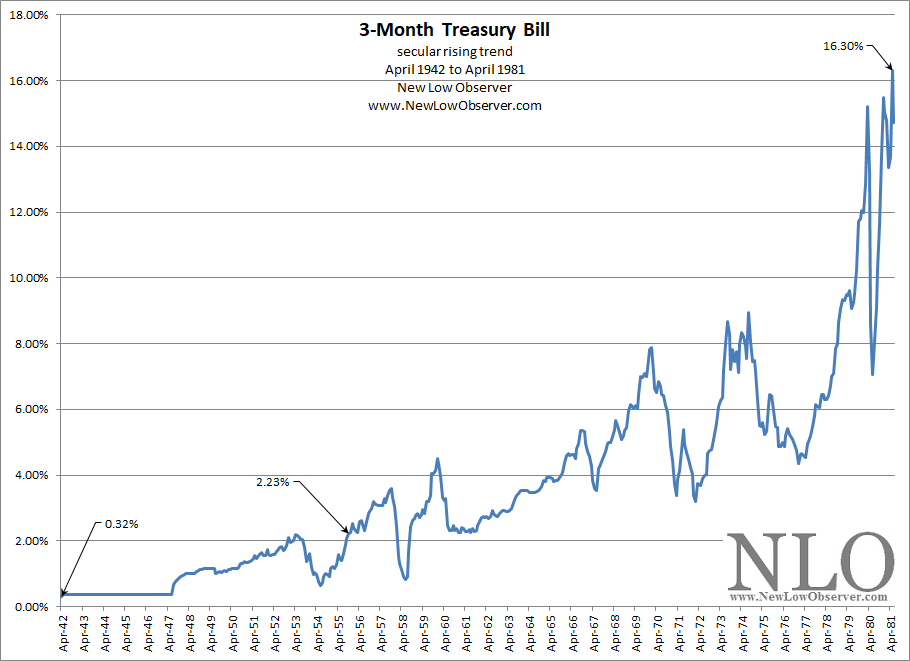
Yes, stocks can go down as a function of rising rates.  However, this needs to be put in context of the overall market.  As we start to emerge from a secular declining trend, from 1981 to 2008, to a secular rising trend, from 2008 to 2035,  the only comparisons of the current rising trend can only be done to the last secular rising trend from 1942 to 1981.

image

The “experts” claim this time is nothing like the postwar economy that led to the rate peak in 1981.  We’ll have to wait and see, for now the following data stands in opposition of the “experts.” Continue reading →

Interest Rate Monitor: September 2018

In this posting, we’ll continue on a theme that we’ve outlined since December 16, 2015, when we said:

“A single rate increase by the Federal Reserve in no way makes for a trend.  However, markets often lead the way and what initially seems ‘bizarre’ is only a natural change in regime, a change that we haven’t seen since the early 1940’s.”

The change “…that we haven’t seen since the 1940’s” is the secular trend in interest rates to go from an extremely low level to the opposite end of the spectrum, potentially to high double digit levels.  Our September 4,2014 posting suggested that:

“Investors anticipating a general rise in interest rates should feel some comfort in knowing that most manager in the utility sector are ready for what is to come.  Rising interest rates are not an automatic death sentence for utility stock prices or earnings.   In fact, the early stages of rising interest rates may see utility stocks match or exceed the returns of non-interest rate sensitive stocks, on a total return basis.  Only when the outlook is cloudy will it become difficult to offer projections that are in line with prior expectations.”

We have been consistent in the belief that the secular trend in interest rates is higher instead of lower.  With this in mind, we are presenting our upside targets (resistance levels) for the daily 3-month Treasury rates.  We use the daily 3-month Treasury rates simply because it precedes all Federal Reserve rate increases and decreases since 1934 (100%).

Continue reading →

Interest Rate Monitor: August 2018

Last year, we said the following of interest rates:

“When it comes to financial markets, the trend is your friend.  In the case of interest rates, more specifically the 3-month Treasury, the trend is up.”

At the time, the daily 3-month Treasury rate was at 0.98%.  Today, the 3-month Treasury sits at 2.05%, more than double the level from last year.

Continue reading →

Inverted Yield Curve Self-Fulfilling?

In the Crain’s Cleveland Business July 17, 2018 article titled “Fed chiefs look to yield curve for insights into inflation, state of economy,” Atlanta Fed President is quoted as saying that inversion [of yield curve] could be a self-fulfilling prophecy if investors believe it will bring recession.

image

When we looked at the yield curve chart that was provided in the article, it seemed that the either a recession coincided with inversion or inversion coincided with recessions.  However, there was little in the way of indicating that awareness of a pending inversion would lead the public to behave in a manner that would precipitate a recession.

image

It seems that there is enough coincidence of a narrowing of the yield curve and a recession to suggest that if it were a self-fulfilling prophecy then the period of 2010 was the beginning of that process.  The year 2010 happens to be the period when the recession was considered to have ended. Yet, at the time there was no discussion of inversion and self-fulfilling prophecies.

It seems odd for a Fed Bank president to suggest that if people don’t believe it then maybe it won’t happen.

Interest Rate Monitor: Targets

In this postings, we will present upside and downside targets for the 3-month Treasury based on the work of Edson Gould.

Rates Up, Utilities Down? Nope!

In a Bloomberg article dated March 14, 2018, it cites a prevailing theme about utilities and interest rates.

“The popular ‘buy banks, sell utility stocks’ strategy, built in anticipation of higher interest rates, is unraveling.

“Utilities were the only gainers in the S&P 500 Index on Wednesday, with the industry that’s seen hurt most by rising Treasury yields heading for its longest rally since November. Financial shares, beneficiaries of higher borrowing costs, sank 1.4 percent for a third day of declines.”

image

While this is a small timeframe to measure the performance of any industry, it does shed some light on the popular interpretations about what a rising interest rate cycle will bring to the market.  One of the most pervasive claims is the interest rate sensitive utilities will suffer with the advent of rising interest rates.

As pointed out in our September 4, 2014 article titled “Utility Stocks and Rising Interest Rates”, we said the following:

“Investors anticipating a general rise in interest rates should feel some comfort in knowing that most manager in the utility sector are ready for what is to come.  Rising interest rates are not an automatic death sentence for utility stock prices or earnings.   In fact, the early stages of rising interest rates may see utility stocks match or exceed the returns of non-interest rate sensitive stocks, on a total return basis.  Only when the outlook is cloudy will it become difficult to offer projections that are in line with prior expectations.”

So far the market is in agreement with our long established thesis that utilities do well in the early stages of the secular rise in interest rates.

Continue reading →