Below are the downside support lines for Twilio Inc. (TWLO) from 2016 to 2017:
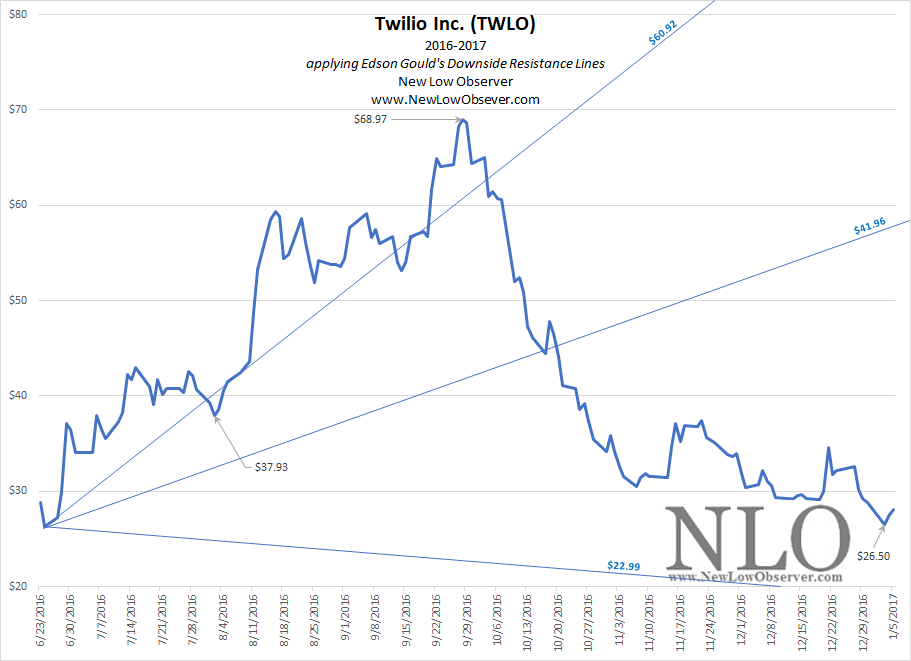
- $60.92
- $41.96
- $22.99
Below are the downside support lines for 2017 to 2020: Continue reading

Below are the downside support lines for Twilio Inc. (TWLO) from 2016 to 2017:
Below are the downside support lines for 2017 to 2020: Continue reading
Below are the Speed Resistance Lines for Microsoft (MSFT) from 1990 to 2002.

From 1993 to 2002, Microsoft experienced a similar parabolic peak to the 2009 to 2020 period. In that time, MSFT hit all of the downside targets that are generated by our Speed Resistance Lines.
Below we outline the Speed Resistance Lines for Microsoft from 2009 to 2020. Continue reading
Below are the downside targets for Shopify (SHOP):
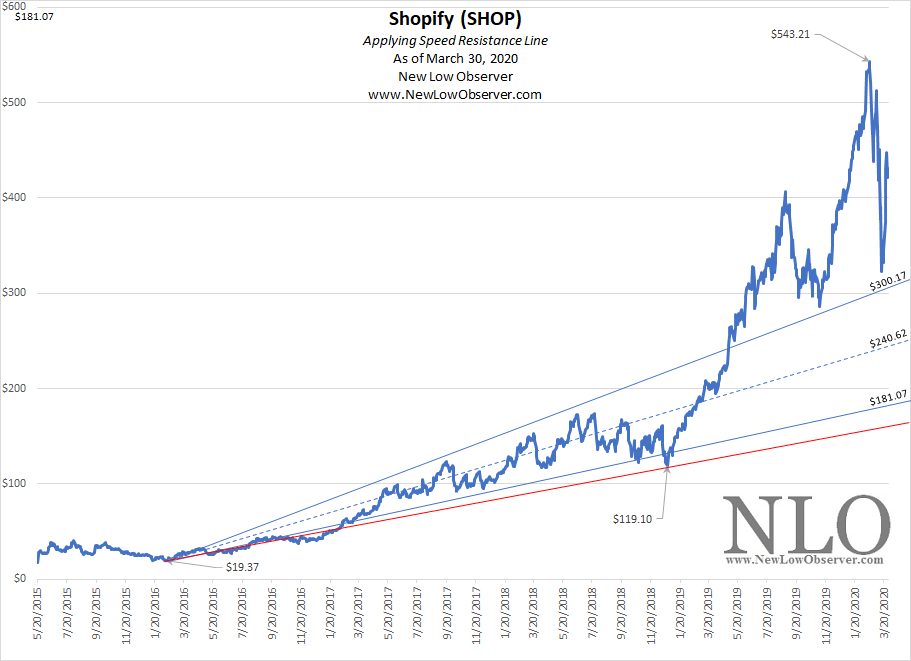
The history of parabolic increases suggests that Shopify’s mid-range target of $240.62 is not unusual and the extreme downside target is possible. We’ll update this chart upon request.
Posted in Edson Gould, SHOP, Speed Resistance Lines, SRL
On November 20, 2015, we posted the Speed Resistance Lines for Mercury General (MCY). The downside targets were:
The chart below highlights the date the SRL was published and the price action that has transpired since November 20, 2015.
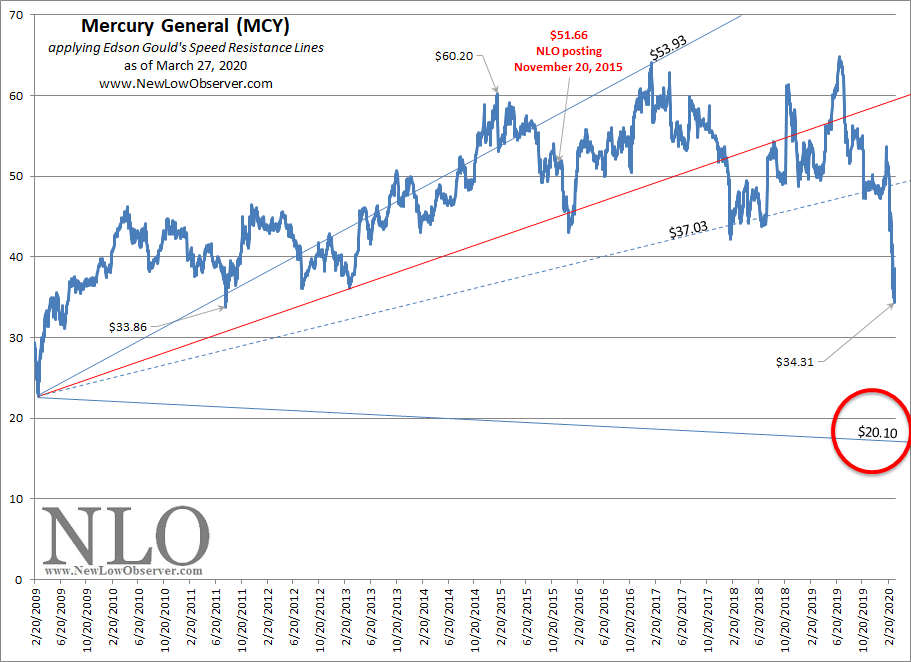
Our lurking worry? That the $20.10 target will be achieved. This leads to a downside range of $18-$20 from the current price of $38.88.
Posted in downside, Edson Gould, MCY, Speed Resistance Lines, SRL
On February 3, 2018, we said the following:
“In the past, we would normally apply the more passive Dow Theory downside targets instead of Edson Gould’s Speed Resistance Line. However, with the late stage parabolic move in the Dow Jones Industrial Average, the more aggressive downside targets are necessary in this instance.”
Our decision to utilize the “more aggressive downside targets” has proven to be well founded. However, since the February 3, 2018, a new peak has been achieved which provides different downside targets. This leads to an update of the downside and upside targets.
Below are the updates with extensive review of what to watch for (skip to the bottom for the Summary). Continue reading
On January 30, 2019, we said the following:
“The rebound has been exceptional but requires one last step in the process of confirming that the trend is actually up. In order for the trend to be CONFIRMED as up, the price of TPL needs to retest the $409 level and hold. Without holding at the $409 level, TPL would be expected to test the ascending $290.66 target, at minimum.”
Since January 30, 2019, Texas Pacific Land has had the following activity:
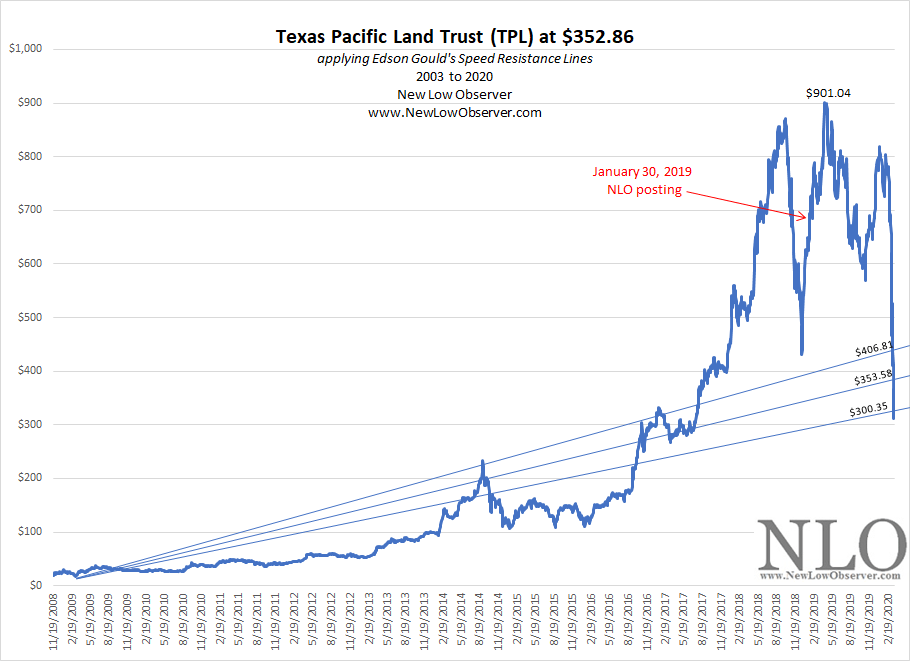
We’ve updated the Speed Resistance Lines because the peak in the price increased from our prior level at $871.99 to $901.04. Unsurprisingly, TPL has achieved our lowest downside target after bouncing at the $410 level.
Now our concern is how far below the $300 level that TPL might go. We seem to be in the early stages of the current market decline so we’ll have to update the downside risk as we go.
Posted in Edson Gould, SRL, TPL
Below are the downside targets for the SPDR Gold Shares (GLD).
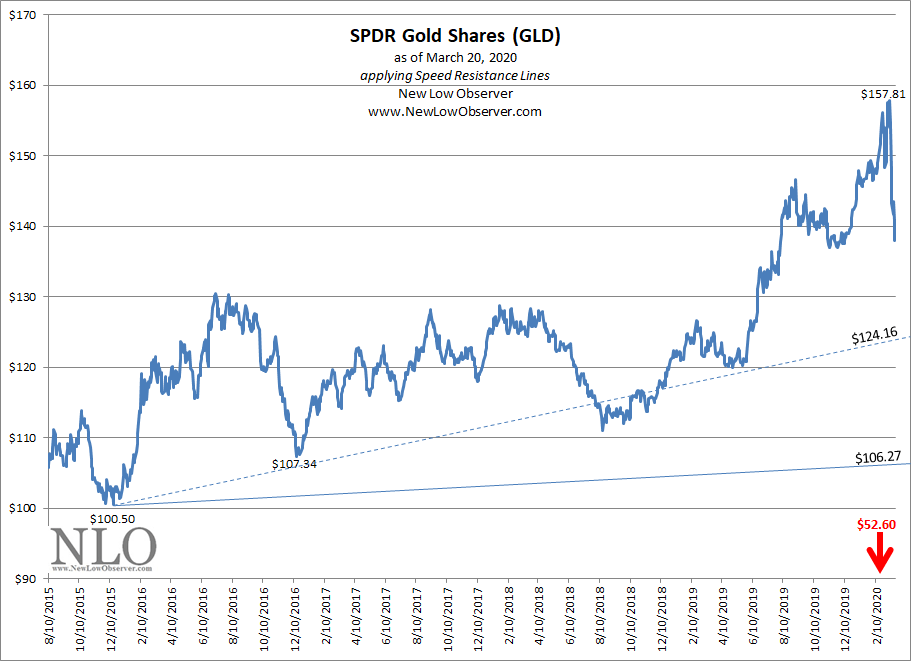
The $124.16 level is not an “official” downside level as it is only an intermediate point on the way to the actual level of $106.27. As we’ve seen in the past, the extreme downside target is always the concern. For GLD the extreme downside target is $52.60.
Top three stocks, commodities, or indexes that achieved our downside targets by year:
2020
2019
2018
2017
2016
How do we use Speed Resistance Lines? Once a target is achieved we assess the possibility of investment. If the target is not achieved we move on to the next stock.
There are approximately 15% to 20% of the SRLs that we’ve run that haven’t come to fruition, yet. However, in this current market decline, many that weren’t fulfilled are now getting completed.
Posted in Edson Gould, GLD, Speed Resistance Lines, SRL
Below are the downside targets for Virgin Galactic Holdings (SPCE).
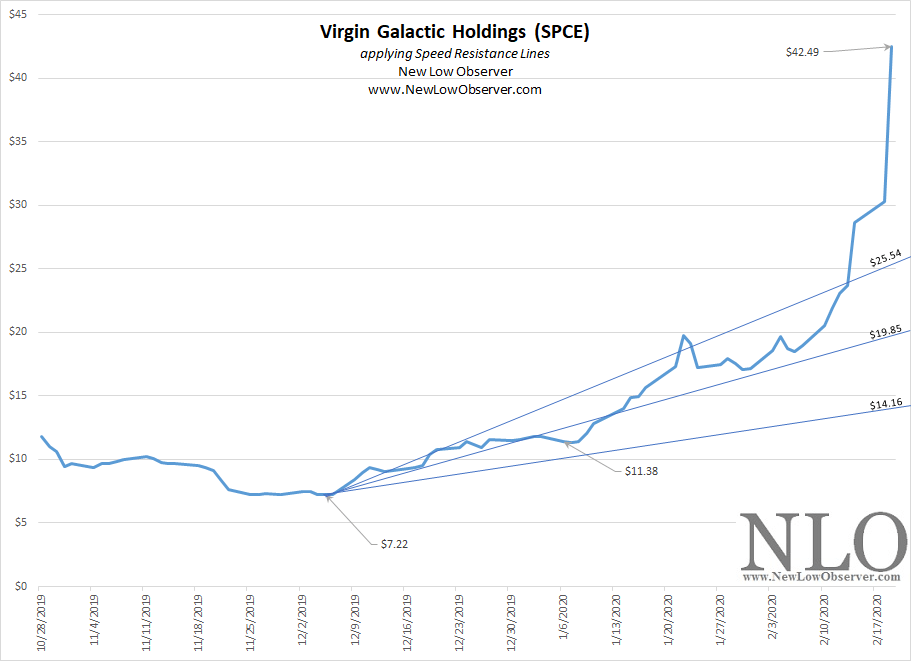
Virgin Galactic Holdings (SPCE) is creating a scenario where the extreme downside target could easily be achieved while being considered a normal “bounce.” The price would have to rise to above $60 before the above downside targets are no longer valid.
These situations don’t end well but in case the price doubles from the recent peak we provide the following downside targets.
Posted in Edson Gould, SPCE, Speed Resistance Lines, SRL
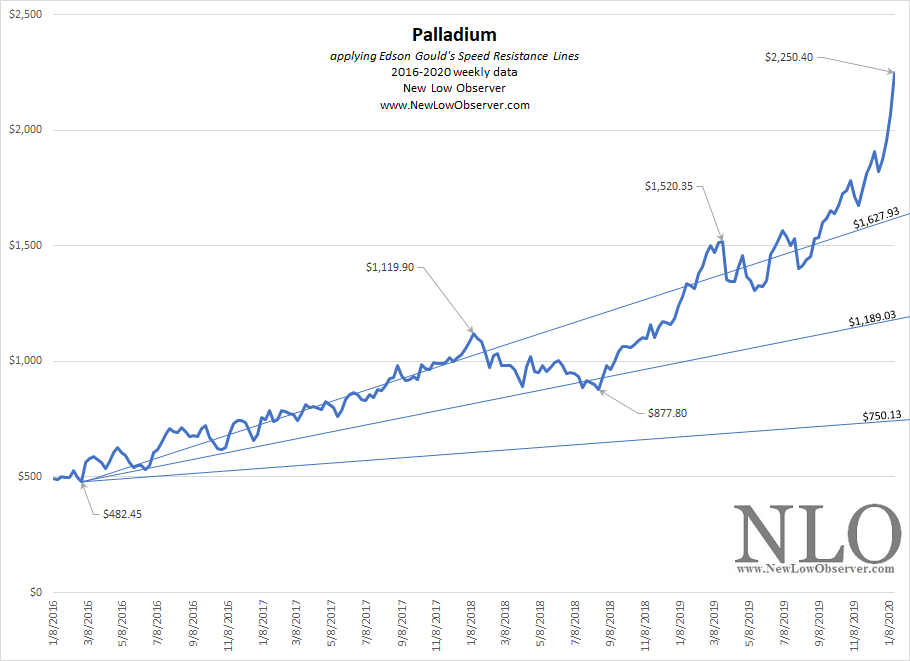
In reviewing the price history of Palladium and in light of the most recent parabolic increase, we have outlined the current increase in the price and compare it to the 1996-2003 rise and decline.
1996-2003
In the period from 1996 to 2004, the price of Palladium increased +837% and subsequently declined from the peak by -86.05%.
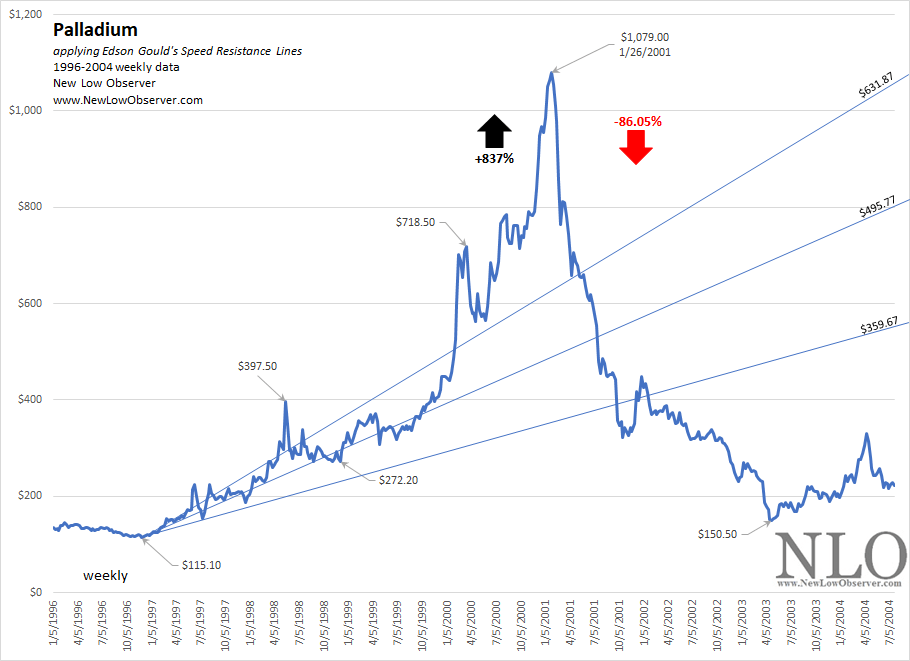
The chart above includes the Speed Resistance Lines (SRL) based on the work of Edson Gould. In this specific instance, the price of Palladium declined through all of the downside targets. In addition, the continued until it reached a low of approximately $150.50 or -58% below the $359.67 Speed Resistance Line.
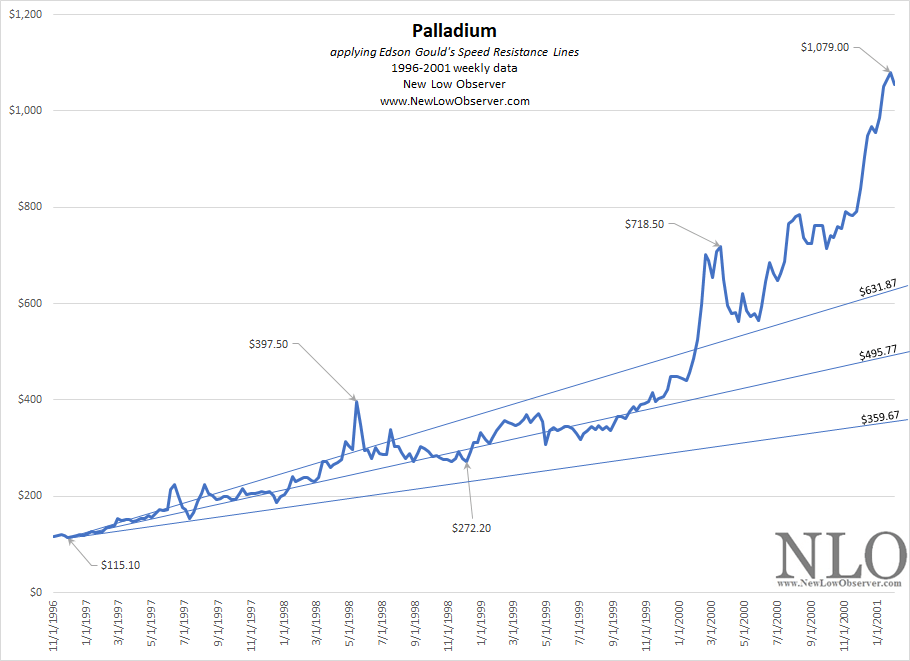
In the following review of the most recent increase in Palladium, we’ll compare the 2016-2020 run-up to the increase from 1996 to 2001 to identify the signs of what might come in the price going forward.
Then v. Now
Technically Speaking
When looking at the price of Palladium in both periods, we have identified the most important points contributing to our analysis.
The start to our review is the first intermediate peak after the low. In the case of the 1996-2004 period, that first peak was at $397.50. For the period of 2016-2020, that peak was $1,119.90. The subsequent lows that followed, $272.20 and $877.80, helped to establish the downside targets.
Worth noting is the decline from the initial peaks to slightly below the mid-range downside targets before a continuation of the rising trend to the second intermediate peaks at $718.50 and $1,520.35, respectively. In both cases, the decline from the second intermediate peaks are situated around the conservative downside targets at $631.87 and $1,627.93.
In both cases, the parabolic move ensues after the second intermediate peak, which is a considerable distance from the level of the conservative downside target.
Conclusion
Because of the precedent set in the period from 1996 to 2001, we expect that the conservative downside target of $1,627.93 will be achieved.
We could consider it luck if the price of Palladium were to decline to the mid-range level of $1,189.03 or the extreme target of $750.13. However, if the period from 1996 to 2003 is truly a precedent setting period then it would not be surprising to see Palladium decline to $750.13 as a normal reaction to the parabolic increase.
Posted in downside, Edson Gould, palladium, parabolic, Speed Resistance Lines
The price of palladium has increased significantly since 2016.

Naturally, parabolic peaks mean that the price is nearing a top. The downside prospects are the only clear consideration at this point in time. Below are the downside targets for the Aberdeen Standard Physical Palladium Shares ETF (PALL) that we have generated based on the most recent peak. Continue reading
Posted in Edson Gould, palladium, parabolic, Speed Resistance Lines
On September 14, 2018, we said the following of the downside targets for AeroVironment (AVAV), when the stock was trading at $116.24:
“The conservative downside target of $62.26 is a lock in our view. To put this in perspective, AVAV would have to increase to $160.62 before the $62.26 level isn’t a normal ‘dip.’”
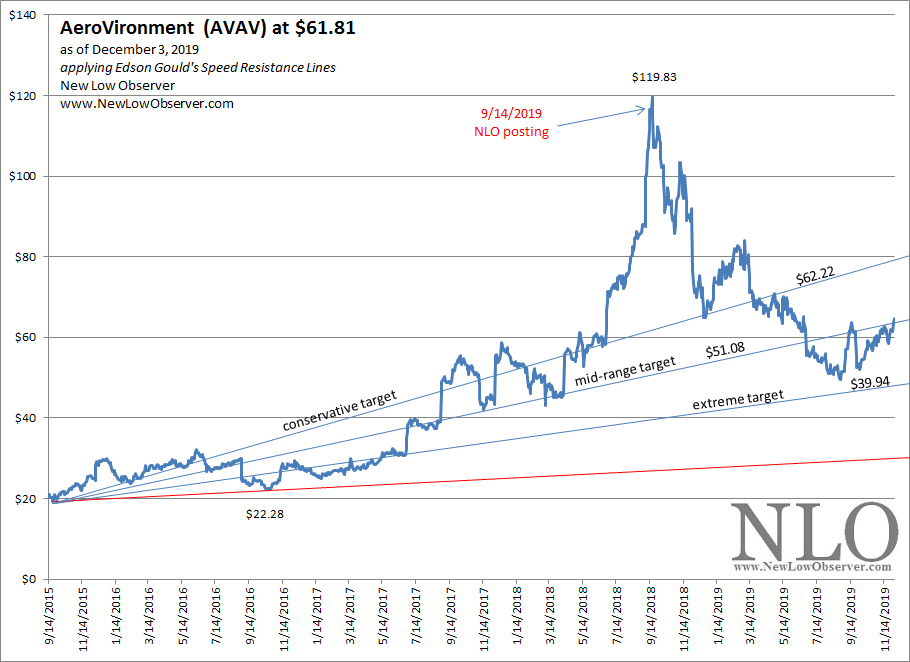
The numbers we based our downside targets on was with the assumption that AVAV could rise as high as $160.62, for a reasonable margin of error. Instead, AVAV peaked only two trading days later at $119.83 (the above chart has been adjusted to the peak).
The decline in AVAV has seen the stock fall as low as $49.54 on August 27, 2019, a drop of –58.65%. The most important element of the current decline is the ability of the stock price to remedy the preceding parabolic move. A drop of nearly-60% comes very close to fixing the previous disparity in the price.
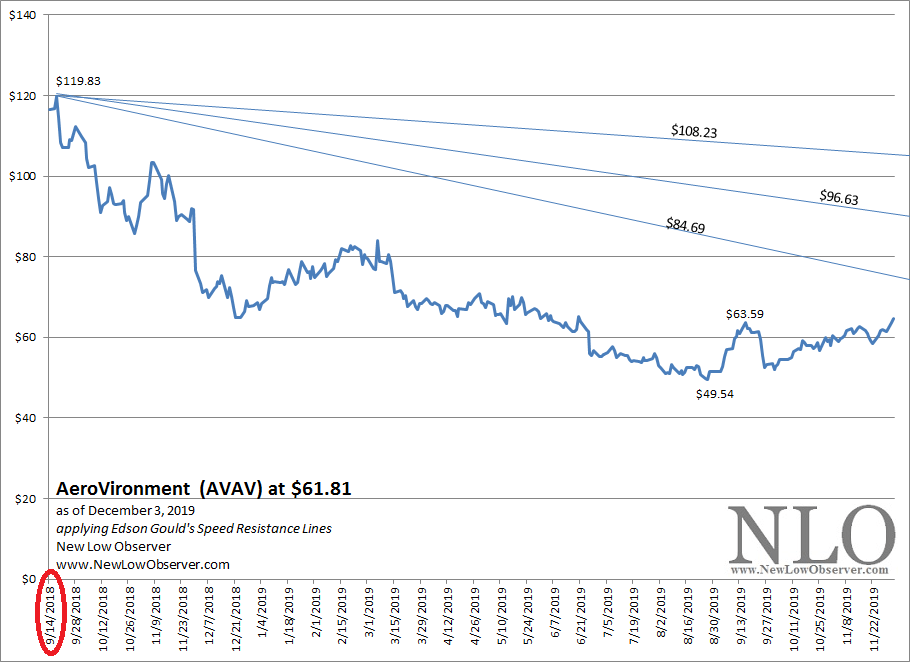
From the August low, AVAV has managed to rally to the latest price at $61.81. The power of the reversal is highlighted in the fact that the stock price rose from the $49.54 level then achieved the $63.59 price. From the $63.59, the stock declined but could not achieve a price lower than $49.54.
The upside resistance levels are as follows:
Speculators (as opposed to Investors) should take these levels to be the points when the continuation of the upside will reverse to the prior low, as a re-test. Investors, basing their assessment on the fundamentals, can strategically enter positions breaking their intended investments in thirds or halves.
Posted in AVAV, Edson Gould, parabolic, Speed Resistance Lines, upside target
History:
Revised GE Upside Targets
After demonstrating a history of consistency, in terms of the general trend in the stock price of General Electric, we must revise the Speed Resistance Lines that were issued in January 1, 2019 to more accurately reflect the changes that have occurred in the last 11 months.
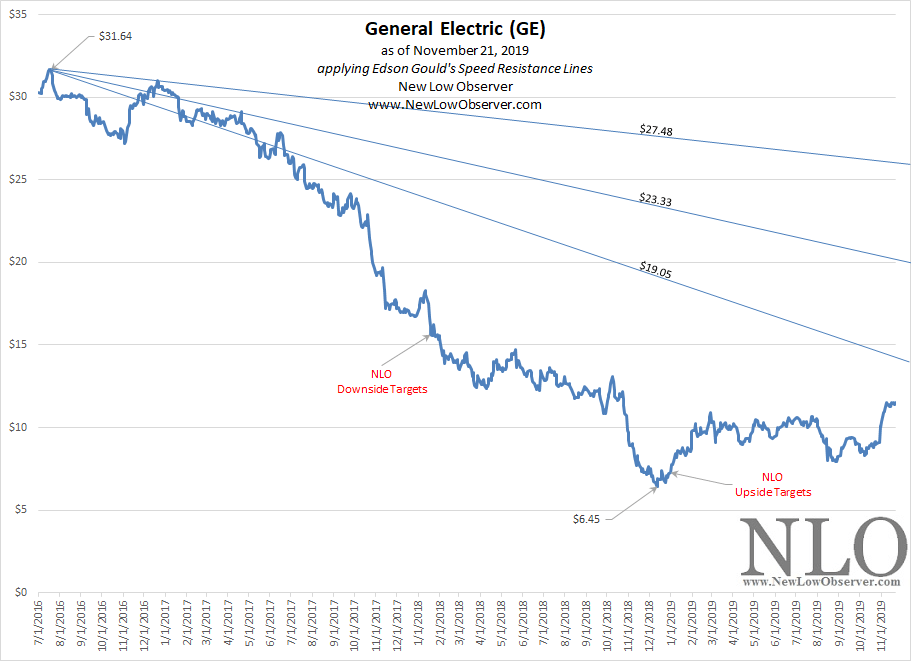
The upside resistance targets are as follows:
It would be a major coup for the price of General Electric to exceed the conservative upside resistance target at $19.05. For now, we will reiterate that almost all stocks achieve the conservative targets through either the passage of time or increase/decrease in price.
As was said in January 2019, “GE could achieve all of the designated upside resistance targets and still be in a declining trend.”
Posted in Edson Gould, GE, General Electric, upside target
In our previous work, we have outlined the impact of dividends and the historical precedent related to the qualitative elements of Anheuser-Busch InBev (BUD). Why have we put so much focus on ONLY one fundamental element as it relates to a stock and its future prospects. As stated by Geraldine Weiss in her book Dividends Don’t Lie:
“The philosophy that the dividend yield of a quality company can reveal volumes about a stock’s future performance does not lend itself merely to a certain tax climate or a particular market cycle. It is a basic principal. one that serves as a faithful guide through even the most confounding stock market phases (page 10).”
Many argue that such a narrow perspective on esoteric points regarding the dividend doesn’t tell the whole story. Our writing on this topic since calling the bull market in 2009, and starting this site, highlights the exceptional consistency of the perspective that we have offered.
Price Reveals Fundamentals, Fundamentals Reveal Price
According to Charles H. Dow, co-founder of the Wall Street Journal and creator of the indexes that bear his name:
"The one sure thing in speculation is that values determine prices in the long run. Manipulation is effective temporarily, but the investor establishes price in the end. The object of all speculation is to foresee coming changes in values. Whoever knows that the value of a stock has run ahead of price and is likely to be sustained can buy that stock with confidence that as its value is recognized by investors, the price will rise (Dow, Charles H. Review and Outlook. Wall Street Journal. February 25, 1902.)."
With this in mind, we will venture into the indication that are provided by the activity of the price for Anheuser-Busch InBev.
Downside Speed Resistance Lines
Below are the Downside Speed Resistance Lines (SRL) for Anheuser-Busch InBev (BUD) covering the period from July 2009 to November 2019.
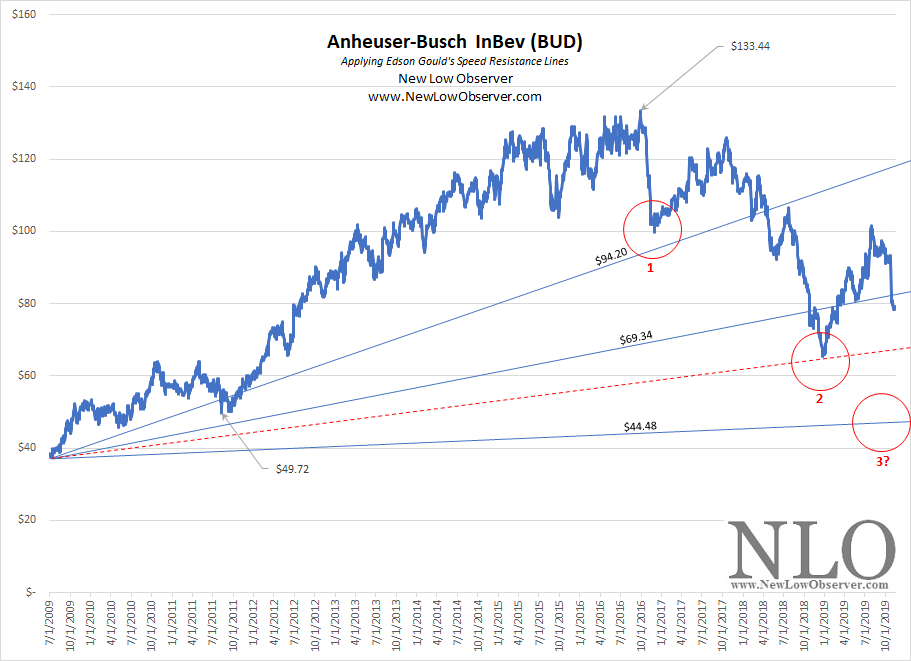
The downside targets based on the data from 2009 to the present are:
We can see that BUD has managed to decline through the conservative and mid-range targets. All that remains is the extreme downside target of between $44.48 and $47.70. The lack of historical precedent does not allow for the richer analysis of the price that we’d normally like to do. Such analysis makes for what we believe would be better interpretation of the price activity.
Three Steps Rule
In addition to Gould’s Speed Resistance Lines, there is the theory of the Three Steps Rule. According to Gould:
Our Three Step Rule (not to be confused with our Three Step and Stumble Rule, Which refers only to monetary conditions) has been helpful over the years in our attempt to project stock market moves and to anticipate stock market tops and bottoms.
Our Three Step Rule says: In any stock market move, up or down, large or small or in between, expect three steps but be prepared for a fourth.
It applies to large moves as well as small moves.
Three steps up in an advancing market and three steps down in a declining market usually exhaust the bullish potential accumulated at the bottoms and the bearish potential accumulated at tops- but sometimes there is a fourth step (Edson Gould Reports. Edson Gould’s 1975 Forecast. November, 1974. page 8. ).
We have included, in the chart above, the Three Steps (red circles). In this case, the third “step” cannot occur unless it is at some point below the second “step.”
Upside Speed Resistance Lines
Below are the Upside Speed Resistance Lines (SRL) for Anheuser-Busch InBev (BUD) covering the period from September 2016 to November 2019.
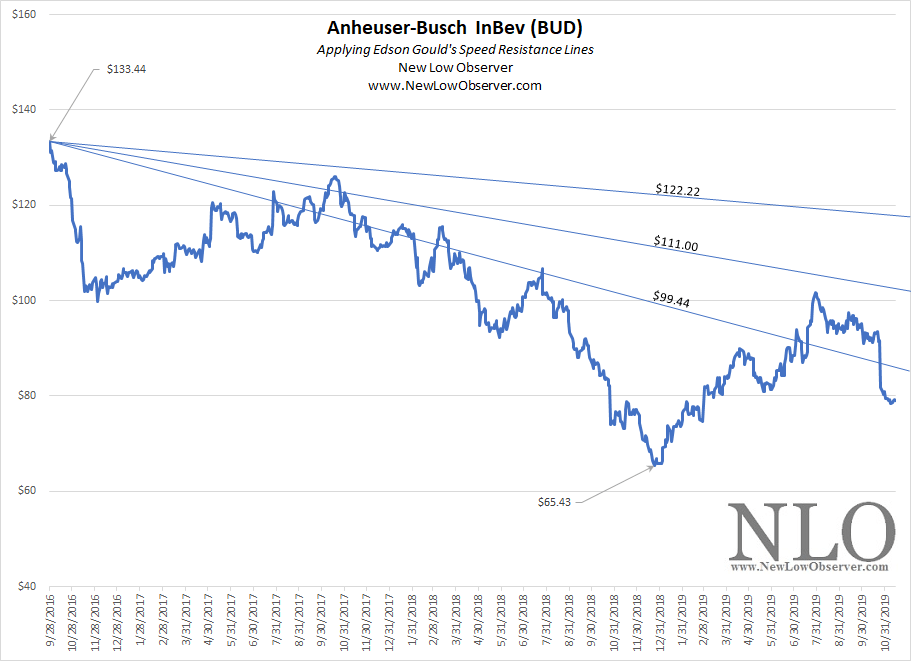
The upside targets based on the data from 2016 to the present are:
As with downside prospects there must be upside resistance. From the all-time low set in late 2018, BUD has managed to climb as high as $101.58. However, not achieving the $111.00 upside resistance and then falling below the $99.44 upside resistance level suggests, at minimum, a re-test of the $65.43 level.
Speed Resistance Lines are based on the work of Edson Gould who was famous for precisely calling market tops and bottoms and widely quoted in Barron’s throughout the 1970’s. How powerful are the indications provided by Gould’s SRL?
Among the many posting we have on the topic, our April 26, 2012 on the downside risk for Chesapeake Energy (CHK) titled “A Warning for Chesapeake Shareholders” suggested that although the stock was trading at $18.10, CHK could potentially decline as low $0.67 as a normal reaction to the prior peak. On November 12, 2019, CHK had a closing price of $0.67.
Posted in BUD, Edson Gould, Speed Resistance Lines, SRL, three step rule
Below are the downside targets for Netflix (NFLX).
Below are the downside targets for Roku Inc. (ROKU).
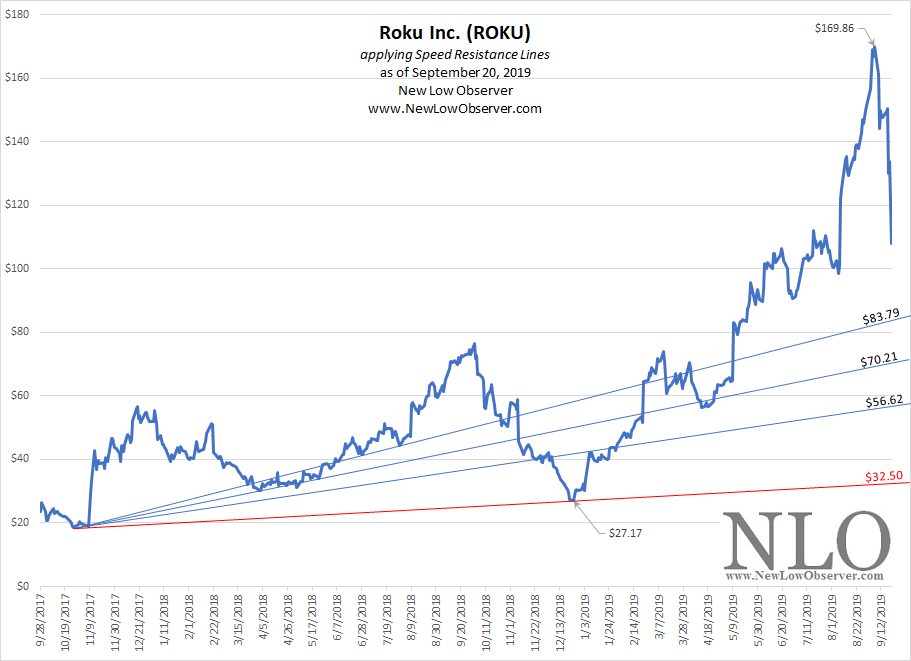
Our experience with all Speed Resistance Lines is that the conservative target is going to be achieved, no matter the reason. The targets are as follows:
Posted in downside, Edson Gould, ROKU, Speed Resistance Lines