Below are the upside and downside targets based on the work of Edson Gould’s Speed Resistance Lines. Continue reading
- Japan
- Market Indicator
- Price Momentum Indicators
- Richard Russell
- Silver
- Speed Resistance Lines
- U.S. Dividend Watch List

Below are the upside and downside targets based on the work of Edson Gould’s Speed Resistance Lines. Continue reading
Posted in Crude Oil, Edson Gould, Speed Resistance Lines, upside target
Tagged members
On May 22, 2019, Citi analyst Itay Michaeli suggested that Tesla Motors (TSLA) could decline as low at $36.

Meanwhile, on May 21, 2019, Morgan Stanley has put a decline to $10 on the stock price into play.

Our work of September 8, 2018 laid bare the technical attributes that were likely outcomes for Tesla Motors. The upside of using technical indications is that it leaves out the narrative and only includes precedent, both positive and negative.
In that 2018 posting, we offered two types of technical review, Speed Resistance Lines (SRL) as outlined by Edson Gould and “Three Peaks and a Domed Housed (3PDh) as presented by George Lindsay.
Already, Tesla has achieved the $200.17 price target that was set by the SRL analysis. We’re curious to see if the $76 target is achieve as outlined in the 3PDh analysis.
As a reiteration of the more conservative downside analysis from September 8, 2018:
“The extreme downside target of $128.33 would be the last stop before a retest of the $100 level. In all the prior history of stocks that we’ve tracked using the SRL, 80% eventually go back to the extreme downside target before the bottom drops out or the stock attains new highs. Based on this observation, we’re highly confident that given the nature of Tesla, declining to the $150 to $127 level is a lock.”
Posted in 3PDh, Edson Gould, George Lindsay, SRL, TSLA
In the period from October 3, 2018 to November 23, 2018, the price of Texas Pacific Land Trust (TPL) has declined from a recent high of $871.99 to the current level of $551.99, a decline of –36.69%. The question on everyone’s mind is, “how low will the price go?”
Using past as precedent, we looked at the Speed Resistance Lines [SRL] as outlined by Edson Gould in the period from 2003 to 2016. First, we remind our readers that under the extraordinary period of panic, from June 29, 2007 to March 9, 2009, TPL saw a decline of -72%.
Using the 2009 low, we see the $25.65 level as the pivot and the $230.82 level as the parabolic peak. Those points give us the following SRLs:
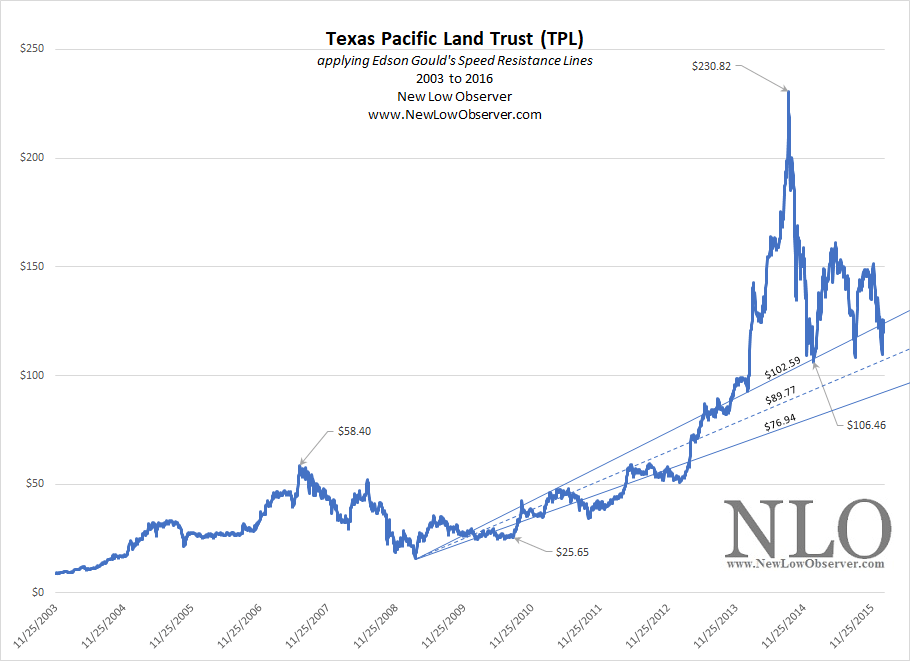
The entire decline was –53.87% and saw the price of TPL achieve the conservative downside target of $102.59 and with the passage of time the price almost accomplished the $89.77 mid-range target.
Fast forward to November 23, 2018 where we see the peak of TPL at $871.99. If we allow for only the conservative downside target to be achieved then TPL will go as low as $397.12. However, remember back in December 9, 2010 when we said, in an article titled “Real Estate: The Verdict is In,” “…we feel that real estate has a six to nine year stretch of rising prices or ‘trading’ in a range and decreased foreclosures.”
“…we feel that real estate has a six to nine year stretch of rising prices or ‘trading’ in a range and decreased foreclosures.”
Since our prescient article in 2010, in the face of shadow inventory claims that were supposed to keep prices down, we have seen a clear rising trend in the price of real estate and a significant decrease in foreclosures. Now, with the passage of 8 years, we believe that TPL will push the limits of downside action and achieve the extreme downside target as seen in the chart below. Continue reading
Posted in Edson Gould, parabolic, real estate, SRL, Texas Pacific Land, TPL
Below are the downside targets for Facebook (FB) based on the decline from the July 25, 2018 peak at $217.50. Continue reading
Posted in downside, Edson Gould, FB, parabolic
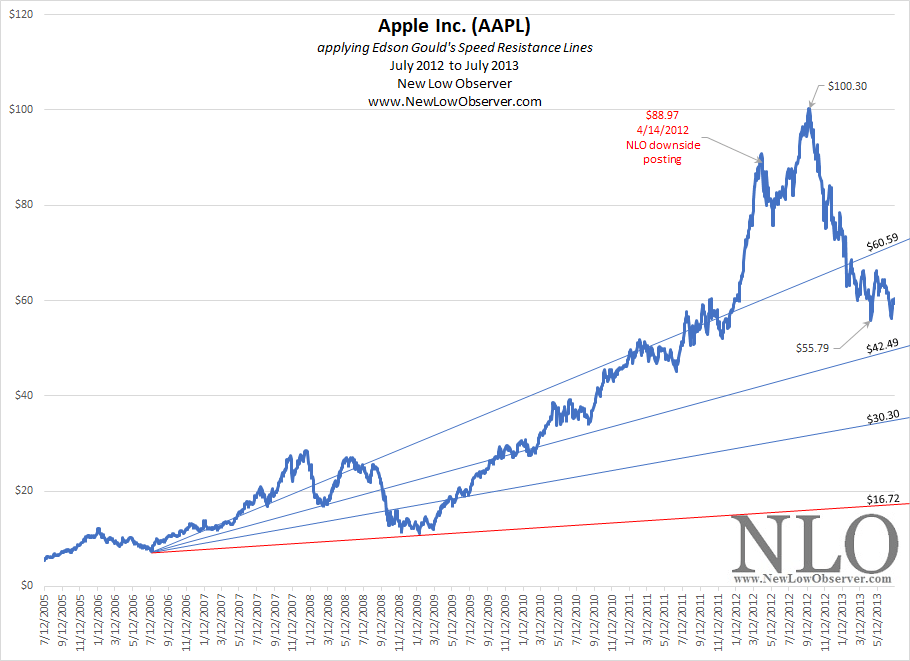
On April 14, 2012, we provided the following downside targets for Apple Inc. (AAPL):
| pre-split price | post-split price |
| $424.15 | $60.59 |
| $297.43 | $42.49 |
| $212.08 | $30.30 |
| $117.05 | $16.72 |
Along with the downside targets we included a charting of the expected levels, as seen below on a split adjusted basis:
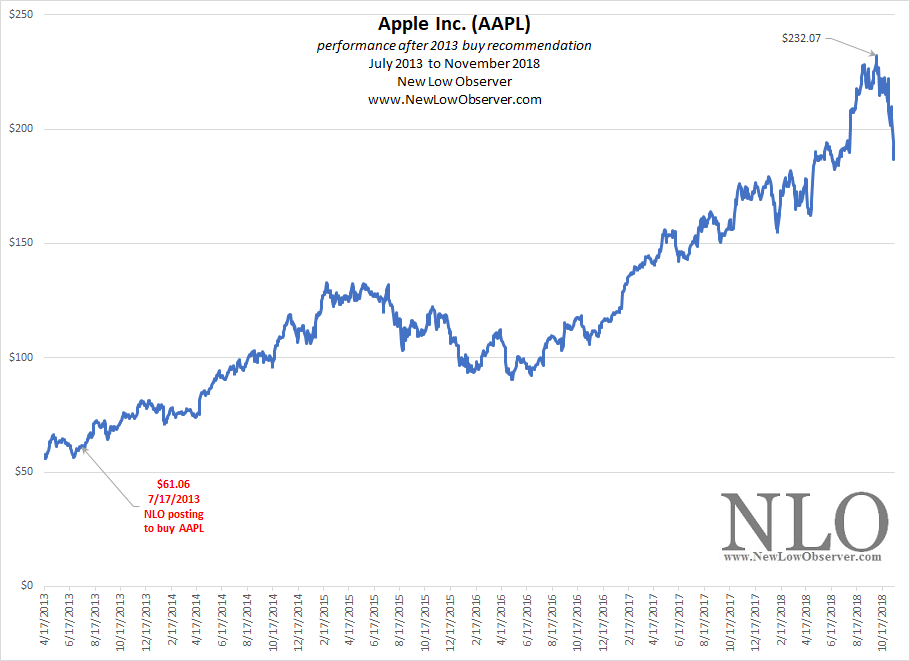
On July 17, 2013, we said the following of of Apple:
“Currently, Apple is demonstrating a basing pattern that if successful, could result in a breakout to the upside. At the current levels, we wouldn’t be opposed to buying some shares of Apple with the expectation that the stock could decline an additional –25% to –35%.”
Since July 17, 2013, Apple’s price has seen the following breakout to the upside:
Below are the Speed Resistance Lines based on the work of Edson Gould as of November 19, 2018. As has been the case in the past, we can only be confident of the conservative downside target being achieved. Continue reading
Posted in AAPL, downside, Edson Gould
From the stunning peak of $8,700 in April 2018, Swiss National Bank has declined –36.78% as of November 13, 2018. What might be different about this time, versus when SNBN was at $4,449 or $5,940 is that when the price declined it never achieved the conservative downside target of the Speed Resistance Lines [SRL].
| peak | extreme | mid-range | conservative |
| $8,700.00 | $2,900.00 | $3,657.00 | $4,414.00 |
| $4,449.00 | $1,483.00 | $2,240.00 | $2,997.00 |
| $5,940.00 | $1,980.00 | $2,737.00 | $3,494.00 |
The latest decline has hit the conservative downside target at $4,414 and is in the process of retesting that level, as seen below.
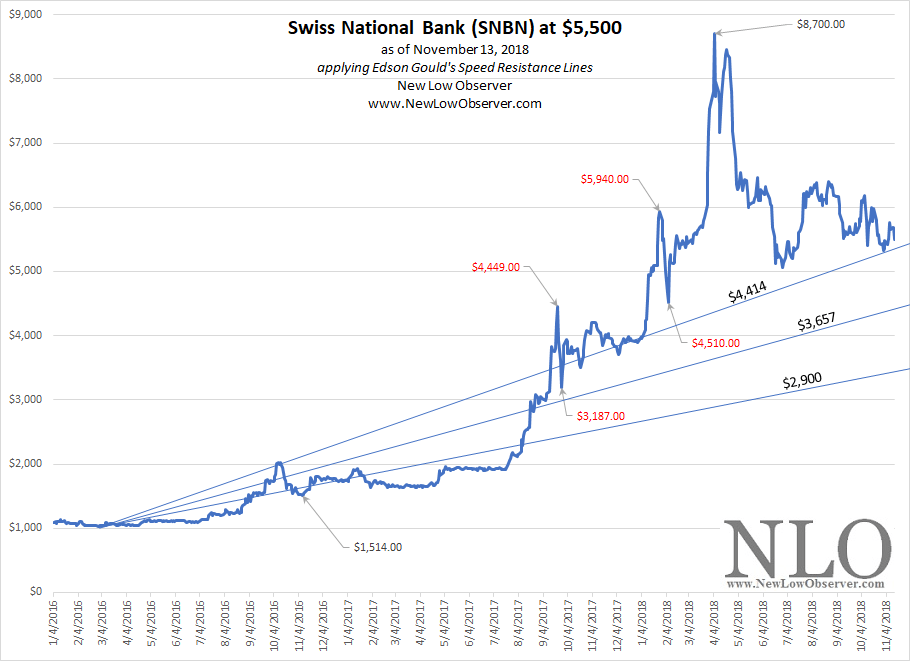
Watch the $5,500 level closely as a continued decline could have broad reaching impact on some popular tech stocks.
Posted in Edson Gould, SNBN, Speed Resistance Lines, SRL
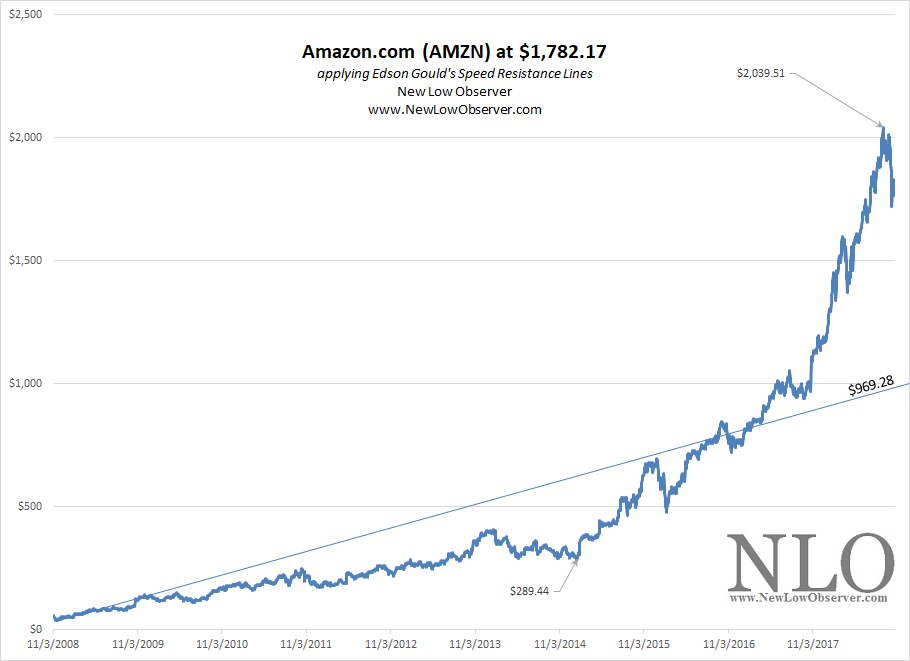
On October 25, 2018, in after-hours trading, Amazon.com (AMZN) was trading down to the level of $1,664.00.
We’ve tried the Speed Resistance Lines on this stock in the past and it is one of the few that has not achieved the conservative downside target. In spite of previous failures, here we go with the minimum downside target for AMZN, let’s watch as it defies (again), our minimum target of $969.28.
Posted in AMZN, Edson Gould, Speed Resistance Lines, SRL, The Study of Failure
Below are the downside targets for Align Technologies (ALGN) based on the high of $392.98.
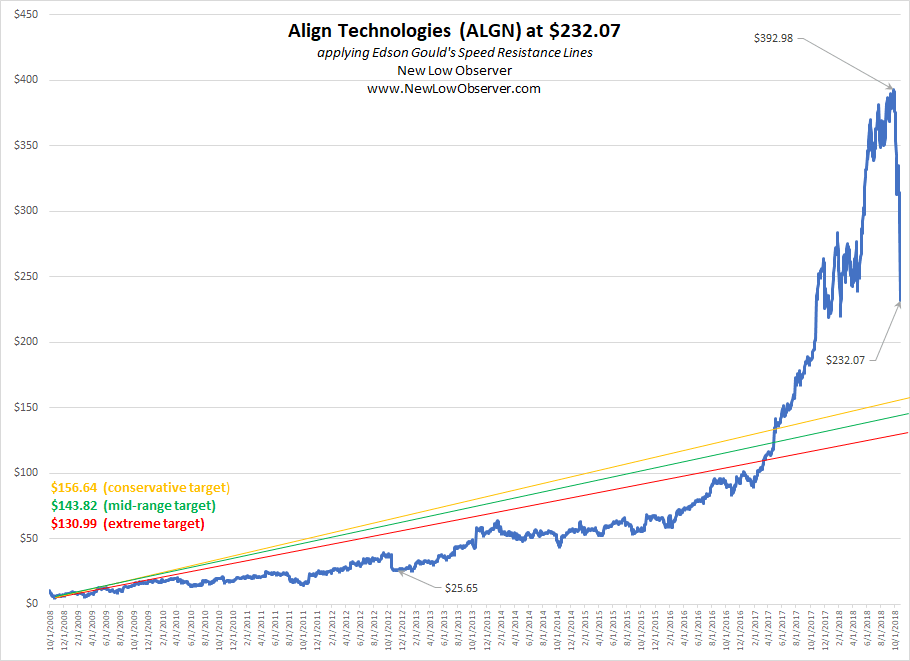
The price movement of ALGN from the 2008 low to the current level is staggering. This partially explains why the reaction is, and should be, devastating for those who bought the stock within the last several months. Our experience has been that the $156.64 will be achieved, at minimum.
Posted in ALGN, Edson Gould, Speed Resistance Lines, SRL
In after-hours activity, Advanced Micro Devices (AMD) had declined approximately -17% from the closing price of $22.79 to $17.69.
The history of AMD suggests that the stock will decline as low as $6.30 and possibly to the sub-$2.00 level. For the time being, we have outlined the following downside targets:

Posted in After Hours, AMD, Edson Gould, Speed Resistance Lines, SRL
Below are the valuation targets for ABM Industries (ABM) for the next 10 years. Continue reading
W.W. Grainger (GWW) is a stock that we currently hold and has run-up significantly in the last year. In this post we will review Edson Gould’s Speed Resistance Lines [SRL] and Altimeter for GWW.
Speed Resistance Lines are most often used by us to estimate downside targets. Based on the increase from the August 28, 2017 low and the August 21, 2018 high, we have arrived at the following downside targets.
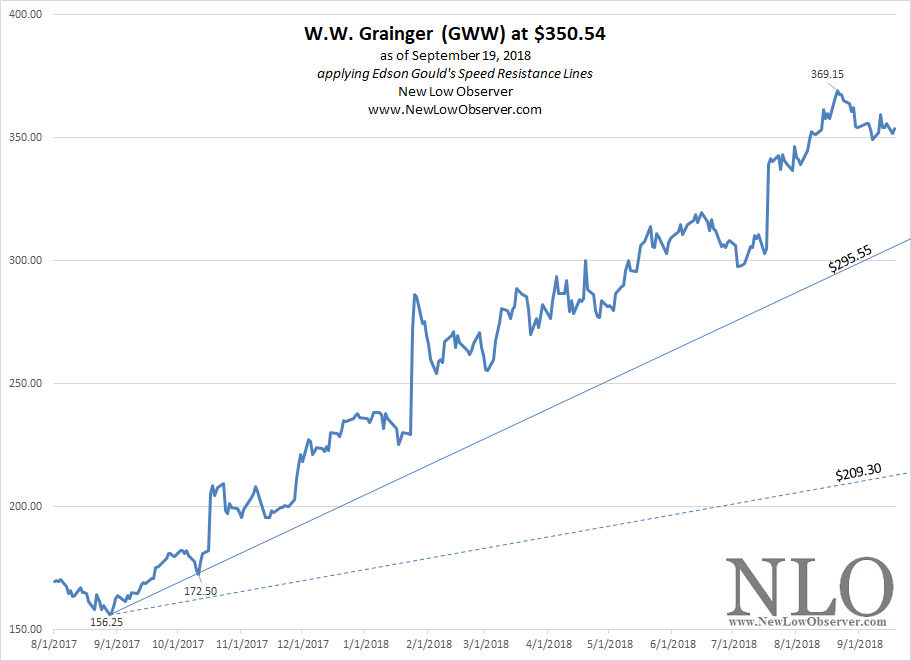
It should be noted that the chart above does not include the extreme downside target. If the August 21, 2018 price is the peak then our best guess is that GWW will decline below the August 28, 2017 low. Our interpretation on the SRL may not play out for a while, however, the Altimeter adds significant insight.
Posted in downside, Edson Gould, GWW, Speed Resistance Lines, SRL
According to Morningstar.com, Harsco Corp. (HSC) “… provides industrial mill services to steel and nonferrous metal producers in more than 30 countries, including the United States.”
The history of Harsco’s (HSC) price history is important to the current activity in the stock price. In the review, we cover the history of the stock price based on the Edson Gould’s Speed Resistance Lines [SRL] with Dow Theory.
Downside Target Review
In the period from 1982 to 1990, the price of HSC rose from a low of $2.50 to a high of $9.66. Based on this information, we arrived at the following downside targets:

We’ve highlighted the point made in Dow Theory that a stock will often retest a previous low after a prior peak in the stock price. In this case, the retest level was the $5.88 price which was ultimately penetrated to the downside to the ultimate low of $4.50 in 1990.
In the period from 1990 to 2000, HSC had the following downside targets:
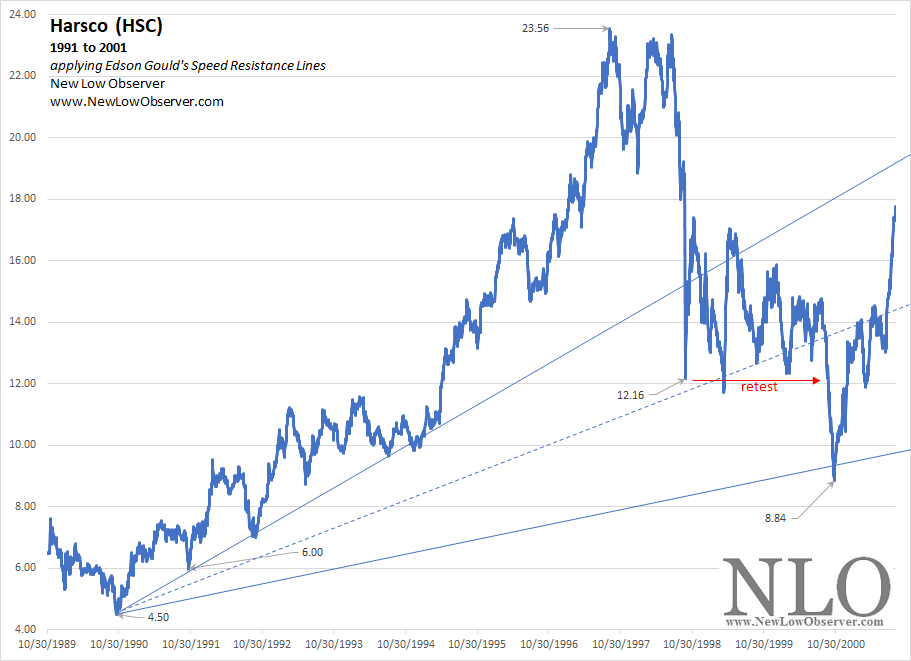
The Dow Theory retest after a major decline lasted over a period of two years from 1998 to 2000. All of the downside targets were achieved.
In the period from there was a decline that appears worth mentioning because it occurred within a rising trend that culminated in peak price that was three times the 2002 high. In the runup from the 2000 low to the 2002 peak, HSC had the following downside targets:
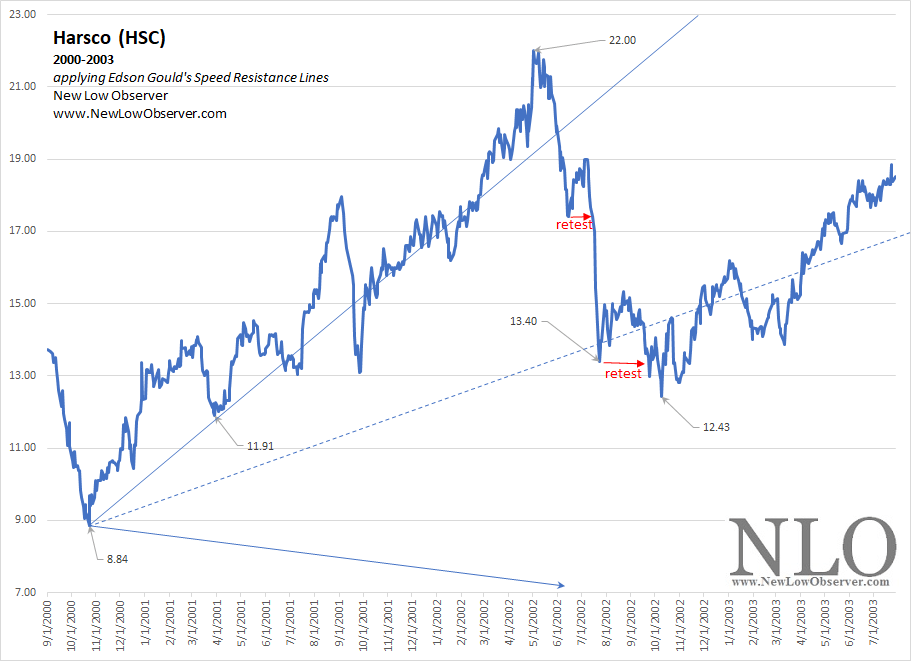
The Dow Theory retest after the peak was consistent and could have been at either of the two points indicated on the chart. If you missed the first indicator then you had a second shot at getting the retest at the second major low in the stock.
Worth pointing out is the fact that the extreme downside target of $7.33, from a technical standpoint, was suggesting much lower levels than could be indicated on this chart. We wonder if the low of HSC in 2016 at $3.67 might have been indicated in the SRL of 2000 to 2003.
2000-2018: Upside and Downside Targets
Below are the upside and downside targets based on the low of 2000 to the peak of 2016.
According to Yahoo!Quotes, Advance Auto Parts (AAP) “… provides automotive replacement parts, batteries, accessories, and maintenance items for domestic and imported cars, vans, sport utility vehicles, and light and heavy duty trucks.”
Below are the downside support targets based on the high of $199.38 and the upside resistance targets based on the $79.26 low.
Posted in 50% principle, AAP, Edson Gould, Speed Resistance Lines, SRL
According to Yahoo!Finance, ShotSpotter Inc. (SSTI) is, “…provides software-as-a-service based gunshot detection solutions for law enforcement officials and security personnel in the United States, South Africa, and internationally.”
ShotSpotter IPO’d on June 7, 2017 and was priced at $11. In the last 15 months, SSTI has managed to increase the share price +471%. Based on the closing price of $62.81, we have the following downside targets:
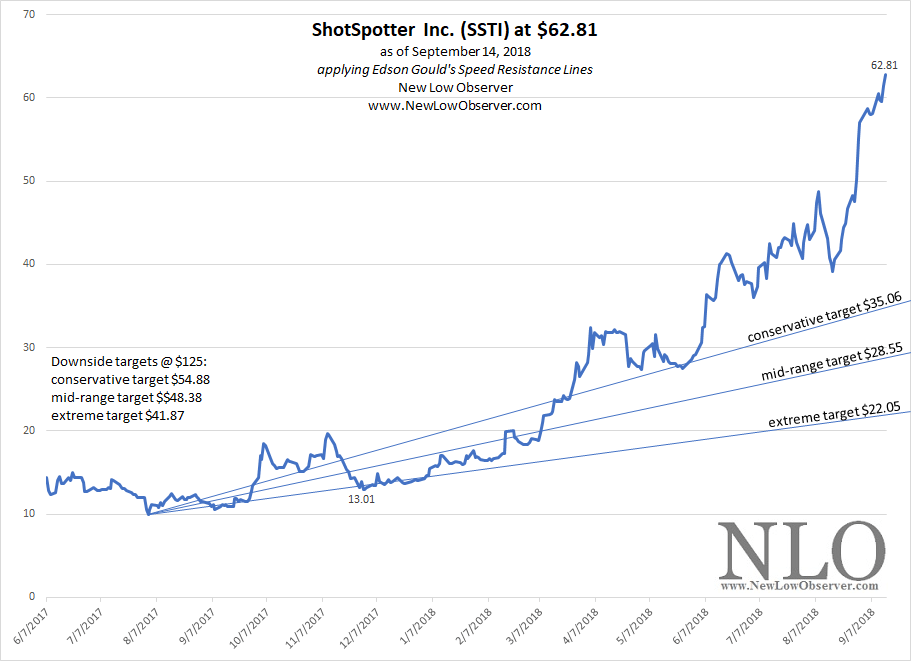
The downside target for SSTI are included in case the stock were to double for the current level. SSTI could increase to $85.65 and still be within range of the $35.06 downside target.
Posted in Edson Gould, parabolic, Speed Resistance Lines, SRL, SSTI
AeroVironment is described on Yahoo!Quotes as:
“AeroVironment, Inc. designs, develops, produces, supports, and operates a portfolio of products and services for government agencies and businesses.”
Below are the downside targets as a consequence of the parabolic rise that has occurred since the September 2015 low.
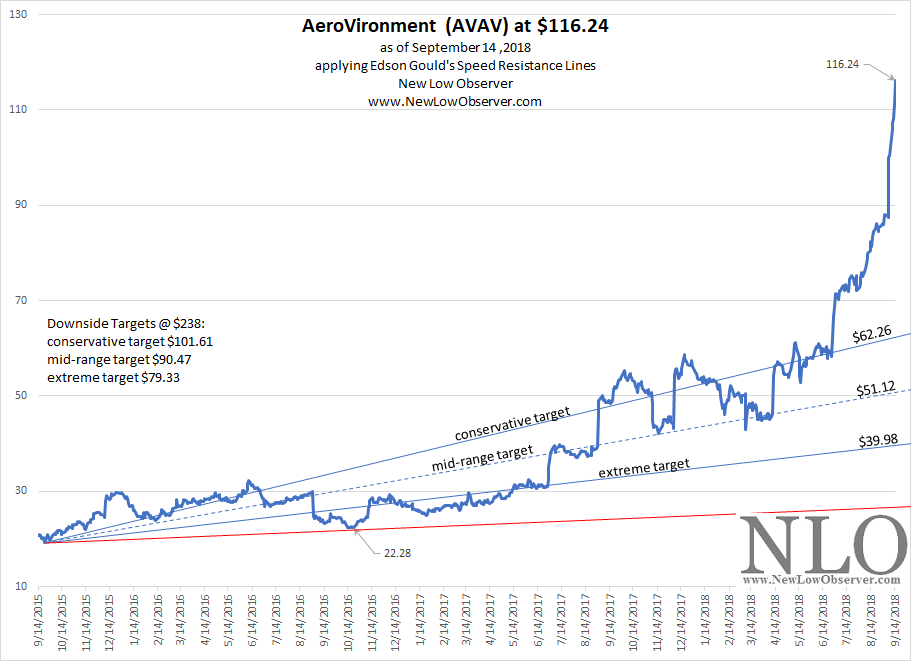
The conservative downside target of $62.26 is a lock in our view. To put this in perspective, AVAV would have to increase to $160.62 before the $62.26 level isn’t a normal “dip.”
Posted in AVAV, Edson Gould, parabolic, Speed Resistance Lines, SRL