Category Archives: Edson Gould

Dentsply Sirona: Dodging Bullets

Review

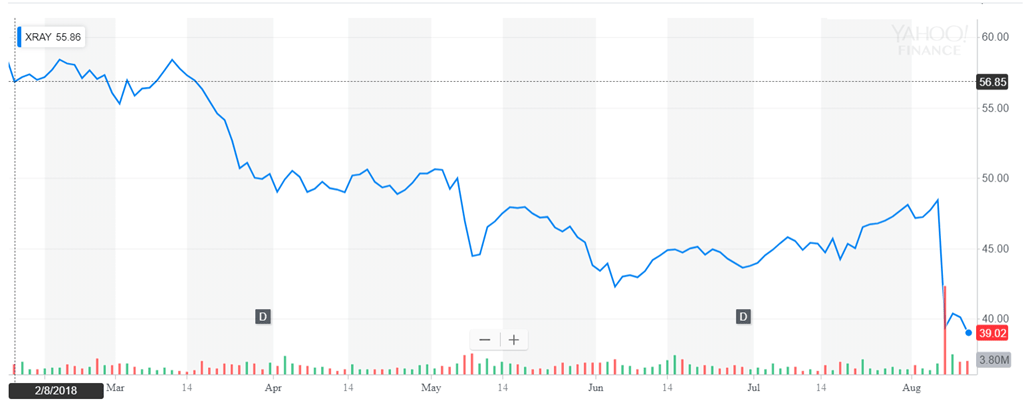
On February 6, 2017, we took a position in Dentsply Sirona (XRAY).  Dentsply Sirona is a leading manufacturer of dental products provided to dentists throughout the world.  By February 8, 2018, we said the following of XRAY:

“At the time of the purchase of XRAY on February 6, 2017, we sold our shares of UNM Group (UNM) which had increased exceptionally from the February 5, 2016 purchase.  XRAY did not meet our goal [gaining +1.14%] and while UNM has gained +5.19% in the same period of time.”

On February 8, 2018, we sold our holdings of XRAY and the stock has subsequently declined –31.30%, a staggering loss in such a short period of time.

image

Downside Targets

According to Charles H. Dow, co-founder of the Wall Street Journal, a stock should be viewed from the context of when it last performed the worst.  Dow has the following to say (emphasis ours):

"The point of importance for those who deal in industrial stocks is whether the capitalization of the companies into which they propose to buy is moderate or excessive, when compared with the aggregate earnings of the various concerns forming the combination in a period of depression. It is probable that consolidated companies will be able to earn as much in the next period of low prices as the companies forming the combine were able to earn in the last one; hence the very foundation of investments in industrials should be knowledge of what these companies earned, say in 1893 to 1896, making, perhaps, reasonable allowances for economies under consolidation. Where the earnings so shown would have provided dividends for industrials now active, the fact must be regarded as a very strong point in favor of those stocks (George W. Bishop Jr., Charles H. Dow: Economist, Dow-Jones & Company,Princeton, 1967, page 11.)"

Without seeing the reported earnings, dividends, debt and shares outstanding, the price of the stock is the best quick take on the downside risk.  In theory, the price reflects some or all of the news and fundamental data on a given stock.  Looking at the price and applying the work of Edson Gould, we have estimates for the downside target.

Continue reading

Starbucks Downside Target

Below are the downside targets for Starbucks (SBUX) based on the work of Edson Gould.

Continue reading

Review: The Buckle Inc.

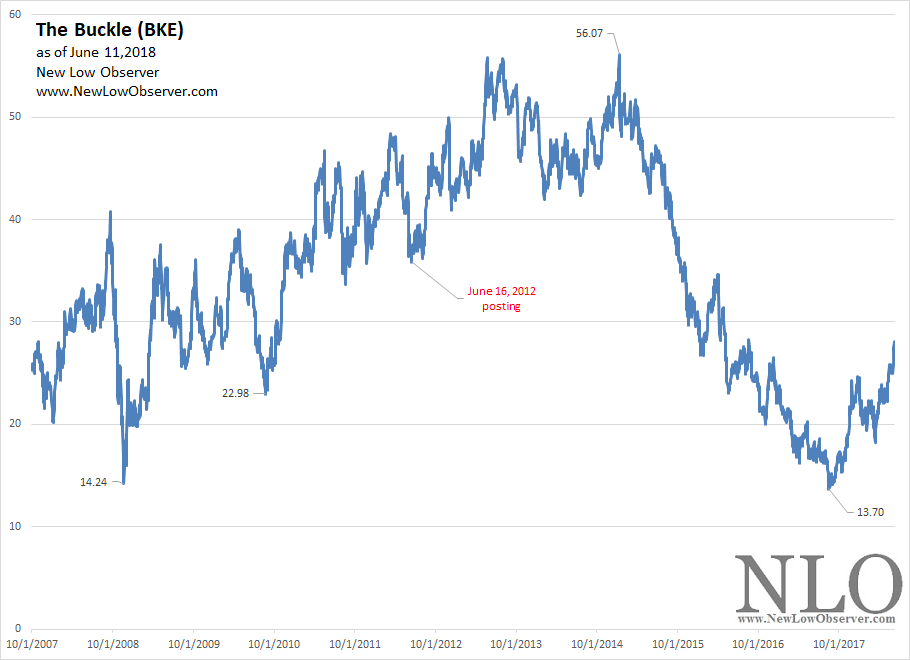
On  June 16, 2012, we posted the following commentary on The Buckle Inc. (BKE) when the stock was trading at $36.79:

“We are very interested in this stock at the right price.  We believe that BKE will be a buy at $30 and below.  However, prior price movement based on Gould’s speed resistance lines indicated that the conservative downside target is $24.47 and the extreme downside target of $16.68.”

Since that time, The Buckle (BKE) managed to increase as high as $56.07 by January 12, 2015.  However, since January 2015, BKE fell as low as $13.70 on August 2017, on a closing basis.

image

One of the fascinating elements of the work of Edson Gould is that it can be extremely accurate in spite of incomplete data.  When we ran the figures for downside targets, BKE’s peak price was $48.39.  The peak price is part of the equation that helps to generate the downside targets.  In spite of this fact, BKE managed to decline below the extreme downside target based on the speed resistance lines (SRL).

Dow 50k by 2023? How about 177k by 2032?

In a USA Today article titled “Dow hitting 50,000 by 2023? Market milestone is within reach, investor claims”, money manager Charles Lemonides says, “…investors ‘should build their portfolios recognizing Dow 50,000 is a real possibility’ by 2022 or 2023.”

image

This prediction sounds spectacular and harkens back to our January 3, 2018 article titled “Dow 130,000 by 2032.”  That article was premised on our November 2012 article suggesting that the secular bear market would end between 2016 and 2023.  After further analysis, in March 2013, we concluded that “…If the current implications are correct, we could be on the cusp of a run to Dow 100,000.”

What stands out about Lemonides’ forecast for the next five years?  While we were projecting a +12% compounded annual growth rate, Lemonides is forecasting a +15.09% compounded annual growth rate over the next five years.  If the +15.09% growth rate is projected out to 2032 then the Dow Jones Industrial Average would sit at 177,200.

Quick Take: Cardinal Health

On May 3, 2018, it was reported that Cardinal Health (CAH) declined –21% due to:

“…the company's loss of a contract with PharMerica and lower drug prices are responsible for the bearish outlook (TheStreet.com).”

The impact of these issues has resulted in lower 2019 earnings estimates for CAH.  Below are some thoughts on our expectations for CAH in the coming year.

Bitcoin Target Update

On April 2, 2018, when Bitcoin was trading at $7,049, we said the following:

“The $9,148.23 level is the point where we believe the price of Bitcoin could rise to before a retest of the $11,479.73 level, if remotely possible.  Based on the recent volume characteristics, we think that the $9,148.23 is in the works.”

As of April 27, 2018, Bitcoin is priced at $9,278.22 and has achieved our target of $9,148.23 as outlined in Dow Theory.

The April 2, 2018 assessment came after our February 17, 2018 review when Bitcoin was trading at $11,092.15 and we said the following:

“…before a new high (substantially above the $19,343) is achieved, we expected a retest of the $6,914.26 level (or something close, like, $7,000-$7,200).”

On April 6, 2018, Bitcoin declined as low as $6,620.41.  All of the assessments have been based on the work of Charles Dow’s Dow Theory and Edson Gould.

Below is the updated assessment of where Bitcoin is headed from here.

Dow Altimeter Review

The Dow Altimeter, as constructed by Edson Gould, is based on dividend payments made by the constituents of the Dow Jones Industrial Average (DJIA) as reported in the Barron’s section titled “Indexes PEs and Yields.”  The Dow Altimeter information provides a graphical representation of fundamental data.

On January 23, 2018, we said the following:

“While the market appears destine for higher ground, it is worth noting that the 24,223 level is the new support level for the DJIA.  If the DJIA fails the support level at 24,223 then the next stop is the 18,373 level.”

Below we have updated the Dow Altimeter and included the coincidence of buy indications based on the dividend history of the Dow.  We believe this history of dividend payments provides strong evidence of when a bear market has come to an end along with a fair estimate of when a recession should come to an end.

A recession and a bear market is coming.  We don’t know when, however, we can prepare ourselves with the necessary insight to better call the bottom (better than our July 2009 call for the stock market, our August 2009 call for the end to the recession and our December 2010 call for the bottom in real estate.

DJIA: Downside Targets

Based on the nature of the decline in the market on February 2, 2018, it is worth examining the downside targets for the Dow Jones Industrial Average (DJIA).  Below are the downside targets based on the work of Edson Gould’s Speed Resistance Lines.

Bitcoin: February 1, 2018

On December 22, 2017, we said the following of Bitcoin:

  • “We believe that there is going to be limited upside in the near term.”
  • “We think that the conservative downside target ($6,884.31) will be achieved before a new high is seen.”
  • “In all prior booms, the subsequent bust AVERAGED –70% (data found here).”

Below is the updated chart for Bitcoin along with our expected downside target.

GE Altimeter

Below is the historical range of the Altimeter for General Electric (GE) from 1962 to the present.  The green line represents the mean, which sits at the 143.5 level.  If GE were to achieve the historical high of the range then the stock would be priced at $22.44.  That would be a +37.84% increase to the all-time high of the longstanding range.  Meanwhile, the downside risk, based on the Altimeter, is $11.76 or a decline of –27.76%.  A declining stock price with a rising Altimeter is not a good sign.

image

Mercury General: Targets and Perspective

On August 14, 2012, when Mercury General (MCY) was trading at a price of $37.30, we said the following:

According to Morningstar.com, MCY is considered a “buy” at $31 and at fair value at $45.  Our own model suggests that MCY is significantly undervalued at $39 and a “buy” at $45. Investment Quality Trends (www.iqtrends.com) indicates that when MCY is at a yield of 4.5% or higher, the stock should be considered for purchase.  Currently, MCY has a dividend yield of approximately 6.60%.  Keep in mind that we do not buy stocks for their dividend yield.  Instead, we use the company’s consistently increasing dividend as the only proof that the company management can:

  • increase earnings over time
  • reward current shareholders

Since that time, we’ve seen Mercury General increase from $37.30 to as high as $64.52.  Along with the increase in price, we’ve been forced to revise our perspective on the stock.  Below, we will outline the revisions to our perspective and provide target prices we think MCY should be considered for acquisition.

Review: Western Digital SRL

On November 25, 2015, we posted the following SRL for Western Digital (WDC):

image

Implied in the posting is that WDC would decline, at minimum, to the $49.70 level with the potential of going all the way to the $37.45 level.  Falling below the extreme downside target ($37.45) is where we always recommended consideration of the fundamentals of a stock for a potential purchase. Below is the updated price action for WDC.

image

Much of the price action of WDC has conformed to the SRL which, from our experience, has been amazing in calling downside targets.  The current price action suggests considerable weakness in the stock if WDC cannot maintain the ascending $61.16 level.

Dow Altimeter Review

On October 25, 2017, we said of the Dow Jones Industrial Average Altimeter:

“How in the world do we believe that an already ‘overvalued’ market can possibly go as high as 34,885?  We don’t believe it at all, instead, we’re going by the precedent of the extensive history of the stock market in the United States.”

So far, the Dow has exceed the percentage increase of the 1852 low of +284% when it went above 24,844.60 level.  Now, the Altimeter is pointing to the next upside target of least resistance en route to the 34,885 level.

The Rise and Fall of GE

General Electric (GE) appears to be spiraling into oblivion.  As we’ve suggested last year, we think that GE is going to be booted from the Dow Jones Industrial Average (DJIA).  In this article, we’ll take a look at how GE got to this point and what might be in store for the stock price going forward.

1975-1981

It is possible that the beginning of the end for GE could have been marked by the acquisition of Utah International on December 16, 1976, in a deal that was dubbed “one of the largest acquisition proposals in the nation’s history.”  That transaction set in motion the machinations of a complex set of accounting deals and dealings from which GE never seemed to extract itself from.

In the bid to acquire Utah International, General Electric, “…was able to use the pooling method [of accounting] to help boost its profits…” For GE, the “…unrecorded asset value would be reported as a gain…” when the eventual sale of those assets came due.  Another benefit for GE would be that “…even if the assets were not later sold, their below market valuation allowed GE to understate its expenses (cost of sales and depreciation) and thereby overstate net income.”  The problem with these methods of accounting slight-of-hand is that GE would not be able to wean itself from these strategies.  In fact, this approach to acquisition and growth only increases as time went on.

Alarmingly, the acquisition of Utah International came after GE had exited the computer business.  As noted at the time, “the computer business proved too much for Fred Borch [GE Chairman & CEO, 1967-1972].  Reg Jones [GE Chairman & CEO 1972-1981] made his mark getting us out of it. Will someone have to bail him [Reginald Jones] out of Utah International?”  The combined Borch and Jones years are compared to the period from 2003-2018 during the tenure of Jeff Immelt in the chart below (using the approximate number of trading days going backward from January 19, 2018).

image

The entrance into the computer business followed by the entry into the mining business was simply one failure after the other.  Adding insult to injury is the fact that the period from 1967 to 1981 was a confirmed secular bear market for stocks.  However, the Utah International failure introduced the rampant and widespread use of creative accounting which would augment Jack Welch’s [GE Chairman & CEO 1981-2001] tenure during a secular bull market that began when the Dow Jones Industrial Average was trading at the 1,000 level and peaked at above 11,000.

1981-2001

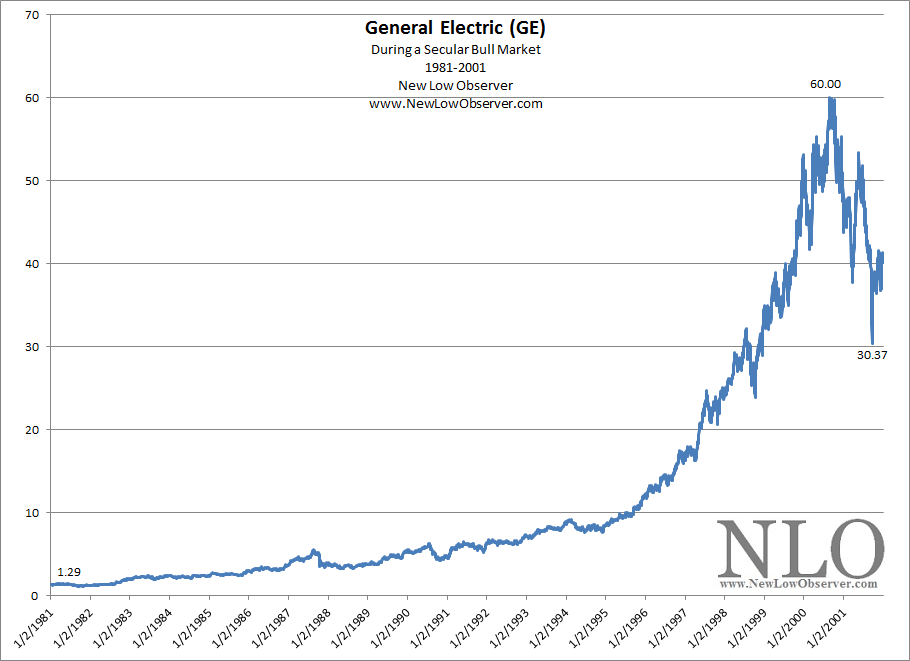
Below is the stock price of GE during the Jack Welch years from 1981 to 2001 which coincided with a secular bull market in the same period of time.

image

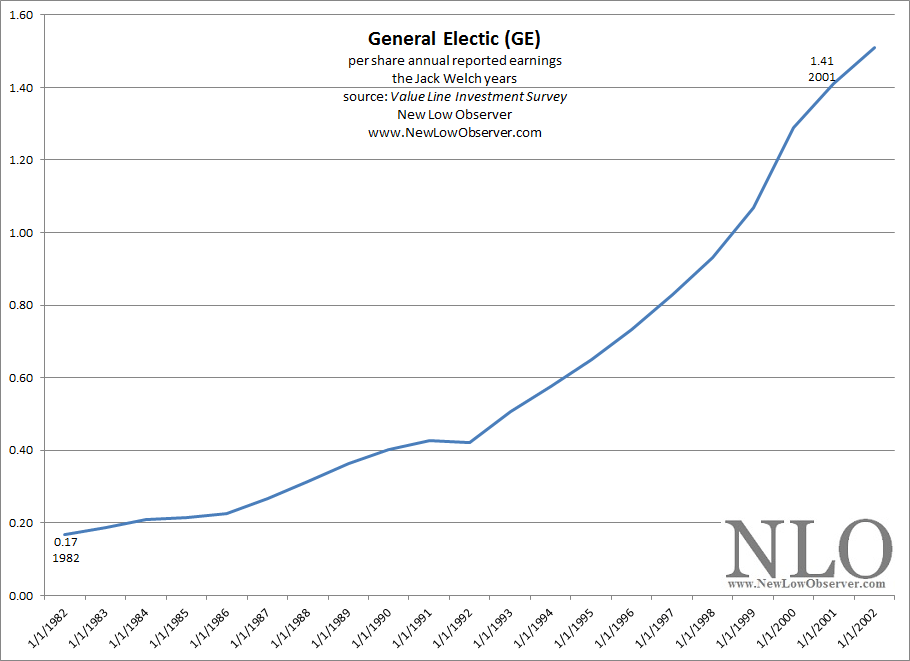
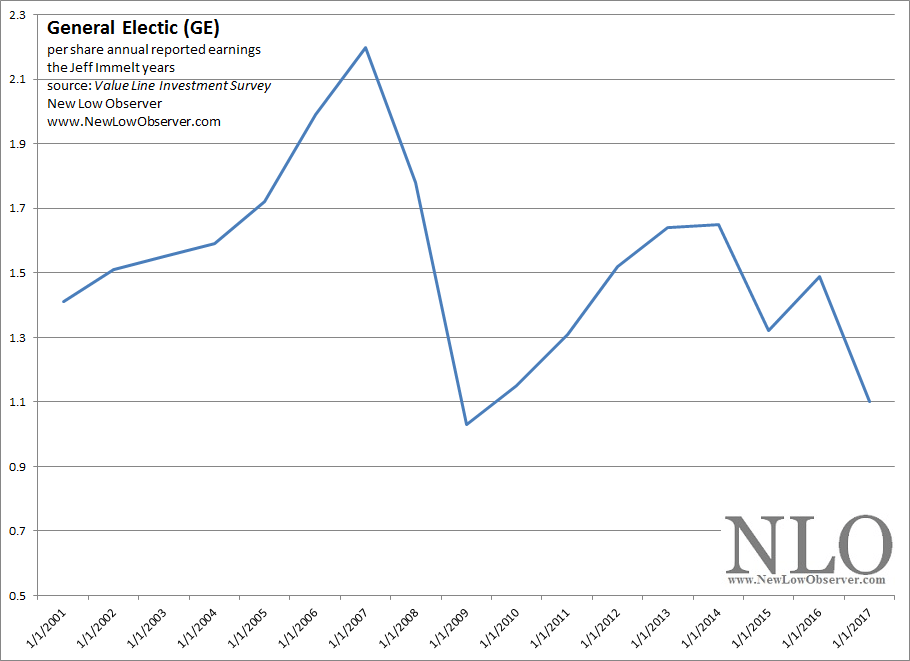
The nature of secular bull markets often see company fundamentals improve and hopefully the stock price will follow.  As shown above, the price of GE increased more than 45 times in the period from 1981 to 2000.  However, when looking at the per share reported earnings, as provided by Value Line Investment Survey from 1982, we can see that earnings “only” increased a little less than 8 times.

image

While fundamentals, stock price, and market sentiment often coincide there is no rule that the stock price has to match the fundamentals in any way, shape, or form.  However, seeing an “industrial” company’s stock price out-distance the reported earnings by such a wide margin suggests that the stock price might gravitate towards a more “realistic” mean eventually.  The perfect setup for this reversion to the mean is a secular bear market, which in our view began in 2000 to 2016 period.

It could seem that choosing the year 2000 as the beginning of secular bear market is arbitrary, at best.  However, as noted before, the well established stock market secular cycles and Warren Buffett’s November 1999 commentary of below average market performance for the 2000 to 2016 period is enough to convince us that the period in question isn’t random.

2001-2018

This leads us to the Jeff Immelt era as Chairman & CEO of General Electric from 2001 to 2017.  There could not have been a worse period to be in charge of a hobbling industrial giant that is hamstrung with well entrenched accounting methods that work against the company when the stock price isn’t in a rising trend.

Remember, when Immelt took over at GE as Chairman & CEO on September 7, 2001, the stock price was already in the beginning stages of collapse after having fallen –34% up to that point.  Even of the price of GE were to trade in range it would be bad news for the company.  A falling stock price spelled disaster for investors who were hoping and expecting a rebound to the prior highs.

image

Many GE investors attribute the decline of GE’s stock price to the management practices of Jeff Immelt.  However, much of this view is simply the mistaken attribution of correlation as causation.

If Warren Buffett thought, in late 1999, that we’d be lucky to see average market returns of +4% and GE fundamentals are calibrated to do better when the stock price rises then there is no evidence to suggest that Immelt did anything that was materially harmful (actual inflation adjusted CAGR of the S&P 500 return was +2.27%).  Instead, what we’ve witnessed in GE stock price has been a reversion to the mean from the prior period of excess.

Price & Time Targets

Based on Edson Gould’s “Three Step” rule, GE has one more leg down.  In theory, this should bring the GE stock price below the 2009 low.  However, there is a lot of ground to cover for GE to get to the 2009 low and there is no guarantee that it will happen.  With this in mind, we’ll outline the previous two declines, 2000-2002 & 2007-2009, to establish any possible precedent that might emerge.

  • 2000-2002
    • The decline from the 2000 peak did not see any respite until 2002.  That decline saw General Electric fall –63%.  The period of decline lasted 530 trading days.
  • 2007-2009
    • The decline from the 2007 peak ended in early 2009 and was approximately –84%.  The period of decline lasted 359 trading days.
  • 2016-present
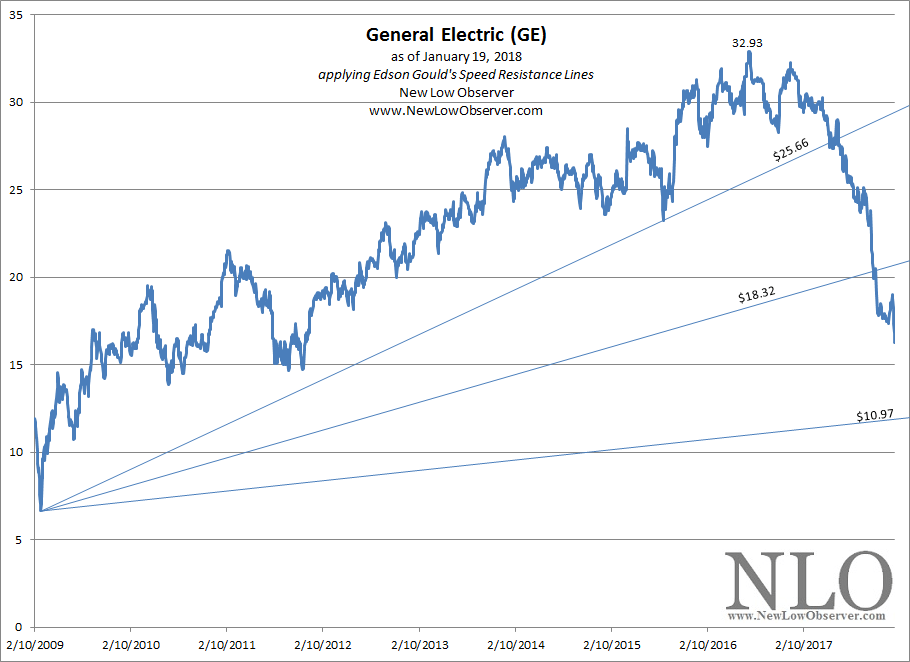
    • So far, the price of General Electric (GE) has declined approximately –50.62% and has lasted 381 trading days.  As seen in the chart below, GE has blasted through Gould’s Speed Resistance Lines at $25.66 and $18.32.

image

From what we can tell, the price target at the ascending $10.97 level is a lock (approximately $12.18).  This would match the decline that was experienced by GE in the period from 2000-2002.  The question becomes, will GE match the decline of 2007-2009, on a percentage basis.  If so, then GE would decline to as low as $5.27.  This would fit exactly with the nature and pattern of declines expressed by Gould in his “Three Step” rule.

Time targets seem to indicated that General Electric will reach the $10.97 or $5.27 low on April 20, 2018.  The speed at which the current decline is taking place indicates that sentiment will push the stock to the $5.27 price and the elimination from the Dow Jones Industrial Average is eminent.  We see the possible replacements for General Electric in the Dow Jones Industrial Average (DJIA) to be Adobe (ADBE), Expedia (EXPE), Google (GOOG) or Amazon (AMZN).  In the case of Google and Amazon, their inclusion into the DJIA is predicated on a 10:1 stock split.

sources:

  • Stuart, Reginald. $1.9 Billion G.E. Bid in Mining Merger. New York Times. December 16, 1975. page 1.
  • Smith, Gene. Acquisition Set Today of Utah International. New York Times. December 20, 1976. page 67.
  • Schilit, Howard. Financial Shenanigans,2nd edition. McGraw Hill. 2002. page 103.
  • Value Line Investment Survey. General Electric. 1982-2018.

Duke Energy: Downside and Time Targets

We’re very fascinated by the recent price activity of Duke Energy (DUK) and have decided to outline our thoughts on the downside targets that may exist for the stock.  Below we have applied Dow Theory and Gould’s Speed Resistance Lines for what we believe to be conservative estimates that may help investors avoid buying high, allow for buying low, or reduce loses.

Dow Theory says that investors should always refer back to the last time a given stock had performed the worst, on a fundamental basis, as the benchmark for estimating the prospects for going forward. 

"The point of importance for those who deal in industrial stocks is whether the capitalization of the companies into which they propose to buy is moderate or excessive, when compared with the aggregate earnings of the various concerns forming the combination in a period of depression. It is probable that consolidated companies will be able to earn as much in the next period of low prices as the companies forming the combine were able to earn in the last one; hence the very foundation of investments in industrials should be knowledge of what these companies earned, say in 1893 to 1896, making, perhaps, reasonable allowances for economies under consolidation. Where the earnings so shown would have provided dividends for industrials now active, the fact must be regarded as a very strong point in favor of those stocks (George W. Bishop Jr., Charles H. Dow: Economist, Dow-Jones & Company,Princeton, 1967, page 11.)"

If price action is a forward reflection of company fundamentals and investor sentiment, then the period from the 2003 low is the best starting point for our review.  The decline in DUK from the 2001 peak to the 2003 low was the worst decline in magnitude when the stock fell more than -70%.  We’re not suggesting that DUK will fall by that much this time, instead, we’re watching for the intermediate stages that lead up to a possible –70% decline.

Continue reading