Category Archives: Edson Gould

Bitcoin: January 2018

On December 22, 2017, we said the following of Bitcoin:

  • “We believe that there is going to be limited upside in the near term.”
  • “We think that the conservative downside target ($6,884.31) will be achieved before a new high is seen.”
  • “In all prior booms, the subsequent bust AVERAGED –70% (data found here).”

Below is an updated review of Bitcoin and our thoughts for the price going forward.

Aflac Inc.: Downside Price and Timing Targets

On January 11, 2018, in an article titled “Behind the Duck: Former Aflac Employees Allege Fraud and Abuse in Nearly Every Aspect of Company” published by The Intercept, it is alleged that Aflac (AFL) “…has exploited workers, manipulated its accounting, and deceived shareholders and customers, according to nine former employees.”

image

These allegations have had a material impact on the stock price of Aflac on January 12, 2018.  Currently, the stock is down –7% on the day.  Below are the downside price and timing targets of AFL based on the Speed Resistance Lines since the 2009 low.

Stock Market and Inflation Risk

A reader of our Dow 130k article has raised an important question about the risks that the stock market faces when confronted with the prospect of rising interest rates.  The reader says, in part:

“…they say that interest rates are mean reverting and based on where we are today (historically low) I would think that the betting man would bet that it can only go up from here.  If that is the case, I can't see a bull market in the coming years.

“What if the scenario is that we have permanent low inflation (Secular stagnation). Productivity improvements through outsourcing and technology innovation may explain this paradigm shift.”

We don’t have much to go by other than the historical record.  In this case, the historical record says the following:

  • Interest rates will go up
  • Inflation is broadly bullish for the stock market
  • the period of “low inflation” is behind us

In this article, we will examine, from a historical perspective, whether this is a new era where all of our claims are false or history will repeat.

Continue reading

Dow 130,000 by 2032

Summary

  • In 1999, Warren Buffett said that stock market returns would underperform over the next 17 years.
  • Cycles indicate that the next 17 years will be a secular bull market.
  • Volume data and price recovery were the keys to the change in the trend.
  • Magnitude of secular trends in the past point to 10-fold gains in DJIA.
  • The work of Edson Gould in 1935, 1979 and today.
  • Look for average real compounded annual returns of +12% v. the historical +7% real returns.

Synopsys Downside Targets

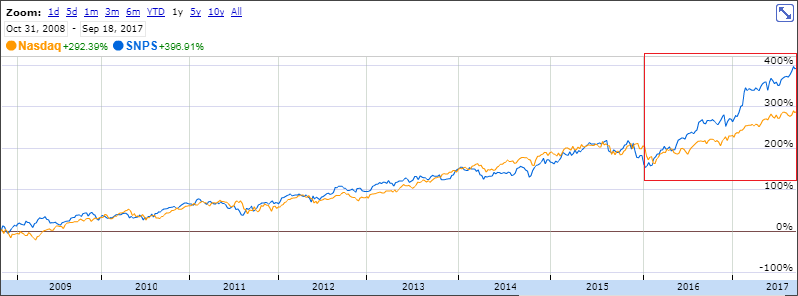
Since the beginning of the bull market in 2009, Synopsys Inc. (SNPS) is a stock that has perform in line with the Nasdaq Composite Index until early 2016.  Since February 2016, SNPS has accelerated well outside of the historical trend for the stock.  While there are many fundamental reasons for excessive gains in the last two years, the gains are still excessive and therefore should, at minimum, revert to the mean. 

image

The challenge with reversion to the mean is that the stock price will likely overshoot on the downside.  With this in mind we have provided the Speed Resistance Lines indicating the conservative, mid range, and extreme price targets below.

Equifax: Downside Targets

Equifax is on a tear, to the downside.  Let’s see what happened to the stock in the last decline from an all-time high and see if there is any precedence for what we can expect going forward.

2002-2009

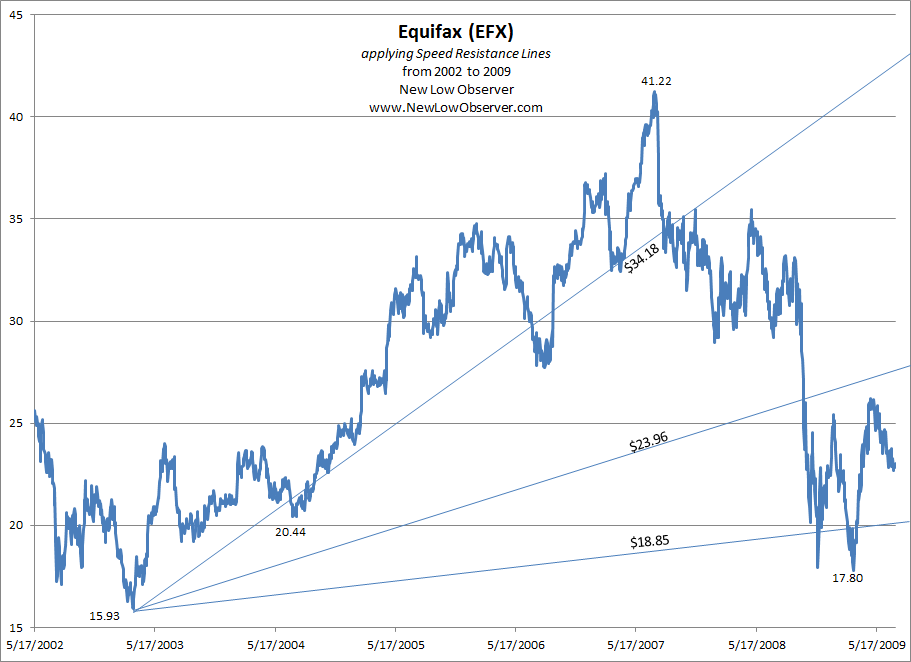
In the period from 2002 to 2009, the price of Equifax (EFX) increased +158% to a high of $41.22.  the decline that followed brought the stock to $17.80.

image

Equifax fell to the conservative downside target ($34.18) and the mid range downside target ($23.96).  At the time, Equifax had an extreme downside target of ($13.74) but somehow didn’t manage to decline to that level, in spite of the fact that the housing crisis was co-opted by credit bureaus changing their standards which materially affected FICO scores.

“…the higher the credit score, the larger the increase in serious delinquency rates between 2005, 2006 and 2007. For example, for borrowers with the lowest credit scores (FICO scores between 500 and 600), the serious delinquency rate in 2007 was twice as large as in 2005—an increase of nearly 100 percent over the two years. For borrowers with the highest credit scores (FICO scores above 700), the serious delinquency rate in 2007 was almost four times as large as in 2005—an increase of nearly 300 percent. In addition, the serious delinquency rate in 2007 for the best-FICO group was almost the same as the rate in 2005 for the worst-FICO group.(Demyanyk, Yuliya. ‘Did Credit Scores Predict the Subprime Crisis?’ . Federal Reserve Bank of St. Louis. October 2008. link.).”

Bending of rules towards what was considered a prime rated credit score contributed significantly to lenders justifying the approval of home loans which later failed.  With all this in mind, Equifax and their competitors should have fallen much more than they did.  In fact, under normal conditions, at least one of the leading credit bureaus should have gone out of business.

Now, Equifax has declined based on a recent hack of their data systems.  The resultant decline in the stock price seems natural.  However, given the resilience  of the stock price after the housing crisis, we have to default to the view that the company won’t go out of business but will be severely impacted in the short-term.

Continue reading

Activision Blizzard: Downside Targets

Review

The following is the pattern of price appreciation and decline for Activision Blizzard (ATVI) from 1993 to 2017 with the application of Speed Resistance Lines [SRL].

1993 to 1996

image

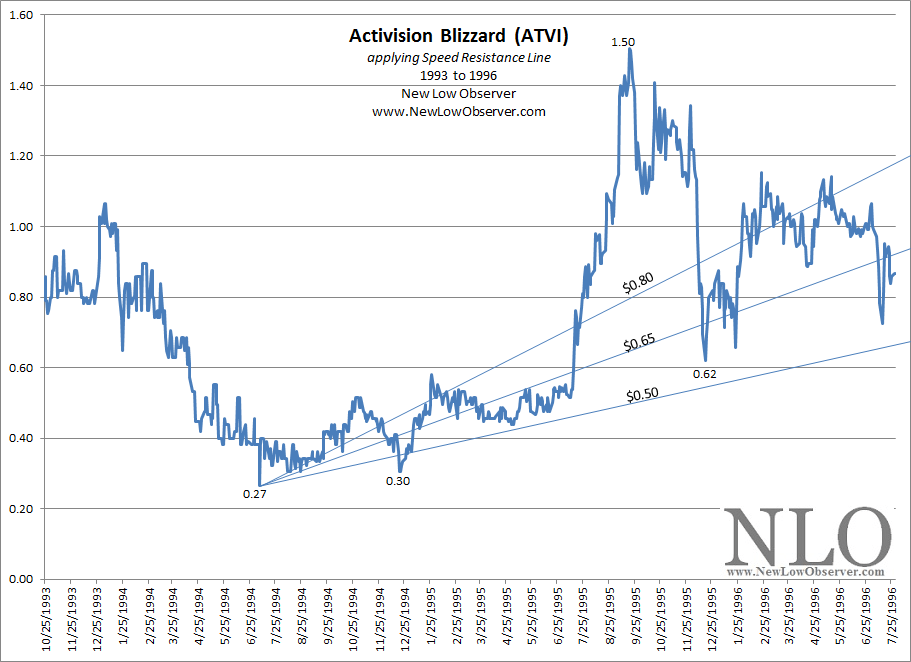
In the period from 1993 to 1996, we can see that Activision Blizzard (ATVI) increase from $0.27 to as high as $1.50 or a gain of +455%.  The decline that followed saw ATVI fall –58%, achieving the conservative downside target of $0.80 and the mid range downside target of $0.65.  Although the chart doesn’t show it, ATVI did not rises above the 1995 level and subsequently fell as low as $0.43 by 2000 and ultimately achieving the extreme downside target of $0.50 in the process.

1999 to 2003

image

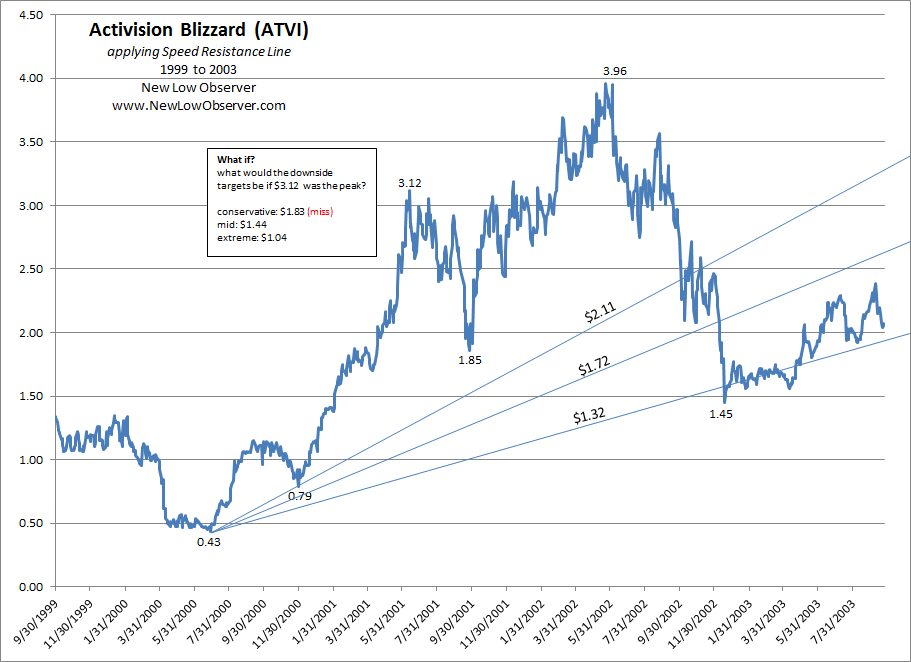
In the period from 1999 to 2003, ATVI rose from $0.43 to as high as $3.96, a gain of +821%.  The resulting decline saw ATVI drop –63%.  In the chart above we do note a possible scenario that the SRL is run on the stock at the $3.12 peak, assuming you don’t know where the ultimate peak would be.  In such an instance, a conservative downside target of $1.83 and a mid range target of $1.44 were calculated. 

In the big scheme of things, the conservative downside target was achieved and the mid range target was one penny short of the mark in 2002. The point of this exercise is to see, what would have been the outcome if there was an error in the timing of the calculation of the downside targets.  As we shall see, these situations are all too real with outcomes that are generally surprising. However, in the immediate decline after the $3.12 price peak, the conservative downside target of $1.83 was $0.02 cents short of the $1.85 low set in September 2001.

2002 to 2009

image

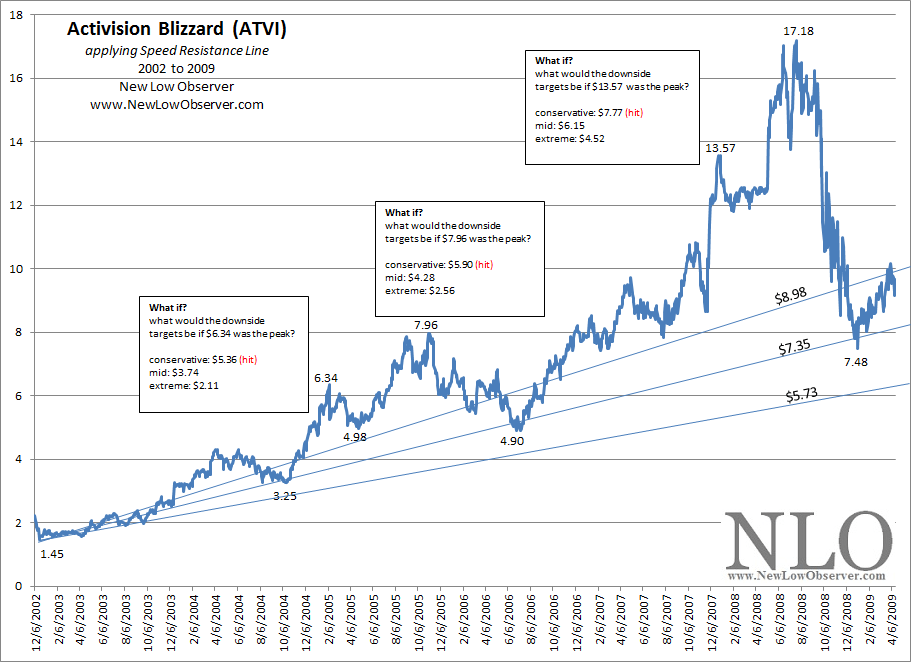
In the period from 2002 to 2009, ATVI increased in price by +1,084%.  The decline that followed brought the stock down as much as –56% before a recovery ensued.  Again, we have marked off the points where an error of early use of the SRL could have been applied.  In each of the three examples, the conservative downside target was achieved.  Suffice to say, in the case of the SRL and price peaks, the conservative downside target is a reasonable point of reference for consideration of ATVI.

2012 to 2017

The price action of ATVI has seen the stock price increase from a 2012 low of $10.08 to the 2017 high of $66.16.  The gain in the stock price has been +556%.  Our SRL has the following downside targets:

Adobe Systems: Downside Targets

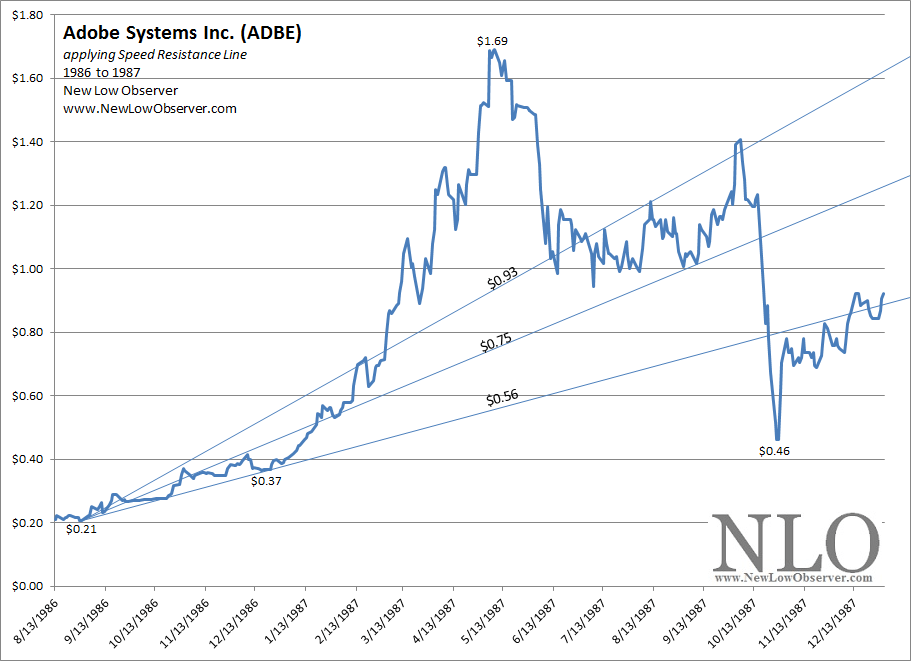
In determining downside targets for Adobe Systems Inc. (ADBE), we have applied Speed Resistance Lines [SRL] to the stock price over multiple periods of increase and subsequent decline. Starting in the 1986 to 1987 period, we see Adobe Systems Inc. increase from $0.21 to as high as $1.69.  In the decline that followed, the SRL indicated that the downside targets from the peak price of $1.69 were as follows:

  • $0.93
  • $0.75
  • $0.56

As seen in the chart below, ADBE declined as low as $0.46 from the $1.69 high.

image

Much of the decline could have been attributed to a new company and speculative fervor for the stock taking it up +700%.  However, the inevitable decline was due and took investors down –72% before a recovery was seen in the stock price.  The stock achieved the conservative ($0.93), mid range ($0.75), and extreme ($0.56) downside targets.

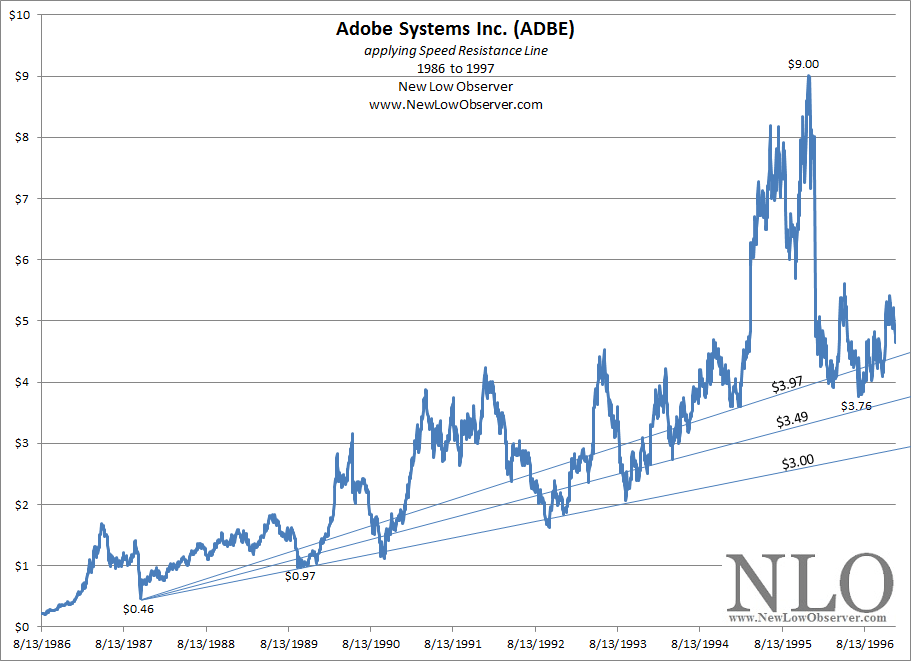
In the period from 1987 to 1997, we see ADBE stock price increase from the $0.46 low to a high of $9.00, a whopping increase of +1,856%.  In the subsequent decline, ADBE fell “only” –58% from 1995 to 1996.  Adobe achieved only the conservative downside target ($3.97).

image

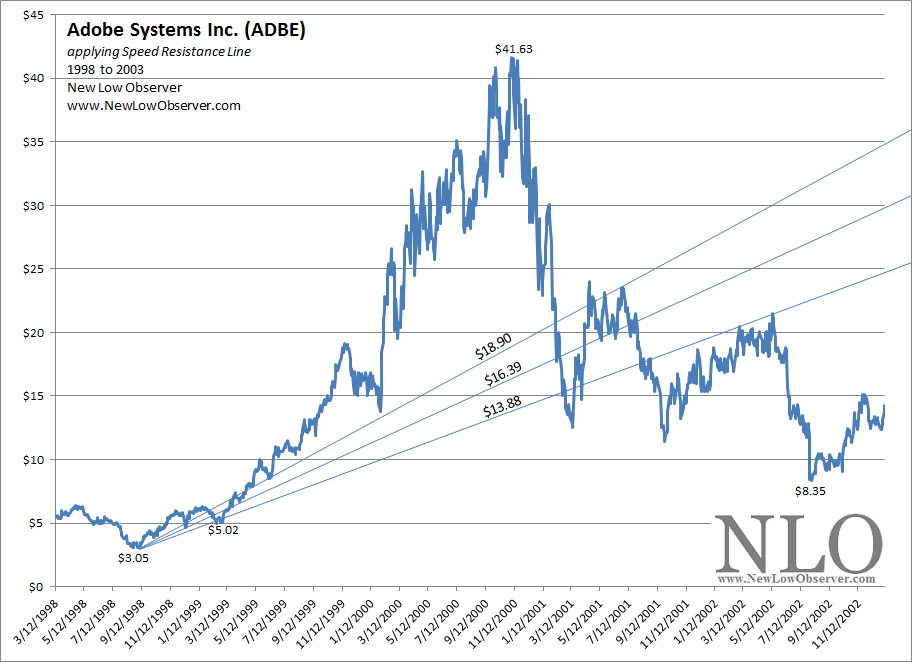
In the period from 1998 to 2002, Adobe rose as much as +1,264%.  In the decline that followed, ADBE notched a –79% drop. In this instance, ADBE achieved all of the downside targets of $18.90 (conservative), $16.39 (mid range), and $13.88 (extreme).

image

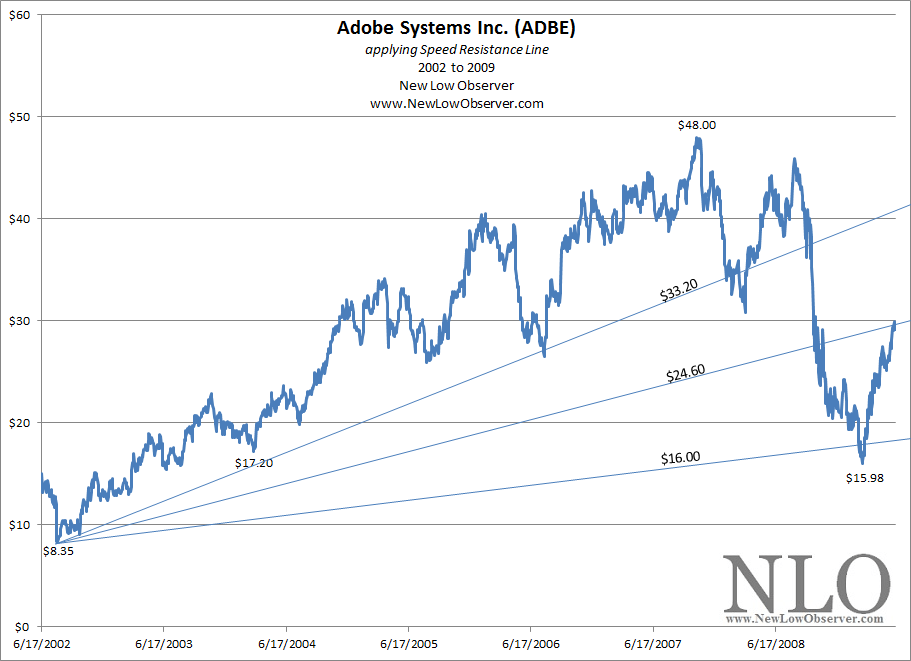
The next period that we track is from 2002 to 2008.  In that period, ADBE rose as much as +474%.  The decline that followed saw Adobe slide –66%.  Again, all downside targets achieved at $33.20 (conservative), $24.60 (mid range), and $16.00 (extreme).

image

Worth noting is the fact that in all cases, Adobe Systems (ADBE) declined at least to the conservative downside target. Additionally, in 3 of the four cited examples, ADBE managed to fall to the extreme downside target as established by the Speed Resistance Lines.

Is the past a fair indication of what to expect in the future?  What do we believe the future to hold?

Our take on the future prospects for ADBE stock price are that we can reasonably expect the price to decline to the conservative downside target in accordance with past declines.  However, expecting that ADBE will achieve the extreme downside target is overly ambitious at present.   After all, ADBE is a mature, well-established company that dominates several categories in their respective product lines (by a wide margin as compared to the next closest competitor).

With this in mind, after an increase in price of +881%, from the 2009 low, we have outlined the Speed Resistance Lines from 2009 to 2017.


Swiss National Bank: Downside Targets

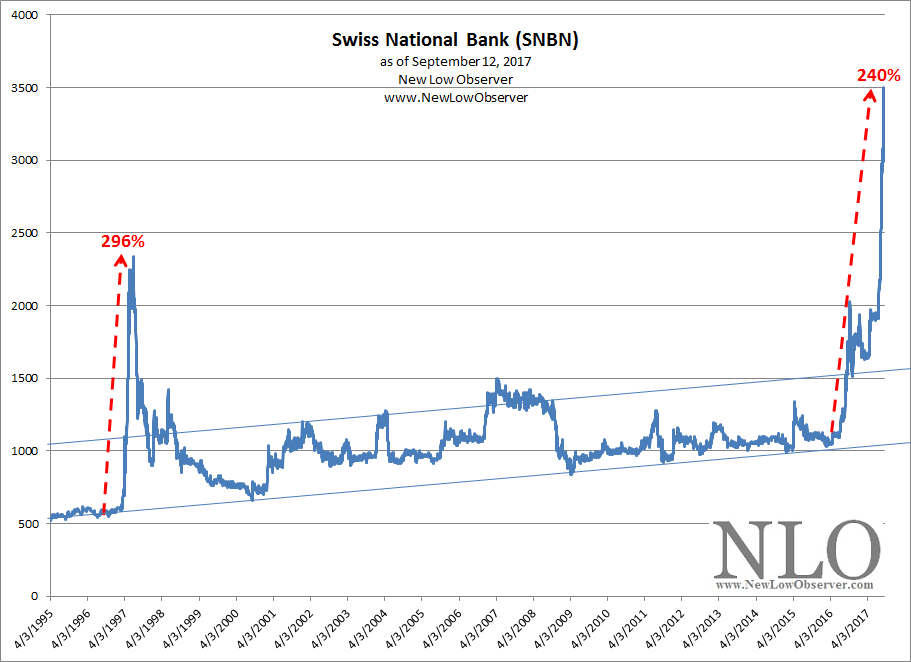
In a posting on ZeroHedge there is mention of Swiss National Bank (SNBN) and the “bubble” that seems to be percolating in the stock.  We don’t know whether or not the price of the stock is in a bubble.  However, what does resonate with us is any sign of a parabolic rise in price.  In the case of SNBN, we believe that we can attribute Speed Resistance Lines (SRL) that are consistent with viable downside targets.

First, whenever applying SRLs, we like to find out if there has been any precedence on the matter. In the case of SNBN, we have obtained data from Yahoo!Quotes (ChartIQ), which goes back to 1995.  It is just our luck that there is a prior period when SNBN has a similar rise and subsequent decline.

image


Considering that there is a reasonable amount of precedent in the stock price movement of SNBN in the period from 1995 to 1997, we have taken the liberty in projecting what the current level of price increase could result in, if history is any guide. 

Continue reading

Gilead Sciences, On Target

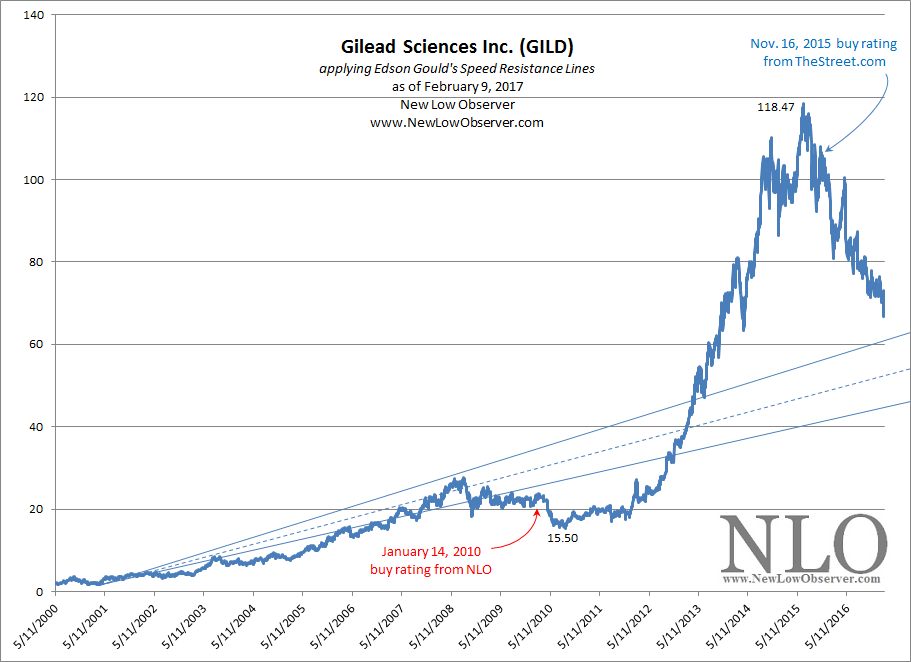
On November 16, 2015, when Gilead Sciences (GILD) was trading at $99 per share, we posted the following long-term downside targets for  the stock:

  • $56.93
  • $49.03
  • $41.12

At the same time, we contrasted our downside targets with commentary from TheStreet.com to ensure that there was some balance to the perspective for our readers.  TheStreet.com said the following of GILD:

“We rate GILEAD SCIENCES INC (GILD) a BUY. This is based on the convergence of positive investment measures, which should help this stock outperform the majority of stocks that we rate. The company's strengths can be seen in multiple areas, such as its robust revenue growth, notable return on equity, attractive valuation levels, expanding profit margins and good cash flow from operations. We feel its strengths outweigh the fact that the company has had generally high debt management risk by most measures that we evaluated. (TheStreet.com. Gilead Sciences (GILD) Stock Is the ‘Chart of the Day’. Albright, Amanada. November 16, 2015. ”

image

It is worth noting the buy rating that we gave to GILD on January 14, 2010.  At the time, the fundamentals seemed to be supported by the technicals and warranted due diligence and possible acquisition.  Below is our revised assessment of Gilead based on the technical attributes which is precipitated by investor reaction to the company fundamentals.

Continue reading

Review of 2015 Assessment of LL & SAM

On February 25, 2015, we posted Edson Gould’s Speed Resistance Lines [SRL] for Lumber Liquidator (LL) and Boston Beer Company (SAM).  Starting with LL, we said the following:

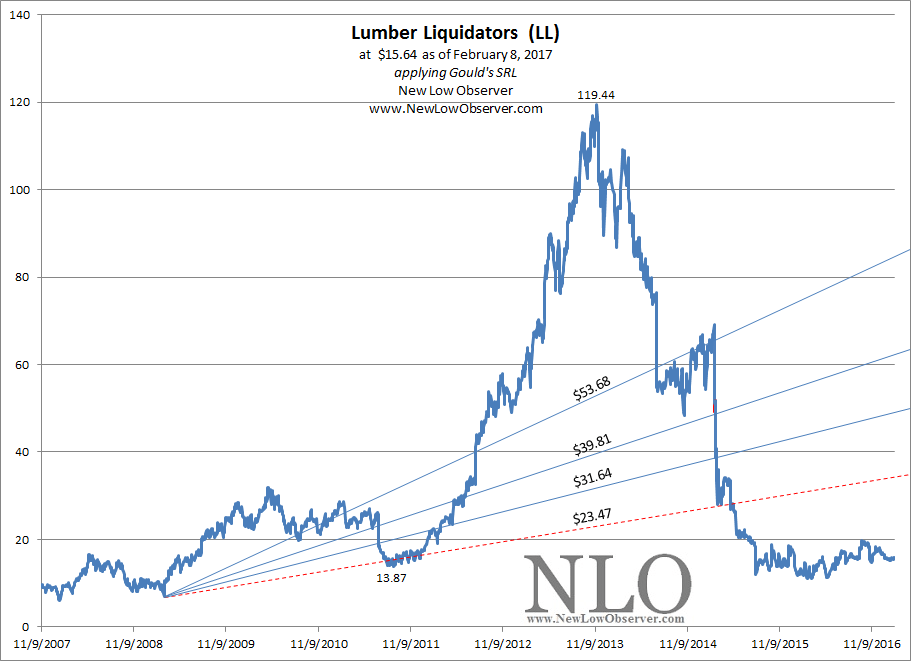
“Those interested in LL and willing to perform appropriate due diligence could engage in a three phase purchase plan beginning below $39.81, $31.64 and $23.47.  Investors, as opposed to speculators, should be willing to accept that there is no compensation for the wait when holding LL and that the decline to the ascending $23.47 level is a real risk.”

Since February 2015, LL has declined to the current level of $15.64.  While we might know the exact reasons why LL fell to the current level, we don’t know what to make of the dramatic decline other than the fact that the SRL gave every indication that this was possible.  Below is the updated SRL on Lumber Liquidator.

image

Upon further reflection, we examined the price of Lumber Liquidator and attempted to propose an alternative view on the stock price decline.  On March 3, 2015, we proposed the following thesis:

“The coincidence of Lumber Liquidator (LL) declining significantly at the same time as the futures price of lumber (as traded on the Chicago Mercantile Exchange) seems difficult to ignore.  Investors should take note of the fact that in three prior periods indicated in blue, LL has lost a minimum of –35% and as much as –53% when the price of lumber declined –33% or more. 

“So far, from December 2013 to March 2015, the price of lumber has declined –23% while LL has declined as much as –67.49%.  Much of the decline in LL has been exacerbated by concerns related to quality and sourcing of the flooring.  However,  the current decline is only slightly out of alignment from what has happened in the past.”

Continue reading

Technically Speaking: Teva Pharmaceutical

On April 5, 2011, we said the following of the downside targets for Teva Pharmaceutical (TEVA):

“Charles H. Dow indicated that the fair value of a stock is the average price that is paid by investors. The fair value is the point at which an investor, as opposed to speculators, will consider buying or selling a stock. The fair value that we’ve arrived is based on the low of July 2006. If Teva were to decline below $47.06, the prospects for $29.77 become almost inevitable.”

Since that article, as TEVA declined below the $47.06 level, the stock eventually declined to the the ascending $29.77 level by November 2013 as seen in the chart below.  After hitting the ascending $29.77 level, the price jumped to just north of $72.

image

We’ll have to accept that this is all mere coincidence and slight of hand rather than any kind of basis in facts.  However, our claim has always been, if the target is achieved then review & decide whether to invest or if it is never achieved then move on to other opportunities.

Let’s review the prospects for TEVA under the current price structure which includes the periods since the November 2013 low to the present.  But first, you need to see the July 12, 2013 Speed Resistance Lines that we posted for TEVA as it is instructive and in alignment with the Dow Theory targets.

The long-term downside targets for TEVA based on the SRL indicated that the $32.50 level was the time to consider acquisition of the stock.  At that time we said the following:

“We could not determine a conservative downside target.  Because of this, we had to run some calculations and came up with the trendline of $43.33 and $32.50 as tentative support levels.”

Since TEVA provided the best indications using Dow Theory and came close using Edson Gould’s Speed Resistance Lines, we’re going to give the Dow Theory perspective in the long and short run and see where it takes us.

image

The above chart indicates that at the current price Teva Pharmaceutical is considered below fair value ($38.23) as long as the fundamental data confirms what the price suggests.  Additionally, TEVA seems poised to achieve the downside target of the ascending $26.86 level (approx. $28.50).  Purchases of this stock are best made in stages with 50% of allotted funds at the current price and 25%+25% at predefined lower levels.

Clean Harbors: Coincidence Confirmed, Again

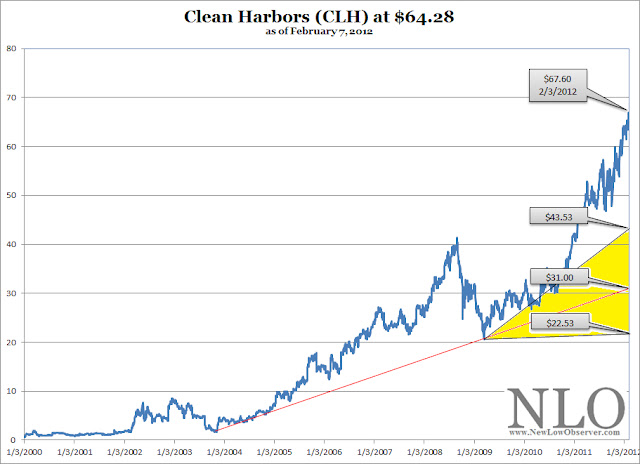
On February 9, 2012, we posted Edson Gould’s Speed Resistance Lines [SRL] regarding Clean Harbors (CLH).  Our hope at the time was that our prior work on the top of Gould’s work would be handily refuted or confirmed.  At the time we posed the following SRL:

For us, our expectation was that the Clean Harbors would, at minimum, descend to the conservative downside target of $43.53.  Well, the timing and coincidence were in our favor as CLH fell –40% to the appointed levels that we thought the stock should descend.

As with all Speed Resistance Lines, there is a chance that the stock will continue to move higher.  However, at each point higher we readjust the SRL and arrive at new downside target.  In the case of CLH, the stock increased from the $67.60 price to as high as $70.30 thereby requiring an adjustment of the downside targets higher as well.  Remember, if the stock does not hit downside targets avoid it.  When and if the stock falls to the target, review for potential investment.

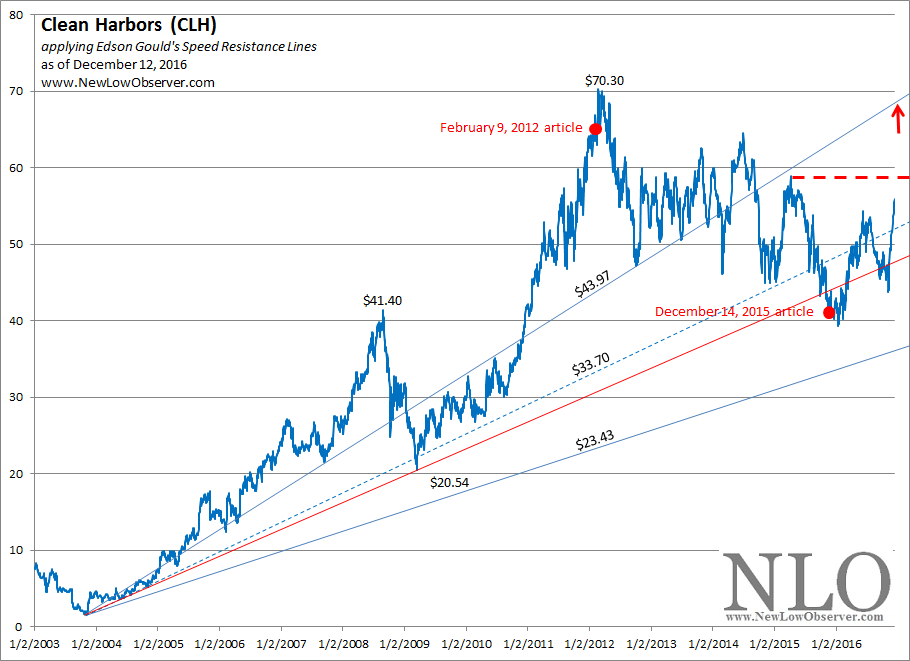
Finally, for no explicable reason, when all seemed in favor of the stock, CLH declined from the $70.30 peak to the low of $37.09 achieved in January 2016.  By achieving such an improbable low (improbable to those who were buying CLH in February 2012) CLH stock price appeared to be worth considering.  For this reason, we iterated a review of CLH for investment consideration on December 14, 2015. Since our mid-December 2015 review, CLH has increased by +39%.

image

At this point, we’d consider our general analysis of CLH a success from the December 2015 posting.  What do we see going forward?  We see two critical upside resistance levels to watch for.  The first upside resistance is at $59.00 and the second upside resistance level is at $69.00.  Obtaining a +39% gaining in a 1-year period might suggest that an investor consider selling all of their CLH holdings and reinvesting the funds somewhere else.

The Cold Hard Truth

Granted, luck and timing have a lot to say in any and all the work that we produce, however, that does not mean that our efforts on the topic should be dismissed as there may be some value in what we’re trying to accomplish.  Since the very first of our SRLs we’ve had more than 80% of the SRL downside targets achieved at the point of the initial examination.  This generally could could be considered a success.  However, of the 20% that have not been successful are positions that we’ve taken a real world investment in, which totally sucks.

In spite of the prevailing reality we continue to attempt to mitigate the available information with the stocks of interest to us.  We’ll narrow down this situation to a point where the SRL will work and/or we’ll still be able to benefit regardless of whether an immediate rebound is experienced.

Nasdaq Biotechnology ETF

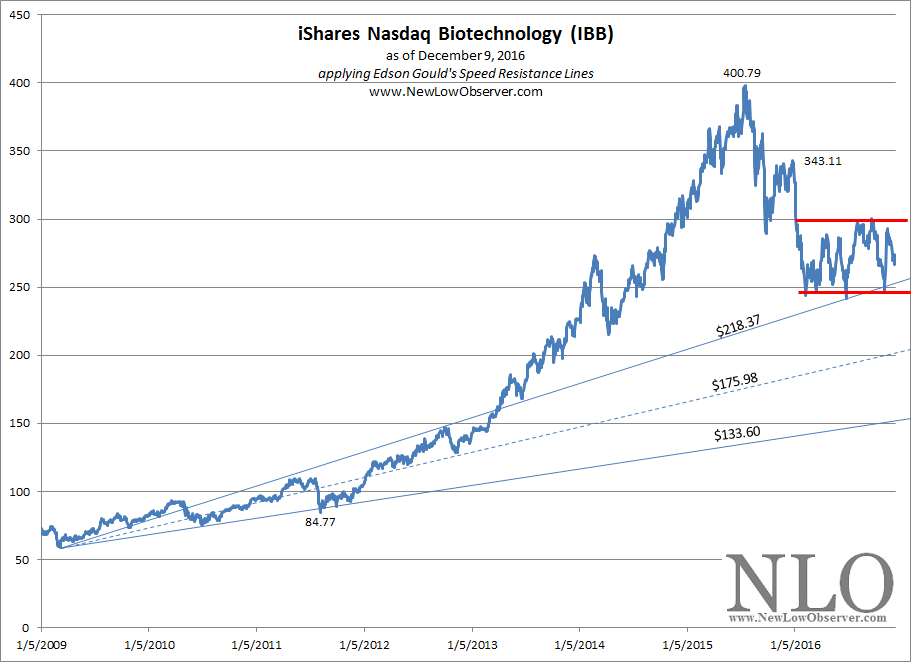
The iShares Nasdaq Biotechnology ETF (IBB) is trading in range that ultimately needs to be resolved.  The outcome is either falling dramatically below $240 or striking the $343 level before doing a retest of the prior high around $400.

image

Already, IBB has managed to resist falling below the ascending $218.37 level.  This is in defiance of our belief that a highly volatile sector and fund should retest the extreme downside target of $133.60.  Those wanting to have exposure to the biotech sector but unwilling to take on the individual risk should consider the prospects of this ETF.

Nvidia Downside Targets

Below are the downside targets based on the work of Edson Gould and the precedent setting periods from 1999 to the present.