Category Archives: Edson Gould

Dow Jones Transportation Average: On Target

Review

On December 23, 2018 when the Dow Jones Transportation Average (DJTA) was at 8,874.79, based on the work of Edson Gould, we said the following in our closing paragraph:

“We have a range from as low as 6,465.65 to as high as 19,992.65 in period from 2019 to 2023. The Dow Jones Transportation Average is currently undervalued.  It is best to expect that it will decline to the extreme level of 6,465.65.”

Since late 2018, the DJTA has had the following price activity:

image

On March 18, 2020, the DJTA declined as low as 6,481.20, falling short of our 2018 estimated low by 0.24%.

Because the DJTA is slightly above our fair value estimate for 2021 (made in 2018), we expect that even if the Index does not achieve the overvalued level in the current year, the historical precedent is for it to be able to achieve the upper range (overvalued level) that we’ve set for it between now and 2023.

Lumber Downside Targets

Below are the downside targets based on the work of Edson Gould.

image

The targets, as noted in the chart above are:

  • $821.80 (conservative target)
  • $691.90 (mid-range target)
  • $562.00 (extreme target)

The $821.80 target is generally assured, from all parabolic increases of this nature.  There exists the potential to decline as low as $410.90.  However, we reserve this target as a backup to achieving the $562.00 price.

Dogecoin: It’s Not Legit If It Doesn’t Crash -93%

Review

On February 5, 2018, we outlined the similarity in the level of increases between Bitcoin and Ethereum.  At that time, we said the following:

“The periods in question happens to have the same percentage change, approximately +13,400%.”

We then surmised that if Ethereum could increase the same as Bitcoin then it wouldn’t be far fetched to consider the prospect of Ethereum declining to the same level of -93%, after such an increase.  We said the following:

“As with the same percentage increase, it is reasonable to expect the same percentage decreased that followed.  For the price of Bitcoin, it plunged –93.07% from June 8, 2011 to November 18, 2011.”

By January 10, 2019, we published an article titled “Ethereum: Stunning -93% Decline”.  In that piece, we said:

“The difference between the high of $1,385.02 and $84.06 is equal to –93.93%.  This decline was similar to the decline experienced by Bitcoin in 2011.”

DogeCoin Downside Targets

Below are the downside targets based on the work of Edson Gould.

image

The targets, based on the $0.41 peak, are:

  • $0.19 (conservative target)
  • $0.16 (mid-range target)
  • $0.14 (extreme target)

The -93% downside target for DogeCoin from the $0.41 level is $0.03. We have intentionally excluded the potential upside target of $1.41.  Our emphasis is exclusively the downside risk.

Bank of Montreal 10-Year Targets

Below are the valuation targets for Bank of Montreal (BMO.TO) for the next 10 years. Continue reading

Clorox Co. 10-Year Targets

Below are the valuation targets for Clorox Company (CLX) for the next 10 years. Continue reading

General Electric Upside Targets

Review:

  • On January 21 2018, when General Electric (GE) was trading around $16, we said, “the speed at which the current decline is taking place indicates that sentiment will push the stock to the $5.27 price and the elimination from the Dow Jones Industrial Average is eminent.”
  • On May 15, 2020, General Electric (GE) achieved a closing low of $5.49, 4.17% above our estimated downside target.
  • On January 1, 2019, when General Electric was trading around $7.25, we said, “…now is the time to consider the upside resistance targets.  The above chart lays bare the expectations for an upside move.” We also said, “The year 2019 could be forgiving to GE…” This was 12.40% above the December 12, 2018 low.
  • As of March 10, 2021 (intraday) General Electric is +82.75% above our January 1, 2019 indication to look to the upside.

Upside targets:

Below are the upside targets for General Electric.  The price targets indicate a range at which the price is expected to experience resistance before continuing the rising trend or before breaking down to the prior downside target.

image

Those willing to accepted the risk of the price declining to the prior low ($5.49) could strategically accumulate shares based on this approach.

ARK Innovation ETF Downside Targets

Below are the downside targets based on the work of Edson Gould.

image

The targets, based on the $156.58 peak, are:

  • $90.73 (conservative target)
  • $71.98 (mid-range target)
  • $53.23 (extreme target)

GameStop, Like Tilray, is Treading Familiar Territory

On September 13, 2018, we provided downside targets for Tilray when it was trading at $118. The downside targets, based on the work of Edson Gould, were:

  • $66.67 (conservative target)
  • $54.55 (mid-range target)
  • $42.42 (extreme target)

Because of the speculative activity in Tilray, we made a point of building downside targets for the stock if the price doubled to $236. At such a price, the downside targets were:

  • $102.92 (conservative target)
  • $90.79 (mid-range target)
  • $78.67 (extreme target)

The actual intraday high for Tilray was $300 on September 19, 2018.  This was a far cry above the initial trading price of $118 that the downside targets were constructed.

As seen in the chart below, the actual low has been $2.43 and Tilray currently languishes at a price of $16.80.

image

On January 19, 2021, we projected price targets for GameStop (GME) when the stock was quoted at $39.91.  At the time, the downside targets were:

  • $21.26 (conservative target)
  • $18.22 (mid-range target)
  • $15.17 (extreme target)

Since that article, GameStop has increased as high as $159.18. 

image

Given what we’ve seen with Gould’s downside targets in the case of Tilray and other stocks, we still believe that the conservative downside target of $21.26 will be achieved.

Gamestop Downside Targets

Based on the work of Edson Gould, we have determined the downside targets for GameStop Corp. (GME) covering data from the last two years.  To arrive at conclusions that are reasonable, we first must determine precedent for the potential declines.

2002-2012

image

In the period from 2002-2007, GameStop Corp. increased to a high of $63.30 which established the following downside targets:

  • $28.28 (conservative target)
  • $24.69 (mid-range target)
  • $21.10 (extreme target)

The actual low was $15.73 in 2012.

2012-2020

image

In the period from 2012-2020, GameStop Corp. increased to a high of $57.43 which established the following downside targets:

  • $41.81 (conservative target)
  • $30.50 (mid-range target)
  • $19.20 (extreme target)

The actual low was $2.80 in 2020.

2020-2021

image

In the period from 2020-2021, GameStop Corp. increased to a high of $39.91 which established the following downside targets:

  • $21.26 (conservative target)
  • $18.22 (mid-range target)
  • $15.17 (extreme target)

If GameStop were to replicate the rise of 2002-2007, the price could easily achieve a level of $47.40 before a significant decline ensues.  However, achieving such a high price would still relegate the stock to the conservative downside target of $21.26.

The only action we take on downside targets is re-examination of the company fundamentals with an eye for acquiring a long position in the company in question.  We do not attempt to short the stock in any form.

Nikkei Upside Resistance Targets

Below are the upside resistance targets based on the work of Edson Gould and applied to the Nikkei 225 Index from 1989 to 2020.

image

As can be seen based on the conservative upside target of 22,983.45, once the level of the index got to the 22,937.60, there was a trading range established with a significant downside move before breaching the 28,401.78 mid-range target.

The new upside resistance level to watch for is 28,401.78.  At this point, we should expect similar price action of trading in a range and/or declining sharply before the next surge to the upside.

Britannia Industries 10-Year Targets

Below are the price targets for Britannia Industries Ltd. (BRITANNIA.BO) over the next 10 years. Continue reading

Hingham Institution for Savings 10-Year Targets

Below are the valuation targets for Hingham Institution for Savings (HIFS) for the next 10 years. Continue reading

Tesla Downside Targets

Review

We have run Tesla Downside targets in the past.

All parabolic moves get corrected by a specific amount, at minimum.  Because a declining trend has begun, we have run the numbers of the expected downside targets based on Edson Gould’s Speed Resistance Lines.

image

The targets are:

  • $238.35
  • $202.23
  • $166.11

The previous FAILED downside targets had significant problems that could have been easily remedied. First and foremost, for highly volatile stocks like Tesla, we did not include downside targets assuming the price would double.  This is usually the most likely scenario to play out and is best represented in our September 13, 2018 targets for Tilray (TLRY).

At the time, Tilray was trading at $118 and we had laid out our downside targets for the stock as seen for Tesla above.  However, acknowledging the psychological component of the change in the price, we included downside targets for Tilray if the price doubled ($236) [within the chart].  In fact, Tilray did double shortly afterwards and the downside targets for the doubled level were achieved, by a wide margin.

The doubling downside targets for TSLA are (assumes $996.64 peak):

  • $404.45
  • $368.33
  • $332.21

We’re glad to have failed the previous times as it refines and teaches what we need to know about the limits of Edson Gould’s work.  We hope to continue the process of learning as we teach.

See also:

Top three downside targets achieved by year

2020

2019

2018

2017

2016

Boeing: Upside Targets Before and After

A question has come in about the use of upside resistance targets.  Why bother looking at the upside targets?  The case of Boeing (BA) should prove instructive.

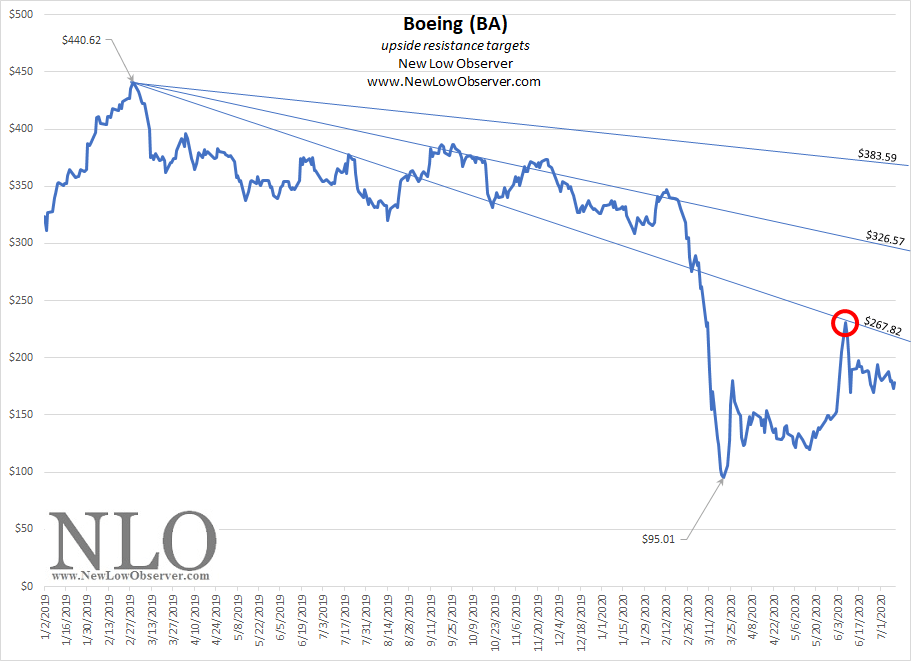
On April 15, 2020, we posted upside speed resistance lines for Boeing (BA).  At the time, the upside resistance targets were:

  • $267.82
  • $326.57
  • $383.59

image

Upside resistance targets are reflected in both time and price on a relative basis where a stock, after falling from a major high, will likely experience resistance on the move higher.

Since our April 15, 2020 posting on Boeing, a meaningful reflection of what investors should look for when anticipating the increase in the stock price is highlighted below.

image

As Boeing has increased from the low of $95.01, the stock price achieved the first upside resistance target at $267.82.  Circled in red is the anticipated resistance in the stock price.  What this usually means is that the stock price would decline or trade in a range.

For those determined to buy Boeing, regardless of fundamentals, upside resistance targets are a great places to anticipate possible turning points.  The flip side to this story is that we generally expect a re-test of the prior low or some semblance of a decline near that level.

Worth noting, when Boeing cracks the upside resistance target of $267.82 then $326.57 becomes the next resistance target and $267.82 becomes the next support level.  Prices above the first upside resistance target is generally the best level to buy a stock if it is backed by the fundamental prospects.

The story for Boeing is still unfolding. We’ll update the April 15, 2020 posting at situation continues to evolve.

Real Estate: Has the Low Been Seen?

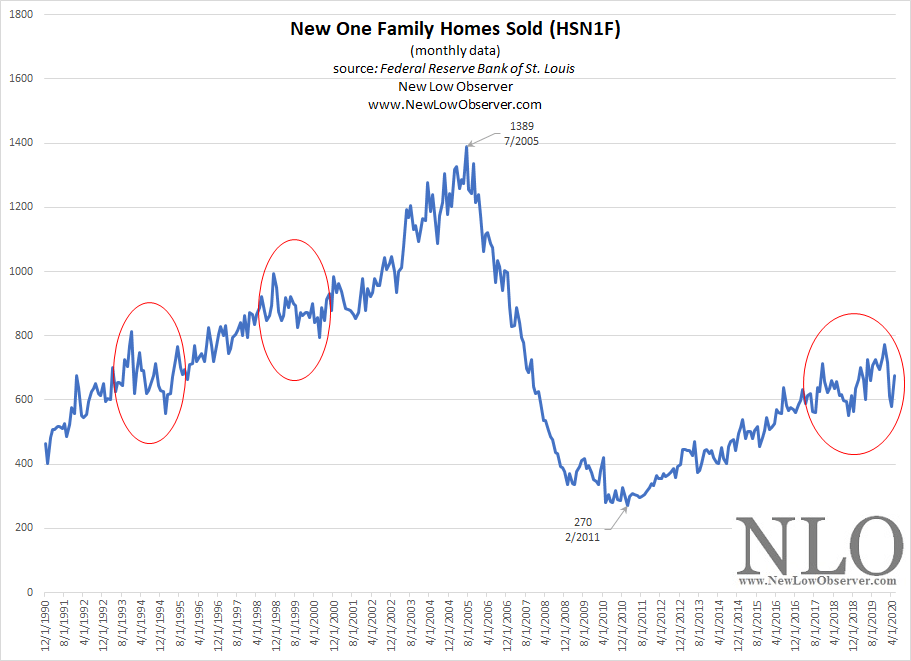
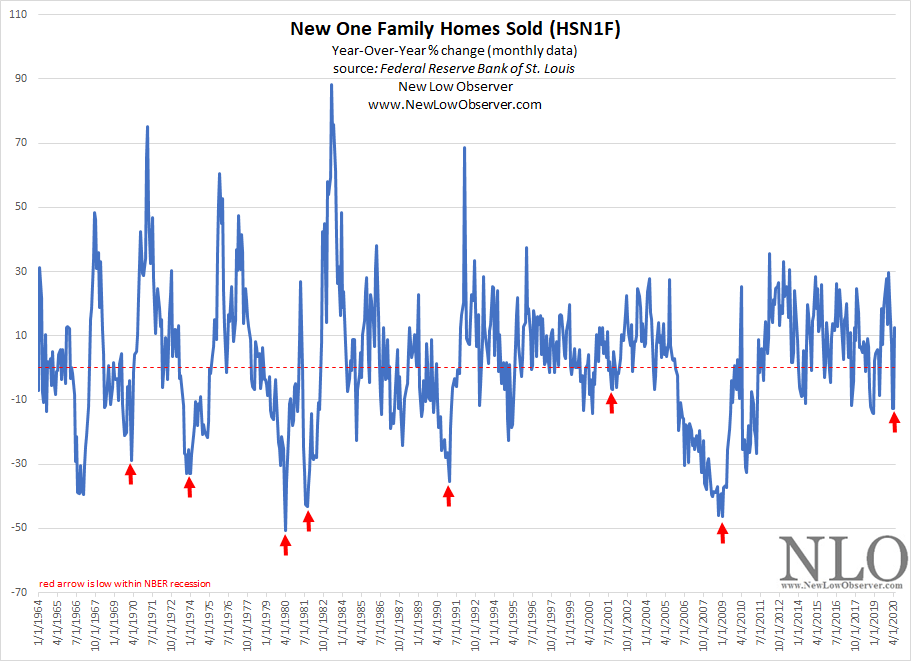
New one family homes sold for the month of May 2020 was reported today and it looks like the low has been reached.  The year-over-year perspective belies the image conveyed in the absolute change which is far from the 2005 peak.

Absolute Change

image

There is little need to expect that the prior absolute increase needs to be achieved (1,389 on July 2005).  However, it is no coincidence that we see some kind of reaction within a long-term rising trend at a similar level during the 1990 to 2005 increase. The two prior reactions broke the rising trend into three separate periods as noted by Edson Gould’s Three Steps Rule:

Three steps up in an advancing market and three steps down in a declining market usually exhaust the bullish potential accumulated at the bottoms and the bearish potential accumulated at tops- but sometimes there is a fourth step (Edson Gould Reports. Edson Gould’s 1975 Forecast. November, 1974. page 8. ).

When we speak of the “long-term” rising trend, we’re referencing our December 9, 2010 article titled “Real Estate: The Verdict Is In” and the subsequent updates since 2010 which is primarily based on the work of Roy Wenzlick.

Year over Year Change

image

The year-over-year (YoY) change shows that a reversal of the trend within a NBER recession has typically meant a reaction to a 27%-30% change at some point down the road.  We’re currently at 12.66% in the YoY change in New One Family Homes Sold so there should be some room to the upside before the current recession ends and the next recession begins.

As always, prepare for the worst as the current pandemic will not start the second wave until after the one year anniversary of the first wave.

See Also: