Author Archives: NLObserver Team

A Review of Projection Strategies

There are two articles that we published in 2010 on Seeking Alpha (also found on our site) that explore different methodologies but come to the same conclusion.  The first article is titled "Three Upside Scenarios for the Dow Industrials."  In that article, we covered the timing aspect of the Dow Industrials reaching the old high of 14,164 using price projection lines.The second article on Seeking Alpha is titled "A Market Cycle Worth Observing" which covers the 4-4 1/2 year market cycle.  Although the first article incorrectly anticipates the Dow Industrials going back to the old high of 2007, in both cases they arrive at a market top occurring between the months of January and June of 2011. 
If we look at the Dow Industrials in the chart above, we can see that May 3, 2011 was the actual top.  Coincidentally, the May 3, 2011 top was 93 days from our January 31, 2011 estimate and 91 days from the Dow Theory bear market indication on August 2, 2011. The two different approaches to analyzing the market may prove useful for market projections going forward.

Please consider donating to the New Low Observer. Thank you.

In the News: August 7, 2011

Buy this market at MarketWatch
Transatlantic Holdings (TRH) gets lowball offer from Buffett
 It was announced on Sunday August 7, 2011 that Warren Buffett has put up a bid for Transatlantic Holdings (TRH).  The all cash offer is coming in at $52, a premium of nearly 15% above the closing price of Friday August 5, 2011.  In a market that appear on the brink of collapse, the all cash offer from Berkshire Hathaway appears to be tantalizing.  However, we know for a fact that Buffett is making a lowball offer.
According to Yahoo!Finance, Transatlantic Holdings has a book value of $67.  According to Valueline Investment Survey, TRH has a book value of $66 and is expected to have a book value of $70 in 2012.
This is among the many stocks that we’ve tracked and then Buffett has subsequently made an offer for.  In fact, only two days after our investment recommendation of Wesco Financial, Buffett made an offer to buy the company out. In our August 29, 2010 Dividend Watch List, we said the following:
Our Investment Observation of Wesco Financial (WSC) on August 24, 2010 was quickly verified as being undervalued by Warren Buffett's offer to buy the remaining portion that he didn't already own on Thursday August 26th. We were able to provide a new Investment Observation of Transatlantic Holdings (TRH). With Transatlantic Holdings selling below book value, median price-to-earnings and dividend increases every year since going public, we believe TRH is a great alternative to Wesco Financial.
After we made the switch from Wesco to Transatlantic Holdings (TRH), we later sold Transatlantic Holdings within two days of the 52-week high.  Subsequent to our sell recommendation of Transatlantic Holdings the stock declined from $53.52 to $44.  On our June 12, 2011 Dividend Watch List we reiterated Transatlantic Holdings as a stock that should be considered.  Three suitors later, we’re getting the lowball offer from Buffett.  We’re hopeful that the Davis Advisors and other large shareholders fight this offer.
Please consider donating to the New Low Observer. Thank you.

NLO Dividend Watch List: August 6, 2011

Quick Take: U.S. rating downgrade
Late Friday evening, Standard & Poor's downgraded the debt of the U.S. from AAA to AA+.  The full implications of such action are yet to be known.  However, we believe that there are some interesting points to be made.  A lower debt rating will require the U.S. government to increase the yield offered on new issuance's. A more competitive yield might draw money out of the stock market and into fixed income securities. As rates rise, utilities and real estate investment trusts (REITs) might come under extreme pressure as the markets try to weight the benefit of holding assets that offer no guarantee and relatively less competitive yields.
Also, it has not gone unnoticed by us that the U.S. first got tagged with the AAA rating in 1941 and had held that rating through a completed interest rate cycle.  It seems almost ironic that the AAA rating ascribed to the U.S. when interest rates were at their lowest would be taken away at the same level 70 years later.  We also note that rating agencies tend to show up late to the party.  The chart below tells us that it only gets interesting from here.
  
NLO Dividend Watch List
At the end of the week, our list contained over 120 companies. We had to pare down the number of companies on the list so we decided to post only those stocks trading within 5% of the 52-week low.
symbol name price p/e earnings yield p/b % from low
GBCI Glacier Bancorp, Inc. 12.41 21.66 0.59 3.9 1.05 0.08%
SYBT S.Y. Bancorp, Inc. 21.47 12.41 1.71 3 1.72 0.28%
BOH Bank of Hawaii 43.04 12.77 3.37 4 2.03 0.49%
O Realty Income 30.01 28.5 1.04 5 2.21 0.81%
SFNC Simmons First National 23.47 11.29 2.15 3 1.03 0.95%
FNFG First Niagara Financial 11.06 16.58 0.76 5 0.79 1.10%
CHFC Chemical Financial 18.05 13.52 1.34 4.2 0.88 1.12%
MLM Martin Marietta 67.63 36.76 2.24 2 2.16 1.17%
SUSQ Susquehanna Bancshares 6.8 39.53 0.17 1 0.45 1.19%
CFR Cullen/Frost Bankers 51.28 14.53 3.5 3.4 1.46 1.24%
PRK Park National 60 13.52 4.51 5.8 1.42 1.52%
TCB TCF Financial 11.83 13.77 0.99 1.5 1.07 1.55%
SON Sonoco Products 29.9 15.03 2.04 3.5 1.91 1.63%
CMA Comerica 29.13 14.98 1.68 1.2 0.88 1.75%
IBKC IBERIABANK 49.18 28.84 1.84 2.3 1 1.80%
ALL Allstate 26.29 25.06 2.45 3 0.72 1.94%
EMR Emerson Electric 45.39 13.99 3.11 2.5 3.15 1.95%
BRK-A Berkshire Hathaway 107k 16.3 6.6k - 1.1 1.98%
MCY Mercury General 36.54 13.43 2.72 6.2 1.11 2.07%
MDP Meredith 26.56 9.56 2.85 3.4 1.58 2.08%
NTRS Northern Trust 41.3 16.39 2.71 2.4 1.41 2.13%
FII Federated Investors 19.53 12.14 1.67 4.3 3.75 2.20%
GS Goldman Sachs 125.18 12.28 9.13 1 0.94 2.31%
HGIC Harleysville 29.5 10.56 2.79 4.7 1.03 2.36%
SEIC SEI Investments 17.76 14.56 1.22 1.2 3.11 2.36%
AFL AFLAC 41.72 10.97 4.44 2.7 1.65 2.38%
PG Procter & Gamble 60.59 15.97 3.8 3.3 2.53 2.40%
BKH Black Hills 28.8 17.61 1.64 4.8 1 2.42%
LEG Leggett & Platt 19.3 16.31 1.16 4.6 1.88 2.50%
CINF Cincinnati Financial 25.97 14.36 2.27 5.8 0.84 2.53%
WMT Wal-Mart Stores 50.85 11.11 4.58 2.7 2.68 2.54%
AVY Avery Dennison 29.12 10.47 2.88 3.2 1.72 2.57%
UBSI United Bankshares, Inc. 22.66 13.73 1.66 4.8 1.24 2.58%
ANAT American Nat'l Insurance 76.02 12.85 5.91 4.1 0.55 2.59%
WEYS Weyco Group, Inc. 22.83 19.85 1.15 2.5 1.48 2.61%
NWN Northwest Natural Gas 42.8 16.31 2.62 3.7 1.58 2.64%
AVP Avon Products 23.21 13.56 1.62 3.3 4.87 2.72%
TDS TDS 25.47 19.59 1.3 1.6 0.7 2.83%
RBCAA Republic Bancorp 17.29 3.95 4.36 2.9 0.83 2.86%
CYN City National 48.58 16.09 3.02 1.5 1.27 2.95%
BXS BancorpSouth 11.92 25.36 0.16 0.3 0.83 3.03%
LLTC Linear Technology 27.08 10.83 2.36 3.1 12.52 3.08%
MRK Merck & Company 31.71 59.94 0.53 4.2 1.79 3.12%
EV Eaton Vance 23.29 15.12 1.54 2.5 5.71 3.14%
TRH Transatlantic Holdings 45.24 17.2 3.06 1.7 0.69 3.17%
TEG Integrys Energy Group 47.58 12.67 3.75 5.2 1.23 3.19%
NUE Nucor 34.95 23.6 0.82 3.6 1.48 3.22%
SCG SCANA Corp 37.32 12.56 2.97 4.7 1.24 3.38%
VLY Valley National Bancorp 12.15 14.45 0.77 5 1.6 3.47%
VNO Vornado Realty Trust 80.78 18.75 4.31 2.8 2.61 3.48%
ADM Archer-Daniels-Midland 28.64 9.15 3.25 2.1 0.97 3.58%
FCBC First Community Banc 12.04 9.48 1.25 2.7 0.76 3.70%
ECL Ecolab Inc. 47.78 21.51 2.23 1.4 4.77 3.71%
UVV Universal 36.33 6.7 5.42 5.1 0.84 3.74%
VAL Valspar 30.17 13.94 2.16 2.1 1.82 3.78%
BMI Badger Meter 35.27 20.04 1.76 1.5 3.01 3.80%
GCI Gannett Co. 10.8 5.07 2.13 2.3 1.19 3.85%
LOW Lowe's 20.15 14.18 1.42 2.4 1.53 4.13%
PEP Pepsico 64.67 16.45 3.74 3.1 4.17 4.22%
SJW SJW 22.86 17.2 1.28 2.8 1.67 4.48%
MUR Murphy Oil 55.2 11.64 4.74 1.6 1.29 4.55%
FFIN First Financial 30.44 14.79 1.99 2.8 2 4.85%
KMB Kimberly-Clark 64.07 15.12 4.4 4.1 4.22 4.93%
Top 5 Performance review
In our ongoing review of the NLO Dividend Watch List, we have taken the top five stocks on our list from August 6, 2010 and have check their performance one year later. The top five companies on that list can be seen in the table below.
Symbol Company 2010 2011 % change
PBI Pitney Bowes Inc   20.71 20.02 -3.33%
WST West Pharmaceutical Services 35.26 41.91 18.86%
PAYX Paychex, Inc.  25.56 27.09 5.99%
HGIC Harleysville Group 30.9 29.5 -4.53%
CWT California Water Service Group 17.49 18.09 3.43%
Average 4.08%
^DJI Dow Industrials 10653.56 11444.61 7.43%
^GSPC S&P 500 1121.64 1199.39 6.93%
The top 5 companies on our list last year underperformed the major indexes by a wide margin.  However, in the chart below, you'll notice that all 5 stocks achieved 10% gains (our ideal target for selling) within 4 months of the August 6th posting; such a gain approximates nearly 30% annualized returns.  We cannot emphasis enough the value of selling these stocks if a 10% gain is accomplished within a year while inside of a tax-deferred account.  As you can see, the year end results vastly differ from the gains that could have been made.
Please consider donating to the New Low Observer. Thank you.

Dow Theory: Q&A

A reader has asked, “if the bear market is confirmed, do you see a possible longer term test of the lows from ’08 [2009]?”
This question is predicated on the fact that the Dow Jones Industrial Average confirms the March low as the Transports plumbed both the June and March lows. Dow Theory relies heavily on confirmations of the two key indexes and without such there is no theory.
In addition, we’ve included Robert Rhea’s use of the Industrial Production Index as an indicator to watch for. If the Industrial Production Index exceeds the prior high while the Dow Industrials fail to decline below the March low then we’ll be in a no-man’s land, which would require that the Dow Industrials and Transports exceed the May high to get a change from the current bearish condition.
From a Dow Theory perspective, the downside target relies heavily on the concept of the 50% principle. Although mistakenly attributed to E. George Schaefer by Richard Russell, the 50% principle is derived from Charles H. Dow’s “great law of action and reaction.” Dow describes the “law” in the following manner:
The market is always responsive to the great law of action and reaction. The longer the swing one way the longer it will be the other. One of the best general rules in speculation is the theory that reaction in an advance or a decline will be at least one-half of the primary movement [50% principle].
The fact that the law is working through short ranges and long ones at the same time makes it impossible to tell with certainty what any particular swing may do; but for practical purposes, it is not infrequently wise to believe that when a stock has risen 10 points, and as a result of one or two short swings [double tops] does not go above the high point, but rather recedes from it, that it will gradually work off 4 or 5 points.[1]”
In another excerpt from Dow’s work, on the topic of the 50% principle, Dow says:
It often happens that the secondary movement in a market amounts to 3/8 to ½ of the primary movement.[2]”
Again, Dow emphasis the concept of the 50% principle:
Whoever will study our averages, as given in the Journal for years past, will see how uniformly periods of advance have been followed by periods of decline, amounting in a large proportion of cases to from one-third to one-half of the rise. [3]”
Finally, George Bishop, one of the greatest authors on the topic of Charles H. Dow, concludes:
The law of action and reaction applies to both the general market and to individual stocks. This law states that the reaction to an advance or decline will approximate half the original movement.[4]”
As far as we know, the concept of applying what is commonly known as fibonacci numbers to indexes and individual stock prices was never published before Dow’s time and yet Dow is often quoted offering up such indications in the Wall Street Journal. So pervasively is the “law of action and reaction” applied to stocks that free online stock charting software allows an investor to automatically indicate the fibonacci numbers with little reference to Dow’s use of such parameters for declines or increases from a primary trend.
Based on the chart above, the 50% principle, or law of action and reaction, indicates that the next downside target at 38% is 10,417 and at 50% is 9,679. We first must reach these downside targets in order to then project the next stage of the decline.
While we believe that a fibonacci 5th wave is possible, meaning that the index could fall below the prior low of March 2009, we have seen that this type of action can be deceptive and costly to those who gamble big in the belief that the low of the 5th wave will be substantially lower than 6440. We covered this topic in an October 16, 2009 article titled “Stock Market Projections”:
The second type of market low is based on the premise that the Dow fulfills the Wave principle and falls below the upward trending line (red) to the old support level 8100 and then 6440. A true Wave move down to the old low would bring the market below 6440. However, the last time this was fulfilled, in the period from 1970 to 1974, the market only fell 8.5% below the previous low of 631.16 on the Dow Industrials in 1970. Additionally, the Industrials ran up from 631.16 in 1970 to 1051.70 in 1973, an increase of 118% of the previous peak. As more time passes I expect the index to fall to 5474 if we do manage to complete a Wave formation on the downside.”
The prior piece suggests that anything is possible between the point where we are and the point we expect to be going towards. Our personal investing experience as demonstrated by our claim of 40% gains (going long only) from January 2008 to August 2008 and closing out 2008 with +14% gains suggests that getting out of the market entirely is not exactly the solution to a bear market signal. Charles Dow has commented on this matter:
"Even in a bear market, this method of trading will usually be found safe, although the profits taken should be less because of the liability of weak spots breaking out and checking the general rise.[5]"
Finally, we do need to emphasis that our analysis of the market is subject to change as conditions change. After the very first Dow Theory bull market indication in July of 2009, we have had to continually update the status of the indexes based on all significant and indications. Since that time, we’ve issued more than ten confirmations that the trend was bullish.
Likewise, we will have to revisit our August 2nd call with relevant updates that support or change our view. For now, the market bias is definitely bearish and would require both the Dow Industrials and Dow Transports to exceed the previous May 2011 highs to change our current view.
Citations:
[1] Dow, Charles H. Wall Street Journal. October 19, 1900.
[1] Bishop, George. Charles H. Dow and the Dow Theory. Appleton-Century-Crofts. New York. 1960. page 119.

[1] Sether, Laura. Dow Theory Unplugged. W&A Publishing. 2009. page 112.
[2] Dow, Charles H. Wall Street Journal. January 22, 1901.
[2] Bishop, George. Charles H. Dow and the Dow Theory. Appleton-Century-Crofts. New York. 1960. page 120.
[2] Sether, Laura. Dow Theory Unplugged. W&A Publishing. 2009. page 117.
[3] Dow, Charles H. Wall Street Journal. January 30, 1901

[3] Bishop, George. Charles H. Dow and the Dow Theory. Appleton-Century-Crofts. New York. 1960. page 120.
[3] Sether, Laura. Dow Theory Unplugged. W&A Publishing. 2009. page 199.
[4] Bishop, George. Charles H. Dow and the Dow Theory. Appleton-Century-Crofts. New York. 1960. page 231.
[5] Schultz, Harry D. A Treasury of Wall Street Wisdom. Investors' Press. (New Jersey, 1966). p. 12. Additional commentary here.

Please consider donating to the New Low Observer. Thank you.

Dow Theory: August 2, 2011

In a first since the bear market bottom of March 9, 2009 and the bull market indication that initiated the New Low Observer on July 24, 2009, the Dow Jones Industrial Average and the Dow Jones Transportation Average has signaled the beginning of a bear market.


The last confirmation of the bull market that we received was on April 6, 2011. At that time we suggested that the market, as a leading indicator for the economy would continue to rise for “…at least for the next month and a half….” As far as the market is concerned, the top came in early May.


Almost as a total shock to some, the announcement of the extension of the debt ceiling didn't help the market in the least. In fact, one could have applied the adage “buy the rumor (of a deal), and sell the news.”


Today, the Dow indexes continued to slump and ended the day down more than 2%. While we would look for a breach of the June 2011 low to be a key indicator of the bearish trend, we’re primarily focused on the March 2011 low to be the most revealing level. The charts below graphically make clear what may become the trend for the market over the next several months.


Starting back in May 2011, both indices had risen to the high then retraced (secondary reaction) in June before heading higher. The Transports took off and broke above the May high hitting 5,618 (point A1). The Industrial, however, failed to confirm by going to a new high and reached only 12,724 (point A2). This first non-confirmation was a definite sign of bearishness, although it did not signal a bear market had begun.


As our April 6, 2011 Dow Theory article indicated, “What we see from the Transports on the way up we may also see on the way down.” Today was no exception to that idea. The Transports didn’t bother falling to the prior secondary reaction levels set in June, instead it plummeted past the March 2011 low. Both the Industrials and the Transports closed the day lower than such key support as noted in point B. The Industrials closed slightly below at 11,866 (point B1) while the Transports tumbled to 4,942 (point B2).


What is most worrisome now is that the Transports have taken out both the June low and the March low of 4,950 as seen on the chart at point C2. The Industrial index may appear to have quite a distance to go, but our calculations reveal that it would take only 2.1% decline for the index to confirm the Transports (point C1) action. Confirmation of the March lows by the Dow Industrials would be a devastating signal for the stock market and economy going forward.


The characteristics of the market in the last several months is not unlike what was experienced back in November 2007 when Richard Russell wrote and excellent article on the bearish Dow Theory implications for Barron's (article here). The similarities between now and 2007 don’t end there. The charts of the Industrial Production Index (INDPRO) show a pattern of trying to achieve new highs in 2007 and the present but then failing.


The connection between the Industrial Production Index and Dow Theory is well established as put forth by the Dow Theorist Robert Rhea. Our last article (found here ) on the Industrial Production Index made clear the importance of considering the movements of this indicator.

We’d be jumping to conclusions if we went so far as to conclude that the July Industrial Production Index numbers would not exceed the March 2011 high of 93.0943. However, we would be surprised if the INDPRO, despite already being so close to the high, manages to go above the numbers that were set in June and March 2011.

The caveat to our analysis on the Dow Industrials and Dow Transports is the possibility that the Industrials actually don’t go below the low set in March 2011 (considered a divergence or non-confirmation of the trend). If the Dow Industrials do not confirm the same lows as the Transports then we’d essentially be in a Dow Theory no-man’s land. Under such conditions, the bias should be towards being bearish but on a wait and see basis.

Please consider donating to the New Low Observer. Thank you.

Nasdaq 100 Watch List: July 29, 2011

Below are the Nasdaq 100 companies that are within 20% of the 52-week low. This list is strictly for the purpose of researching whether or not the companies have viable business models. Although these companies are very risky, based on the current price they are at reasonable values and offer significant opportunity to outperform the market in the coming year.
Symbol Name Price P/E EPS Yield P/B % from Low
RIMM Research In Motion 25 3.97 6.3 0.00% 1.38 0.77%
YHOO Yahoo! Inc. 13.1 14.79 0.89 0.00% 1.38 1.24%
QGEN Qiagen N.V. 16.94 29.21 0.58 0.00% 1.57 2.17%
AKAM Akamai Technologies 24.22 25.63 0.95 0.00% 2.02 2.45%
LLTC Linear Technology 29.3 12.42 2.36 3.20% 17.06 2.99%
TEVA Teva Pharmaceutical 46.64 12.54 3.72 1.70% 1.8 3.97%
FSLR First Solar, Inc. 118.23 16.87 7.01 0.00% 2.84 6.13%
LIFE Life Technologies 45.03 22.45 2.01 0.00% 1.87 6.20%
PCAR PACCAR Inc. 42.81 21.73 1.97 1.70% 2.67 7.64%
CSCO Cisco Systems, Inc. 15.97 12.47 1.28 1.50% 1.87 8.05%
AMGN Amgen Inc. 54.7 11.37 4.81 0.00% 2 8.83%
ADBE Adobe Systems 27.71 14.84 1.87 0.00% 2.57 8.88%
SPLS Staples, Inc. 16.06 13.05 1.23 2.50% 1.57 8.88%
INFY Infosys Limited 62.22 22.88 2.72 1.40% 5.69 9.68%
WCRX Warner Chilcott plc 21.02 32.9 0.64 0.00% N/A 10.57%
VRSN VeriSign, Inc. 31.21 6.66 4.69 0.00% 9.89 12.27%
MRVL Marvell Technology Group, Ltd. 14.82 11.73 1.26 0.00% 1.87 12.53%
CHRW C.H. Robinson Worldwide, Inc. 72.31 28.92 2.5 1.60% 9.29 13.34%
ATVI Activision Blizzard, Inc 11.84 27.41 0.43 1.40% 1.34 13.85%
FLIR FLIR Systems, Inc. 27.46 20.95 1.31 0.90% 2.72 14.42%
PAYX Paychex, Inc. 28.23 19.88 1.42 4.40% 6.86 14.52%
LRCX Lam Research Corporation 40.88 6.96 5.88 0.00% 2.28 15.51%
MU Micron Technology, Inc. 7.37 11.66 0.63 0.00% 0.87 15.88%
SHLD Sears Holdings 69.67 N/A -0.49 0.00% 0.91 15.88%
URBN Urban Outfitters, Inc. 32.54 21.32 1.53 0.00% 3.96 16.38%
FFIV F5 Networks, Inc. 93.48 34.38 2.72 0.00% 6.53 16.85%
MSFT Microsoft Corporation 27.4 10.19 2.69 2.30% 4.07 17.50%
NIHD NII Holdings, Inc. 42.35 18.76 2.26 0.00% 2.04 19.13%
AMAT Applied Materials, Inc. 12.32 10.36 1.19 2.60% 2.01 19.96%

Watch List Performance Review

In our ongoing review of the Nasdaq 100 Watch List, we have taken the top five stocks on our list from July 30, 2010 and have checked their performance one year later. The top five companies on that list can be seen in the table below.
Symbol Name 2010 2011
% change
SYMC Symantec Corp. 12.97 19.06
46.95%
AMAT Applied Materials 11.80 12.32
4.41%
NVDA NVIDIA Corp. 9.19 13.83
50.49%
TEVA Teva Pharma. 48.85 46.64
-4.52%
PAYX Paychex, Inc. 25.99 28.23
8.62%
Average gain
21.19%
^NDX Nasdaq 100 1864.00 2362.81
26.76%
Please consider donating to the New Low Observer. Thank you.

In the News

Please consider donating to the New Low Observer. Thank you.

Dow Theory Misunderstood

Recently, in an article titled “Sell Signal for Stocks” found in Barron’s, Michael Kahn covers the topic of Dow Theory. The subtitle to the article was “a big drop in the transportation sector killed hope for a Dow Theory buy signal.” To the untrained reader of Dow Theory, Kahn’s article seems harmless enough. However, there are significant issues that need to be reconciled before it can be considered a discussion of Dow Theory.
Getting down to business, there are a couple of items that have to be addressed starting with the subtitle. First is the part that says “a big drop in the transportation sector killed hope for a Dow Theory buy signal.” If you’re someone who wishes to practice Dow Theory, you must abandon all hope, literally. William Peter Hamilton once said:
The averages, indeed, must be read with a single heart. They become deceptive if and when the wish is father to the thought”[1].
For Mr. Kahn to imply that hope has a role in a Dow Theorist’s mind when a buy signal is registered suggests that Mr. Kahn doesn’t understand Dow Theory. The study of the market using Dow Theory is best done when hopes and fears are abandoned.
The second item of concern in the subtitle relates to the indication of a buy signal. Dow Theory isn’t a “beat the market” strategy or get rich scheme. Dow Theory is as much an indicator of future economic growth for our country as it is a barometer for the stock market. William Peter Hamilton shed light on this topic by saying:
Diligent study of the averages will sufficiently show where a ‘line,’ having proved to be one of accumulation, has given definite information, not merely useful to the trader but valuable to those who look upon the stock market as a means of forecasting the trend of the country's general business”[2].
Also, Dow Theory does not give buy or sell signals. As a barometer, it merely indicates the direction that the stock market and economy might go three to nine months into the future. Those who take bull market indications as buy signals still need to be well versed in understanding values and its role in the selection of stocks. If a person not versed in values believes that a bull market indication means that they can haphazardly buy stocks then they are most likely to suffer severe losses and quickly become disenchanted with investing in stocks.
Throughout Kahn’s stab at Dow Theory, statements like “…good times turn to bad…” and “…followers of the century-old Dow Theory suddenly got excited” or “…followers were eagerly awaiting…” suggests that a person who uses Dow theory is emotionally tied to the outcome. Charles H. Dow was about as unemotional on the markets as anyone could get. William Peter Hamilton couldn’t become editor of the Wall Street Journal until after Dow’s death because Dow thought that Hamilton was too emotionally tied to his work. A person who is involved with Dow Theory needs to check their emotions at the door. Mr. Kahn seems to not take this into consideration when he wrote his article. If anything, Mr. Kahn should only be following Dow Theorists who reflect the most balanced view on the market’s direction, either up or down.
Specific to Dow Theory, Kahn says something that jumps off the page. In the fourth paragraph, Kahn states, “The bears have apparently resumed control of the stock market…” Kahn arrives at this conclusion based solely on the fact that the Dow Jones Transportation Index has declined. In Dow Theory, there is no such reference to the idea that simply because a single index declines from a peak that a bear market has been registered or that “the bears have resumed control of the stock market…” At no point does Kahn reference the fact that the prior trend (bullish) is presumed to be in force until specific conditions are met. Hamilton says as much in the following remark:
Perhaps it might be permissible to say that the secondary [reaction] movement suspends for a time the great primary swing, although a natural law is still in force even when we counteract it”[3].
Richard Russell adds clarity to Hamilton’s comments by saying the following:
… in examining the action of the Averages over a period of sixty-five years, the Dow Theorist has learned, among other things, that the movement of a single Average should never be considered alone. Further, the Dow Theorist has learned that the last trend should be considered to remain in effect until the contrary has been proved”[4].
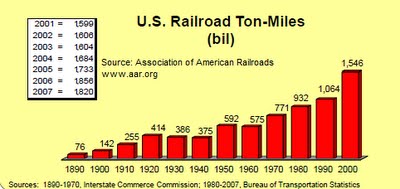
In the sixth paragraph, Kahn suggests that because the composition of the Dow Jones Industrial Index has changed dramatically over the years that we could hardly expect it to be a true reflection of our economy. Kahn implies that because we’re in a services and information-based economy, that there is less transporting of products by rails and trucks and therefore can’t possibly be reflective of the times. The charts below reflecting only the rail sector tells a completely different story.
For 2007, more revenue was generated through rail transportation than any other method of domestic transportation. Not far behind rail was trucking, which, when combined, equaled nearly 74% of total revenue generated for all methods of transportation within the U.S.
In paragraph 7, Kahn succumbs to a common myth about the relationship between commodity prices and the level of the stock market. Kahn suggests that when commodity prices are down then the stock market has every reason to rise because commodities “…are input costs for many large-cap U.S. companies…” Certainly commodities are input costs for most production but there is little to suggest that there is an inverse relationship between the two other than the ebb and flow of bad U.S. monetary policy. As a Dow Theorist, Kahn should know that Charles H. Dow said in his Wall Street Journal column on February 21, 1901:
…the stock market and the commodity market move substantially together” [5].
We have been able to confirm the relationship between commodity prices and the stock market with gold, silver and various commodity processing companies like ConAgra (CAG), Heinz (HNZ), Archers Daniels-Midland (ADM) and Sysco Foods (SYY). Kahn is right about the input costs but wrong about the inverse relationship between the stock market and commodities.
Starting in paragraph 9, Kahn begins to provide technical analysis of the iShares Dow Jones Transportation ETF. Use of an ETF to derive inference of the Dow Jones Transportation Average when the data on the index is freely available comes off as lazy. In the end, the ETF cannot show you what the Dow Jones Transportation Average did in 1946 or 1973 which is important because inevitably you’re going to need that data. If Kahn was going to use the Tranports ETF, he should have shown the 100% correlation to the actual index to justify using the ETF. No such evidence was presented for using the ETF over the actual index.
In the review of the transport ETF, Kahn speaks at length on chart patterns known as gaps and gap reversals. Considerable effort is put into explaining how the gap reversal pattern reflects negatively on the direction of the transport ETF. However, noticeably absent in his discussion of the transport ETF is the obvious “double top” formation. Double tops and double bottoms were indicated to be very important formations according to Charles H. Dow. Alternatively, William Peter Hamilton and Robert Rhea arrived at the conclusion that such formations bear little importance when considering the price movement of the indexes. From our own work on the topic of double tops and double bottoms, we have found that Dow was right about the importance of such a price characteristic and have been able to prove, with significant evidence throughout the history of the Dow indexes, that double tops and double bottoms are critical indicators for determining market direction when applying Dow Theory.
After the discussion of the transports ETF, Kahn goes far afield when he starts to discuss the price action of several illiquid sector specific ETFs from within the transportation industry. Kahn covers the airline and shipping as representative examples of the malaise that he believes reflects the weakness in the transportation sector of the economy. Both the airline and shipping ETFs are reaching new 52-week lows (our favorite point to examine values.) However, such analysis doesn’t seem to add up when compared to the iShares Dow Jones Transportation ETF.
If the Dow Transportation ETF is just coming off of a new high, then what relevance does the airline and shipping ETFs have to do with the discussion of the broader index which contains shipping, rail and airline stocks? From a Dow Theory perspective, such maneuvering to prove a point is in contravention of the theory itself. According to Dow, Hamilton, Rhea and a host of others, though not infallible, the averages discount everything.
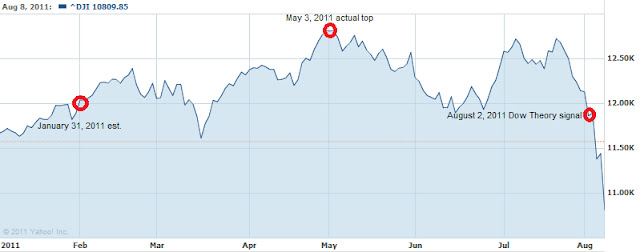
Kahn finishes his article by saying that if the Dow Jones Transportation Average (notice the switch to index from the ETF) cannot hold above the March low of 4920 then a sell signal would have been registered. Dow Theory just doesn’t work this way. The theory is all about confirmations. As Hamilton says:
One of the shortest ways of going wrong is to accept an indication by one average which has not been clearly confirmed by the other. [6]”
If the Transportation Average breaks the March low then the only way to get a sell signal is to have the Industrial Average break the March low. For all intents and purposes, the Transportation Average could fall to 3000 or lower without triggering a sell signal. Historically speaking, such a wide divergence on a relative basis has occurred before without triggering a sell signal.
We understand that Kahn is the big money man who can articulate his thoughts in a fashion that is acceptable to publications like Barron’s. However, we know that his interpretation of Dow Theory is incorrect.
Citations:
[1] Hamilton, William Peter. The Stock Market Barometer. Harper & Brothers, New York. 1922. page 133.
[2] ibid. page 177.
[3] ibid. page 154.
[4] Russell, Richard. Richard Russell’s Dow Theory Letters. Issue 166. December 27, 1961. page 1.
[5] Sether, Laura. Dow Theory Unplugged. W&A Publishing. 2009. page 50.
[6] Hamilton, William Peter. The Stock Market Barometer. Harper & Brothers, New York. 1922. page 138.


Please consider donating to the New Low Observer. Thank you.

NLO Dividend Watch List: July 22, 2011

It was a great week for the market as the S&P 500 continued to move up toward the 1,350 mark and closed the week up 2.2%.  The Dow didn't fair so well but nevertheless closed the week up 1.6% and is looking to test the 12,800 high.  Our watch list contains 39 companies within 11% of their respective 52-week low.

July 22, 2011 Watch List
Symbol Name Price % Yr Low P/E EPS (ttm) Dividend Yield Payout Ratio
MDP Meredith Corp. 29.36 -0.05% 10.30 2.85 1.02 3.47% 36%
ANAT American National Insurance 76.58 0.37% 12.96 5.91 3.08 4.02% 52%
WABC Westamerica BanCorp.  48.57 0.39% 15.52 3.13 1.44 2.96% 46%
MCY Mercury General Corp. 38.7 1.45% 14.23 2.72 2.40 6.20% 88%
GBCI Glacier BanCorp., Inc.  13.12 2.22% 22.24 0.59 0.52 3.96% 88%
TCB TCF Financial Corp. 13.05 2.55% 13.18 0.99 0.20 1.53% 20%
HGIC Harleysville Group Inc.  30.72 2.71% 11.01 2.79 1.44 4.69% 52%
SFNC Simmons First National Corp.  25.15 2.72% 11.70 2.15 0.76 3.02% 35%
TDS Telephone and Data Systems 30.18 2.84% 23.22 1.30 0.47 1.56% 36%
AFL AFLAC Inc. 46.21 3.08% 10.41 4.44 1.20 2.60% 27%
UVV Universal Corp. 37.14 3.16% 6.85 5.42 1.92 5.17% 35%
BRK-A Berkshire Hathaway Inc. CL 'A' 115,750 3.37% 17.59 6580.82 N/A N/A N/A
SYBT S.Y. BanCorp., Inc.  23.35 3.62% 13.65 1.71 0.72 3.08% 42%
STBA S&T BanCorp., Inc.  17.61 5.04% 15.18 1.16 0.60 3.41% 52%
CMA Comerica, Inc. 33.78 5.31% 18.56 1.82 0.40 1.18% 22%
PEP PepsiCo Inc. 65.76 5.50% 17.58 3.74 2.06 3.13% 55%
AVY Avery Dennison Corp. 33.69 5.66% 11.70 2.88 1.00 2.97% 35%
ALL Allstate Corp.   28.69 5.73% 11.71 2.45 0.84 2.93% 34%
NTRS Northern Trust Corp.  45.92 5.81% 16.94 2.71 1.12 2.44% 41%
NWN Northwest Natural Gas Co. 46.62 5.96% 17.79 2.62 1.74 3.73% 66%
CHFC Chemical Financial Corp.  19.1 6.30% 17.36 1.10 0.80 4.19% 73%
SUSQ Susquehanna Bancshares, Inc.  7.9 6.95% 46.47 0.17 0.08 1.01% 47%
SCG SCANA Corporation 40.54 7.06% 13.65 2.97 1.94 4.79% 65%
CINF Cincinnati Financial Corp.  28.4 7.14% 12.51 2.27 1.60 5.63% 70%
BOH Bank of Hawaii Corp. 46.35 7.33% 12.91 3.59 1.80 3.88% 50%
BXS BanCorp.South Inc. 12.49 7.62% 78.06 0.16 0.04 0.32% 25%
GS Goldman Sachs Group, Inc.   135.49 7.66% 14.84 9.13 1.40 1.03% 15%
PRK Park National Corp. 63.95 7.76% 14.18 4.51 3.76 5.88% 83%
SON Sonoco Products Co. 32.94 8.36% 16.15 2.04 1.16 3.52% 57%
PG Procter & Gamble Co.   64.25 8.62% 16.91 3.80 2.10 3.27% 55%
WMT Wal-Mart Stores, Inc. 54.52 8.74% 11.90 4.58 1.46 2.68% 32%
BKH Black Hills Corp. 30.84 8.90% 18.80 1.64 1.46 4.73% 89%
AVP Avon Products, Inc. 28.69 9.16% 17.71 1.62 0.92 3.21% 57%
LLTC Linear Technology Corp.  31.27 9.25% 13.25 2.36 0.96 3.07% 41%
CTL CenturyTel, Inc.   38.66 9.57% 12.97 2.98 2.90 7.50% 97%
CFR Cullen/Frost Bankers, Inc. 55.77 9.72% 15.93 3.50 1.84 3.30% 53%
MLM Martin Marietta Materials, Inc. 79.16 9.77% 35.18 2.25 1.60 2.02% 71%
FII Federated Investors Inc 22.18 9.89% 13.28 1.67 0.96 4.33% 57%
C Citigroup Inc  40.26 10.42% 13.16 3.06 0.04 0.10% 1%
39 Companies              

Watch List Summary
There is a noticeably large number of insurance and financial companies on our list.  This may be because of the foreign debt situation in Greece or the possibility of a debt ceiling impass.  Further analysis would have to be done but it appears that this sector is out of favor and worth investigating.

On the top of our list is Meredith (MDP), a major player in the media sector.  While the Murdoch scandal seems to casts a pall over the sector, Meredith has emerged to be in good shape financially.  The company earned $2.85 in the last 12 months and is paying $1.02 in dividends.  Next year earnings are expected to come in at $2.68 which would not jeopardize the dividend payment in our view.  Historically, MDP is considered undervalued with a dividend yield of  1.3% thus the current yield of 3.47% suggests that the stock could double in due time.  The company will report its quarterly earning on July 28th.

American National Insurance (ANAT) is no stranger to the NLO team.  This life insurer trades at a 55% discount to its book value and offers a hefty 4% dividend yield.  With the payout ratio at 50%, earnings will need to drop substantially for the company to consider cutting, halting or borrowing to pay the dividend.  Anyone interested in this stock should be aware that it is a highly illiquid stock.  The average volume based on the last three months is merely 21,000.  Friday's volume for ANAT was 12,150.  American National Insurance has been trading in a line formation or consolidation for a year and any move, up or down, could set the trend for the stock.

Another stock hitting our radar is Pepsico (PEP).  Pepsi reported higher profits but scaled back on their guidance which took down the stock.  Pepsi's yield is slightly above 3% making the stock worth looking into.  Historically, Pepsi trades between 2.2% and 1.2% so a 3% yield would imply that this company is undervalued by as much as 40%.

Stock Highlight: Greenhill & Co. (GHL)

Greenhill & Co. (GHL) is trading close to its 52-week low but because the dividend payment exceeds earnings, it doesn't pass our criteria to appear on our list this time around.  Greenhill & Co. is an investment bank that has managed to emerge from the wreckage of the financial crisis relatively intact. While the investment bank is experiencing internal turmoil as indicated in this Bloomberg article, we believe we have a solution for some of the problems related to the company’s financial situation. We recommend that Greenhill & Co. consider cutting the dividend in half.
Cutting the dividend would put Greenhill & Co. (GHL) in a better financial position to retain the staff necessary to get the mergers and acquisitions done. We recognize that the dividend, with a payout that exceeds current earnings, would further undermine the current stock price and pay less cash to the largest shareholders. However, maintaining such a high dividend leaves less cash available to pass on to their most valuable asset, the employees.
In the chart below we present Edson Gould’s Altimeter which reflects the relative value of a company based on the dividend and the stock price. In the case of Greenhill, the red line reflects the actual movement of the price in relation to the dividend while the blue line reflects what we believe would be the ideal dividend policy of a cut.
Under either scenario, Greenhill & Co. is undervalued. However, if Greenhill maintains the aggressive dividend policy, which exceeds current earnings, then the company does not have a viable business model for the inevitable slowdown in the economy and stock market. On the other hand, were GHL to cut their dividend and then re-embark on a more gradual dividend increasing policy, there would be assured growth of the company going forward. We’d rather take the dividend cut instead of being acquired at a discount by a less efficient but “well established” federally chartered investment bank.

Top Five Performance Review

In our ongoing review of the NLO Dividend Watch List, we have taken the top five stocks on our list from July 23, 2010 and have checked their performance one year later. The top five companies on that list can be seen in the table below.
Symbol Name 2010 Price 2011 Price % change
BEC Beckman Coulter, Inc. 47.26 83.5 76.68%
JNJ Johnson & Johnson   57.63 66.72 15.77%
FRS Frisch's Restaurants, Inc 19.99 22.4 12.06%
XRAY DENTSPLY International 29.26 39.54 35.13%
WST West Pharmaceutical 35.41 46.45 31.18%
      Average 34.16%
         
DJI Dow Jones Industrial 10,424.62 12,681.16 21.65%
SPX S&P 500 1,102.66 1,345.02 21.98%
Last year's list performed well because of the acquisition of Beckman from Danaher.  Some of our reader may recalled our article on Beckman.  In any case, a study of this list alone could yield great ideas.  If you look at the composition of the top five, there are three companies that we could classify as healthcare related companies, Beckman (BEC), Johnson & Johnson (JNJ), and West Pharmaceutical (WST).   Because Beckman is no longer publicly traded, we could not display the stock in the chart above.


Disclaimer:

On our current list, we excluded companies that have no earnings. Stocks that appear on our watch lists are not recommendations to buy. Instead, they are the starting point for doing your research and determining the best company to buy. Ideally, a stock that is purchased from this list is done after a considerable decline in the price and extensive due diligence. We suggest that readers use the March 2009 low (or the companies' most distressed level in the last 2 years) as the downside projection for investing. Our view is to embrace the worse case scenario prior to investing. A minimum of 50% decline or the November 2008 to March 2009 low, whichever is lower, would fit that description. It is important to place these companies on your own watch list so that when the opportunity arises, you can purchase them with a greater margin of safety. It is our expectation that, at the most, only 1/3 of the companies that are part of our list will outperform the market over a one-year period.

Please consider donating to the New Low Observer. Thank you.

In the News: July 18, 2011

Please consider donating to the New Low Observer. Thank you.

Nasdaq 100 Watch List: July 15, 2011

Below are the Nasdaq 100 companies that are within 20% of the 52-week low. This list is strictly for the purpose of researching whether or not the companies have viable business models. Although these companies are very risky, based on the current price they are at reasonable values and offer significant opportunity to outperform the market in the coming year.
Symbol Name Trade P/E EPS Yield P/B % from low
CSCO Cisco Systems, Inc. 15.59 12.17 1.28 1.50% 1.8 3.23%
AKAM Akamai Technologies 29.85 31.59 0.95 0 2.51 5.48%
SPLS Staples, Inc. 15.2 12.35 1.23 2.60% 1.49 6.11%
TEVA Teva Pharmaceutical 47.97 12.9 3.72 1.70% 1.87 6.93%
MRVL Marvell Technology 14.87 11.77 1.26 0 1.83 7.21%
URBN Urban Outfitters, Inc. 31.41 20.58 1.53 0 3.81 8.20%
QGEN Qiagen N.V. 18.28 31.52 0.58 0 1.68 8.42%
AMGN Amgen Inc. 55.05 11.44 4.81 0 2.08 9.53%
INFY Infosys Limited 61.39 22.57 2.72 1.40% 5.63 9.74%
BRCM Broadcom Corp 33.27 16.79 1.98 1.10% 3.06 11.27%
YHOO Yahoo! Inc. 14.69 17.26 0.85 0 1.49 13.52%
CERN Cerner Corporation 61.9 42.11 1.47 0 5.14 14.09%
ADBE Adobe Systems 29.29 15.69 1.87 0 2.69 15.09%
ATVI Activision Blizzard 11.91 27.57 0.43 1.40% 1.33 15.41%
LLTC Linear Technology 30.48 12.92 2.36 3.10% 17.46 16.11%
MU Micron Technology 7.41 11.72 0.63 0 0.85 16.51%
MSFT Microsoft Corp 26.78 10.64 2.52 2.40% 4.18 17.82%
LRCX Lam Research 42.06 7.16 5.88 0 2.23 18.85%
Watch List Summary
Sirius XM gets added to Index
On Monday July 11, 2011, Sirius XM Radio (SIRI) was added to the Nasdaq 100 index. The addition of Sirius defies logic unless there is something about the future prospects for SIRI that the Nasdaq committee knows that we don’t. Typical of many index selection committees, SIRI is being added near its 2 ½-year high as opposed to being added when the stock is near the 52-week low.
Although a low priced stock, Sirius XM (SIRI) is not inexpensive. SIRI currently sports a trailing p/e ratio of 221 but is estimated to have a forward (2012) p/e ratio of 31. There are two ways that this scenario can play out, either the stock price will fall to $0.31 or the earnings will rise from $0.01 to $0.07.
We’re willing to submit to the idea that somewhere in between lays the truth. For example, if earnings rise to $0.04 a share and the p/e multiple comes down to 100 by year end 2012, then the stock would be conservatively price at around $4 a share. However, this is among the rosiest scenarios that could be depicted for this stock at the moment.
SIRI is a speculator’s dream, but it presently relies on the greater fool theory to justify rising another 150% as it had in the last 12 months. Speculators will be richly rewarded for taking unmitigated risk by going long SIRI if earnings doubled or triple. However, with the p/e ratio at 221, nothing less than perfection is expected from SIRI.
Being added to the Nasdaq 100 gives a lifeline that didn’t seem to exist for Sirius (SIRI). With the wind at its back, the odds increase that the SIRI can perform as some bulls expect. However, going into the fourth quarter of the year, if the stock does not perform as planned then Sirius will be summarily dismissed from the index as quickly as it was added.  However, as we said before, maybe the Nasdaq committee knows something we don't which justifies Sirius being added to the index as opposed to the other 49 companies on their list of eligible candidates.
Nasdaq Fritters Away Significant Opportunity
We’re surprise that, out of the 50 alternatives to add to the Nasdaq 100 index, Sirius XM Radio (SIRI) was the prime choice. After all, if a company with an $8 billion market cap, $0.01 of earnings and 221 p/e ratio was all that could be found then something must be awry with the Nasdaq selection committee. In the table below, we found four companies that are among the 50 on the list of companies that should have been selected instead of SIRI.
Our suspicion is that SIRI has been added to the index simply as a means to have a position that rivals the recent IPO of Pandora (P). This will certainly give SIRI a boost but if the post-IPO performance of Pandora (P) is any indication, SIRI gains could become the Nasdaq 100’s pains.
A simple question should be asked, “do you see Sirius XM Radio (SIRI) as the best investment alternative when most major indexes have been in a 2-year cyclical bull market?” Adding Sirius XM Radio (SIRI) to the Nasdaq 100 index under the current conditions reflect a lapse in judgment.
Chip Sector Dip
On July 12, 2011, Microchip Technology (MCHP) fell 12% on news that prospects for the future weren’t as bright as analysts anticipated. The Wall Street Journal seemed to believe that MCHP’s decline was the “…canary in the [chip]sector’s coalmine.” The decline in MCHP has resulted in 4.19% dividend yield.
The last time that we wrote about MCHP, March 20, 2010, the company was yielding 4.80%. At the time we said of the chip sector, “[the] clustering of companies in a specific industry may indicate that the entire sector is undervalued.” Several articles we wrote about the chip sector in March 2010 followed with a particular article of interest on the topic titled “Applied Materials and the Chip Sector Should Be on Your Radar.”
To varying degrees, our assessment was correct. At the 1-year marker after the list of chip stocks was generated, only one stock Intel (INTC) was unable to provide above average returns. All other chip stocks on our March 20th list generated a minimum of 26% as indicated in the chart below. In general, March of 2011 has marked the top on the chip stocks mentioned so far with Microchip Technology (MCHP) and Applied Materials giving back the most from their respective price peak.
Despite the large declines by MCHP, the total return for MCHP has been 20.67% as opposed to the unadjusted return of 11.25%. In the case if Microchip Technology, the total return had been 54.85% at the most recent high set on May 12, 2011.  Microchip Technology (MCHP) and many of its competitors aren’t out of the woods yet. However, as the dividend yields increase, there becomes little justification for ignoring these stocks.
Google Jumps On Usual Earnings Surprise
On Friday July 15, 2011, Google’s (GOOG) announcement of 36% profit growth resulted in 13% gain in pre-market trading. As we’ve demonstrated before, pre-market trading rules the rest of the trading day. According to the Nasdaq.com website, 651,141 shares traded in the pre-market and Google rose 13.08% or $69.16.
During the regular market hours on the same day, 13 million shares changed hands with the stock declining $-0.48. We’d view the inability of the stock to move higher during regular market hours on tremendous volume as an overall negative.
According to S.A. Nelson, the man credited with coining the term “Dow Theory”, “…stocks have recovered after artificial depression and relapsed after artificial advances to the middle point which represented value as it was understood by those who bought or held as investors." Based on the chart pattern below, it appears that Google’s stock price is bumping up against the artificial advance or overvalued range. Since early 2008, Google (GOOG) has had challenges advancing far above the $630 level. The most recent move should provide more clarity on whether GOOG can make a strike for the $715 level.
Google (GOOG) was last on our watch list on June 17, 2011. At that time, GOOG was selling for $500 with a p/e ratio of 19 and a p/b ratio of 3. So far, the stock has risen 19% in exactly one month. From our perspective, there is little need to tempt a stock price that, although it can move higher, has already provided greater than 200% on an annualized basis.
Watch List Performance Review
In our ongoing review of the Nasdaq 100 Watch List, we have taken the top five stocks on our list from July 17, 2010 and have checked their performance one year later. The top five companies on that list can be seen in the table below.
Symbol Company 2010 2011 % change
GILD Gilead Sciences $31.94 $41.00 28.37%
NVDA NVIDIA $10.05 $14.10 40.30%
XRAY DENTSPLY $29.25 $39.26 34.22%
FISV Fiserv, Inc. $45.60 $61.37 34.58%
SPLS Staples, Inc. $19.31 $15.20 -21.28%
- - - - -
- - - Average 23.24%
- - - - -
NDX Nasdaq 100 1803.48 2356.67 30.67%
In the last year there were two outliers when compared to the Nasdaq 100 Index.  First was Nvidia (NVDA) which soared as high as 150% in the first six months of being on our July 15, 2010 list.  On the other end of the spectrum we have Staples (SPLS) which has languished with loses of more than -20% in the last year.  Overall, the top five stocks on our watch list from last year underperformed the corresponding index by -7.43%.  Only three of the stocks (XRAY), (FISV) and (NVDA) were able to exceed the returns of the Nadaq 100.  The 28% return from (GILD) and -20% from (SPLS) dragged the performance of the top 5 down considerably.
Disclaimer:

On our current list, we excluded companies that have no earnings. Stocks that appear on our watch lists are not recommendations to buy. Instead, they are the starting point for doing your research and determining the best company to buy. Ideally, a stock that is purchased from this list is done after a considerable decline in the price and extensive due diligence. We suggest that readers use the March 2009 low (or the companies' most distressed level in the last 2 years) as the downside projection for investing. Our view is to embrace the worse case scenario prior to investing. A minimum of 50% decline or the November 2008 to March 2009 low, whichever is lower, would fit that description. It is important to place these companies on your own watch list so that when the opportunity arises, you can purchase them with a greater margin of safety. It is our expectation that, at the most, only 1/3 of the companies that are part of our list will outperform the market over a one-year period.

Please consider donating to the New Low Observer. Thank you.

In the News: July 10, 2011

Please consider donating to the New Low Observer. Thank you.

NLO Dividend Watch List: July 8, 2011

It was a good week for the market as the S&P 500 roared back 1.75%.  The Dow did even better and closed at 12,657, up 1.95% for the week.  Our watch list contains 30 companies within 11% of their respective 52-week low.

July 8, 2011 Watch List

Symbol Name Price % Yr Low P/E EPS (ttm) Dividend Yield Payout Ratio
CMA Comerica, Inc. 33.79 2.15% 18.57 1.82 0.40 1.18% 22%
NTRS Northern Trust Corp.  45.87 2.89% 16.93 2.71 1.12 2.44% 41%
BXS BanCorp.South Inc. 12.01 3.80% 75.06 0.16 0.04 0.33% 25%
GS Goldman Sachs Group, Inc.   134.08 4.51% 14.69 9.13 1.40 1.04% 15%
BRK-A Berkshire Hathaway Inc. CL 'A' 115,050 4.66% 17.48 6580.82 N/A N/A N/A
GBCI Glacier BanCorp., Inc.  13.44 4.67% 22.78 0.59 0.52 3.87% 88%
AFL AFLAC Inc. 46.51 5.35% 10.48 4.44 1.20 2.58% 27%
NWN Northwest Natural Gas Co. 45.93 5.42% 17.53 2.62 1.74 3.79% 66%
WABC Westamerica BanCorp.  49.7 5.95% 15.63 3.18 1.44 2.90% 45%
ANAT American National Insurance 78.74 6.20% 13.32 5.91 3.08 3.91% 52%
MCY Mercury General Corp. 39.61 6.22% 14.56 2.72 2.40 6.06% 88%
SYBT S.Y. BanCorp., Inc.  23.59 6.41% 13.80 1.71 0.72 3.05% 42%
SCG SCANA Corporation 39.55 6.63% 13.32 2.97 1.94 4.91% 65%
CHFC Chemical Financial Corp.  19.07 6.83% 17.34 1.10 0.80 4.20% 73%
TCB TCF Financial Corp. 13.85 7.36% 13.99 0.99 0.20 1.44% 20%
BKH Black Hills Corp. 30.25 7.57% 18.45 1.64 1.46 4.83% 89%
BOH Bank of Hawaii Corp. 46.24 7.69% 12.88 3.59 1.80 3.89% 50%
UVV Universal Corp. 38.11 7.78% 7.03 5.42 1.92 5.04% 35%
SFNC Simmons First National Corp.  26.13 8.24% 12.15 2.15 0.76 2.91% 35%
HGIC Harleysville Group Inc.  32.01 8.51% 11.47 2.79 1.44 4.50% 52%
MDP Meredith Corp. 31.41 8.61% 11.02 2.85 1.02 3.25% 36%
KMB Kimberly-Clark Corp. 66.62 9.11% 15.14 4.40 2.80 4.20% 64%
AVP Avon Products, Inc. 28.53 9.23% 17.61 1.62 0.92 3.22% 57%
SUSQ Susquehanna Bancshares, Inc.  8.08 9.49% 47.53 0.17 0.08 0.99% 47%
PG Procter & Gamble Co.   64.93 9.73% 17.09 3.80 2.10 3.23% 55%
PRK Park National Corp. 64.98 9.95% 14.41 4.51 3.76 5.79% 83%
TDS Telephone and Data Systems 31.85 10.44% 24.50 1.30 0.47 1.48% 36%
HHS Harte-Hanks, Inc. 8.39 10.54% 10.62 0.79 0.32 3.81% 41%
WMT Wal-Mart Stores, Inc. 54.08 10.84% 11.81 4.58 1.46 2.70% 32%
CINF Cincinnati Financial Corp.  29.02 10.89% 12.78 2.27 1.60 5.51% 70%
30 Companies


Watch List Summary

Northern Trust (NTRS) came in second on our list this week. The shares are trading just 2.89% above the 52-week low. We had written an investment observation about this company back on September 2010 and feel that none of redeeming qualities have changed except the price and improved fundamentals.  Since our last write up, the stock rose as high as 56.55, a gain of nearly 20%, but has retraced that level.  We gave a sell recommendation on December 3, 2010 (Sell recommendation here) with a gain of 10.96% which was exactly half of the upside move, in accordance with Dow's theory. 

Northern Trust (NTRS) is now trading below $47 but the fundamentals have gotten stronger.  Net tangible assets rose from $6,369M in September 2010 quarter to $6,522M in March 2011 quarter.  Credit Suisse shares our view with a recent report of five banks with strong capital level.

Fundamentals aside, the chart below shows that $45 has been a strong support level for nearly 3 years.  In addition, the price-to-book ratio (P/B) is close to its historical low range.  Northern Trust's P/B is even lower than it was at the December 2008 low.


Aflac (AFL) is an insurance company we'd like to highlight this week.  Currently trading at just 5% above its 52-week low, we believe prudent investors could gain good upside if shares return to their historical fundamental averages.  The five year average P/E for AFL is 15.6.  As one of the largest life insurance companies in Japan, the headline risk has pressured investors to only pay 10.5x earnings.  Additionally, the 5-year average dividend yield  is 1.8%.  The current yield of 2.58% is a sign of great value.  With a dividend payout ratio at 27%, we believe the safety of the dividend is very much intact.

C.H. Robinson (CHRW), a third-party logistics company, was last on our Dividend Watch List on June 11, 2010. At the time, the company had some pretty unassuming numbers such as a P/E ratio of 27, dividend yield of 1.72% and a dividend payout ratio of 47%. Apparently, those unassuming numbers have translated into a stock price that has achieved a 38% gain over the last 13 months. However, the chart below shows that the last seven months have been a challenge for new investors.

Something is compelling existing investors to sell whenever the stock price approaches $82 a share. This is despite the fact that the current trailing P/E ratio of 33 is only marginally higher than the 27 p/e ratio back in June 2010. C.H. Robinson also has impressive return on assets and return on equity of 20% and 34%, respectively.

Being in the transportation sector, the company’s fate is tied with the performance of the Dow Jones Transportation Average. Since the first Dow Theory signal that was provided in July 2009, the Transportation Index has led the way higher with each successive bull market confirmation. The most recent ability of the Transportation Average to attain an all time high bodes well for the remaining transportation stocks. The primary risk to the scenario of the Transportation Average going higher is that the Dow Jones Industrial Average do not confirm by making an all time high.

Our bias is towards securing the gains that have been accomplished for C.H. Robinson. While the upside seems unlimited, the gains achieved so far require seeking out clear value propositions from our most recent Dividend and Nasdaq 100 watch lists.

Top Five Performance Review

In our ongoing review of the NLO Dividend Watch List, we have taken the top five stocks on our list from July 9, 2010 and have checked their performance one year later. The top five companies on that list can be seen in the table below.

Symbol Name 2010 Price 2011 Price % change
FRS Frisch's Restaurants, Inc 19.95 22.47 12.63%
DNB Dun & Bradstreet Corp. 67.46 76.04 12.72%
WMT Wal-Mart Stores, Inc. 49.43 54.08 9.41%
FII Federated Investors Inc 21.24 24 12.99%
XOM Exxon Mobil Corp.   58.78 82.42 40.22%


Average 17.59%


DJI Dow Jones Industrial 10,198.03 12,657.20 24.11%
SPX S&P 500 1,077.96 1,343.80 24.66%

In our view, it is important to learn from the past and thus we shall revisit what the news of Exxon (XOM) was a year ago.  The most compelling case we found was from an article featured in Barron's titled Buy Into the ExxonMobil Slide.  Collins Stewart's analyst, Katherine Lucas Minyard, called for a 40% upside and amazingly hit that mark (and more) in less than a year.  Her research was very prescient and well timed.  In her report, Minyard stated that based on historical P/E multiples, Exxon should be trading at $82 per share.  Moreover, just as we subscribe to the dividend yield theory, Minyard noted that "ExxonMobil's dividend yield is currently 3.1%, with a return to the 10-year average 2.2% implying a share price of $82".  The stock closed at $82.42 on Friday July 8, virtually one year after Minyard's report was published.


Disclaimer:

On our current list, we excluded companies that have no earnings. Stocks that appear on our watch lists are not recommendations to buy. Instead, they are the starting point for doing your research and determining the best company to buy. Ideally, a stock that is purchased from this list is done after a considerable decline in the price and extensive due diligence. We suggest that readers use the March 2009 low (or the companies' most distressed level in the last 2 years) as the downside projection for investing. Our view is to embrace the worse case scenario prior to investing. A minimum of 50% decline or the November 2008 to March 2009 low, whichever is lower, would fit that description. It is important to place these companies on your own watch list so that when the opportunity arises, you can purchase them with a greater margin of safety. It is our expectation that, at the most, only 1/3 of the companies that are part of our list will outperform the market over a one-year period.

Please consider donating to the New Low Observer. Thank you.

iShares Silver Trust (SLV): Tipping its hand or major bluff

On May 5, 2011, we concluded an article about the iShares Silver Trust (SLV) with the following:

“…in general, we should see SLV tread water for a brief period of time before falling back to the prior low which began with the current run back in November 2008. Dow Theory suggests that a reasonable buying opportunity would exist at below line B (blue line B). However, we wouldn’t jump in at the slightest move below line B. Instead, we’d like to see the price decline to the dashed blue line at $15.41 or below.”

Our claim that SLV would tread water or trade in a range was based on the prior move from the peak in March 2008 to July 2008. We felt that, until proven otherwise, the 2006 to 2008 run was the best precedent to go by. In the charts below, we have found some striking similarities that are worth observing.

In both instances, after the peak in the price, the silver ETF traded in a relatively narrow range. After the peak of 2008 and before the subsequent collapse of SLV, the ETF traded in a range for about 5.5 months. This year, the late April peak has traded in a feeble range for less than 2.5 months. So hobbled is the price action of SLV that it appears as if it will break the price support of the crash level that was previously established in May 2011.
Closing below a panic support level at this time leads to two contrasting thoughts.
First, all things considered, SLV is going to $15.41 as indicated in our May 5th posting. If this is a correct view then, as we’ve asserted on many occasions, the stock market has to follow along with gold and silver. The magnitude of the decline would be considered phenomenal if SLV actually does go back to $15.41, a loss of 55%. Keep in mind that in the period from July 14, 2008 to November 20, 2008, SLV fell 53%. We don’t know of any single factors or specific events that would contribute to such a decline on the scale of what occurred in 2008. However, it is apparently such declines are not out of the question.
Our second thought is that the price action we’re seeing is simply one of the largest and most beautifully orchestrated fake outs in history. Not since the Nipper Panic on May 9, 1901, when Northern Pacific Railroad went from as low a $160 up to $1,000 and closed at $325 all in a single day, have we seen what is possibly at hand for the iShares Silver Trust (SLV). We could be absolutely wrong, but the price action of SLV is following along the same lines. As a sidebar, the massive movements in Northern Pacific Railroad happened on the same day that most active stocks crashed 20% to 60% before recovering most, if not all, of the losses in the same day.
To be on the safe side, we’re opting for the view that SLV will replicate much of the same pattern as was demonstrated in the previous period from 2006 to late 2008. If we’re wrong then we’ll miss out on the bigger party in silver since the Hunt brothers corner of the market in the late 1970’s. If we’re partially correct, then we should see SLV very close to a great buying opportunity at $15.41. We’d translate the actions of SLV into the purchase of severely discounted silver stocks and junk silver.*
*We avoid buying ETFs whenever possible

Please consider donating to the New Low Observer. Thank you.

In the News: July 3, 2011