Below are the valuation targets for Digital Realty Trust (DLR) for the next 10 years. Continue reading
-
Topics
Archives
-
-
Recent Posts
-
-
-
-

Below are the valuation targets for Digital Realty Trust (DLR) for the next 10 years. Continue reading
Below are the valuation targets for American Tower Corp (AMT) for the next 10 years. Continue reading
Posted in 10-year Targets, Altimeter, AMT
On this date in 1942, Roy Wenzlick, in his publication titled Real Estate Analyst, said the following:
"Leaving aside the equitable or inequitable nature of the freezing data in the various cities, what will be the over-all effect of rent control on values and on sales during the period of the emergency and the period that follows?
"According to Cyril De Mara, Rentals Administrator in Canada, rent control in Canada has brought about an increase in sales with increasing prices of single-family residences with increasing prices. Many persons not being able to rent the type of units they desired have purchased instead - giving the former tenants notice to vacate. In fact, this has continued to the-point that labor circles have complained that tenants are being forced out to make room for buyers. According to Mr. De Mara apartment sales have remained on the game level as a year ago, although sales prices of apartments have not increased. Speculative buyers have been replaced by persons desiring to have a fixed income."
Roy Wenzlick. Real Estate Analyst. "The Effects of Rent Control". May 27, 1942. page 137.
Posted in 1942, On This Day, Real Estate Analyst, Wenzlick
On April 3, 2018, when the Dow Jones Industrial Average was at 24,033.36, we said the following:
“The downside risk is the most important element to watch for. In this regard we’re focused on the 18,575 level as the downside target. However, the 18,575 level can’t be achieved without first going through the 21,530 level. This, 21,530, happens to be the 50% Principle for the Altimeter. Therefore, the chart below is the outline of 21,530 as our next expected downside target.”
On March 23, 2020, the Dow Jones Industrial Average achieved a low of 18,213.65 on an intraday basis. The 18,213.65 level was within our target of 18,575 for downside risk.
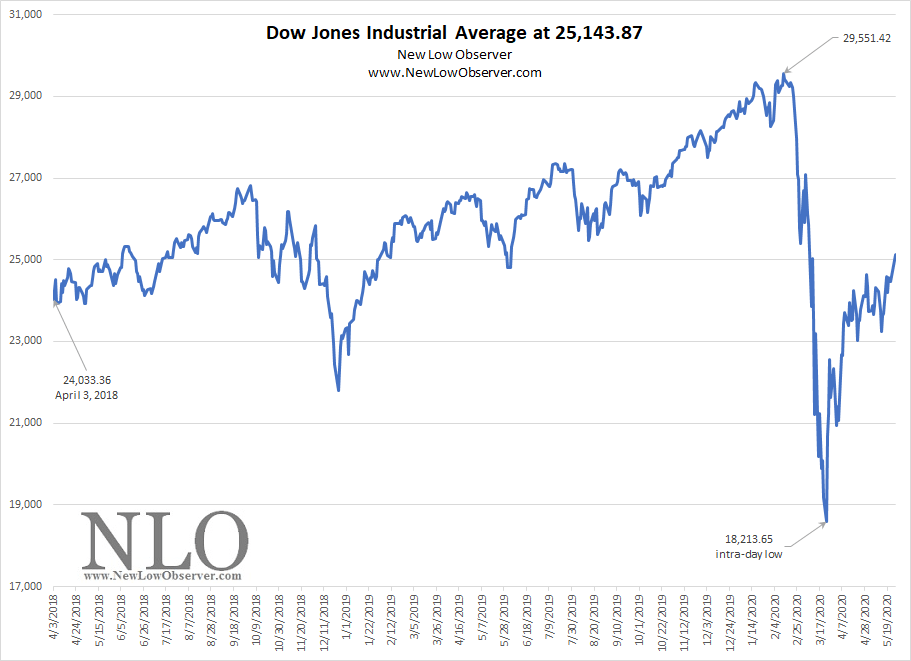
Our updated analysis on the Dow Jones Industrial Average found here: Dow 10-Year Targets
Posted in Dow Altimeter
Below are the valuation targets for the Dow Jones Industrial Average (DJIA) for the next 10 years. Continue reading
Posted in 10-year Targets, Altimeter, artificial advance, artificial depression, DJIA
Tagged members
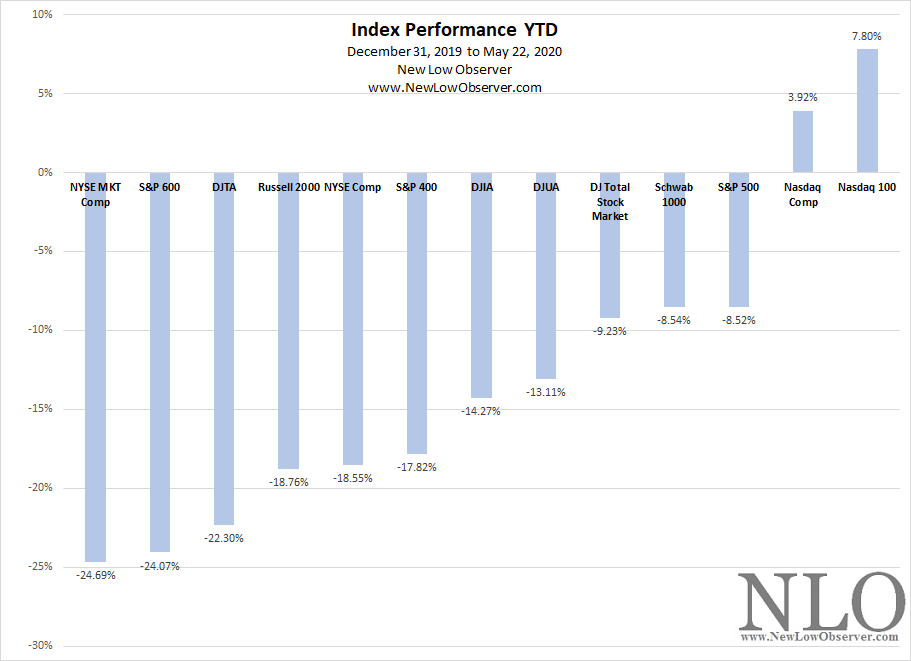
Below is the year-to-date (YTD) performance of various major indexes and from December 31, 2019 to May 22, 2020.
The following is the breakdown of the Dogs of the Dow (found here) in week 21, compared to other fundamental ratios. Continue reading
Below is the annual 52-week low for Southern California Edison (SCE) from 1958 to 1967. We’ve also included the 3-month Treasury Bill as a comparison to show how utility stocks perform against the backdrop of rising interest rates.

In this example, the 3-month Treasury Bill increased from 1.77% to 4.31%. Meanwhile, Southern California Edison (SCE) had a 52-week low range from $15.87 to $31.75.
Posted in 1958-1968, Chart of the Day, interest rates, SCE
Below are the valuation targets for Markel Corp. (MKL) for the next 10 years. Continue reading
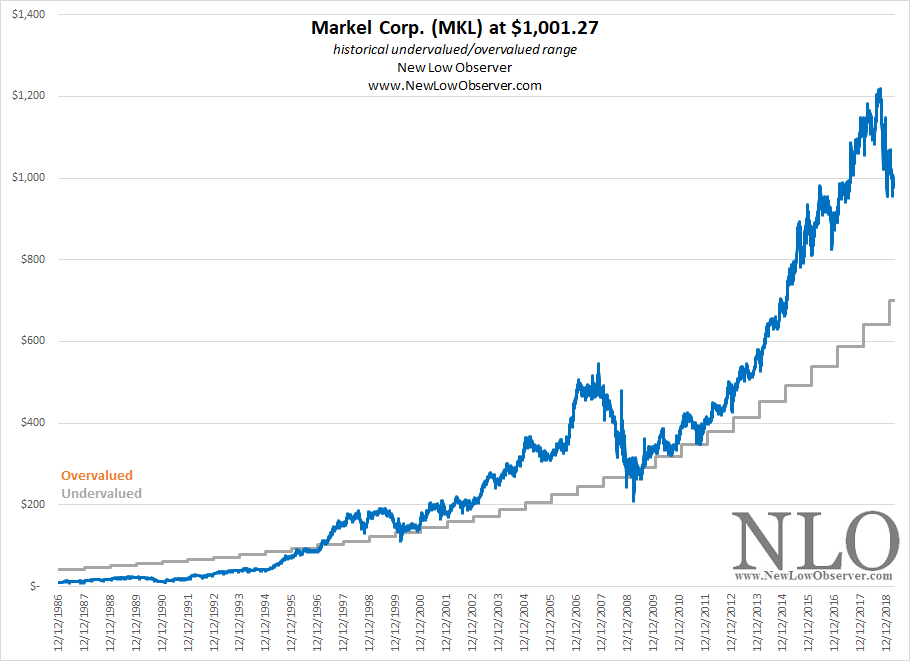
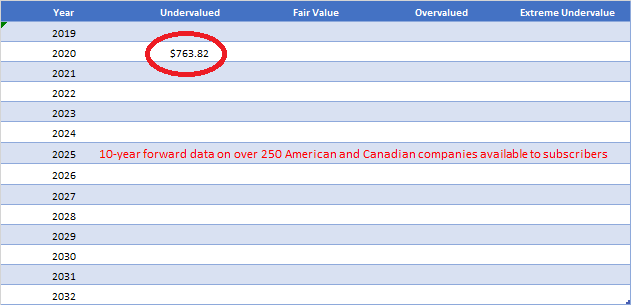
On April 12, 2019, we updated the 10-Year price targets for Markel Corporation (MKL) when the stock was trading at $1,001.27. At the time, we had estimated 2020 undervalued target of $763.82.
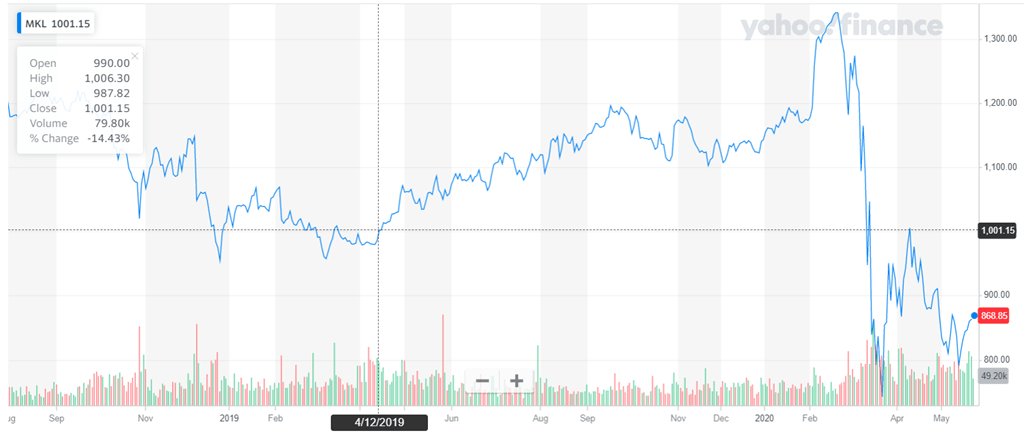
Since April 2019, MKL has had an intraday low of $742.21 on March 23, 2020.
see also: All 10-Year Targets
Posted in MKL, Target Achieved
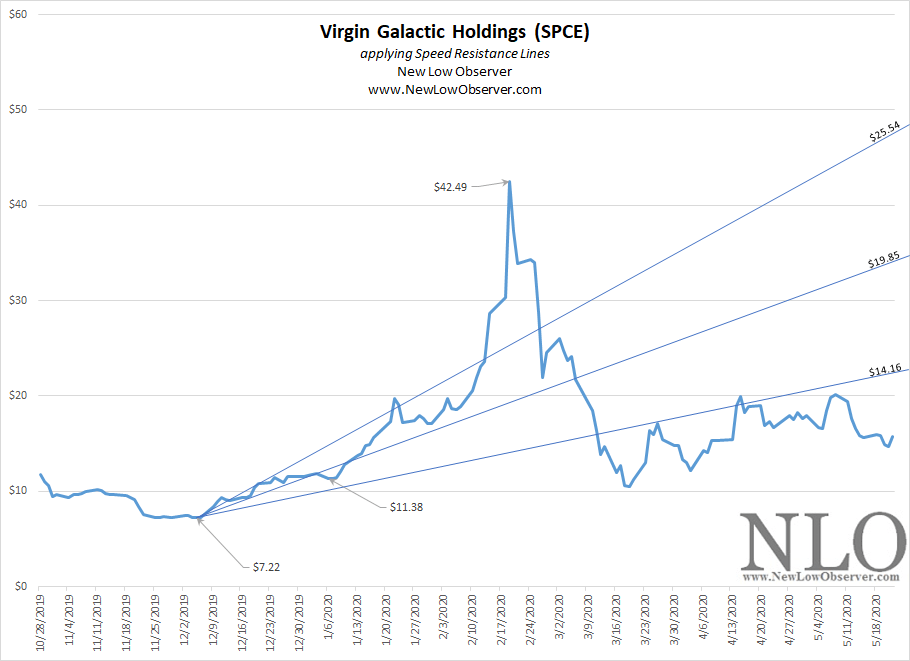
On February 20, 2020, we said the following Virgin Galactic Holdings:
“Virgin Galactic Holdings (SPCE) is creating a scenario where the extreme downside target could easily be achieved while being considered a normal ‘bounce.’ The price would have to rise to above $60 before the above downside targets are no longer valid. These situations don’t end well…”
At the time, we also presented the targets below, with the extreme target being $14.16.
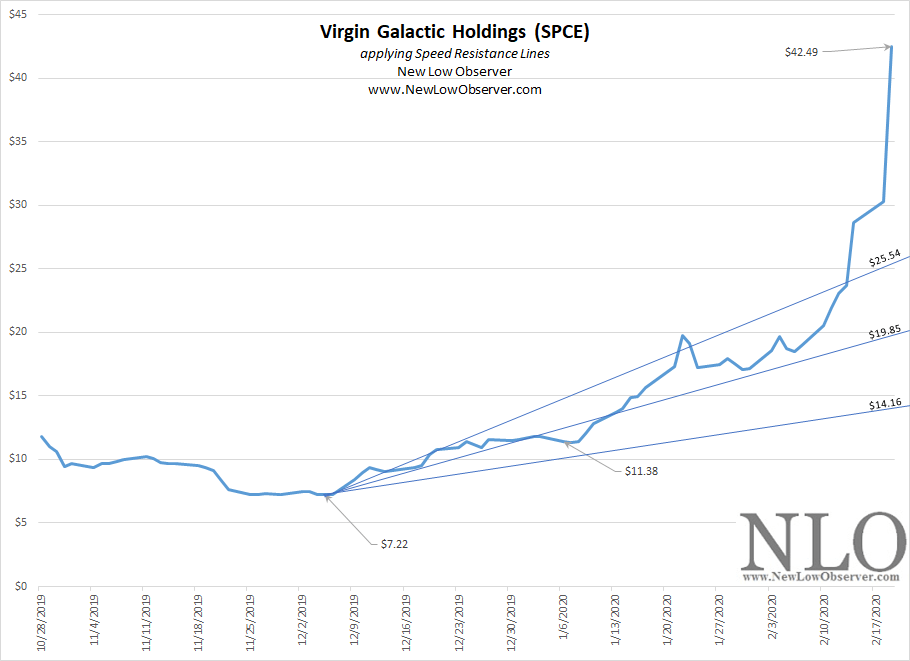
Since February 20, 2020, SPCE has declined as low as $9.06 on an intraday basis.
Upside Resistance Targets
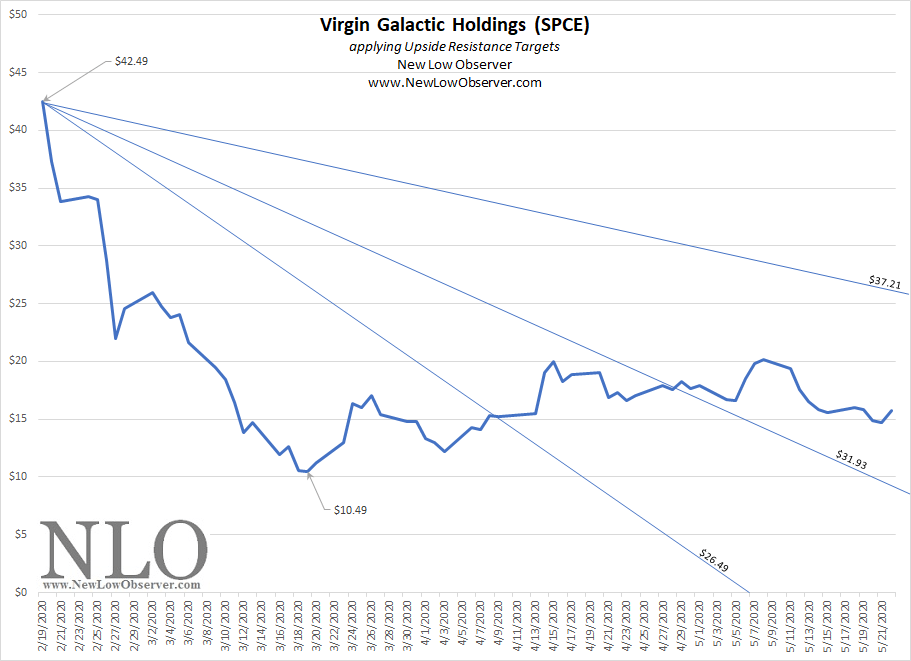
The $37.21 target is the next stop, which currently equates to a range from $26-$37.
Posted in SPCE, SRL, Target Achieved
Prior Year Watch List Review (May 24, 2019)
The best performing strategy from last year was high P/B which came in virtually flat for the year. This was driven by a rise of +40% for Jack Henry & Associates (JKHY). However, that gain was offset by a loss of -53% from Nordstrom (JWN). Chasing high yield companies was detrimental with Alliance Resource Partners (ARLP), which at the time yield 12.30%, as it lost -82% in a year. Occidental Petroleum (OXY) with yield of 5.80% lost -74%.
| May 24, 2019 | ||
| Strategy | High | Low |
| Yield | -58.8% | -7.9% |
| P/E | -11.2% | -34.4% |
| Payout Ratio | -28.5% | -18.0% |
| P/B | -0.4% | -39.4% |
| Closest to Low | -18.4% | |
| S&P 500 | -4.4% | |
| Dow Jones Ind | -4.4% | |
| Top 5 companies except for Index | ||
U.S. Dividend Watch List May 22, 2020
Since the low in March 2020, the market appears to be consolidating between 2,800 and 3,000. Interestingly, the Nasdaq is only 5.50% from the high and is in the black YTD. Obviously tech appears to be the winner during this interesting period and we are seeing some companies making new highs. Below are companies that are still trading near the low. Continue reading
Posted in Dividend Achiever Watch List, Dividend Achievers, Dividend Watch List
Tagged members
Below are the valuation targets for Archer Daniels Midland (ADM) for the next 10 years. Continue reading
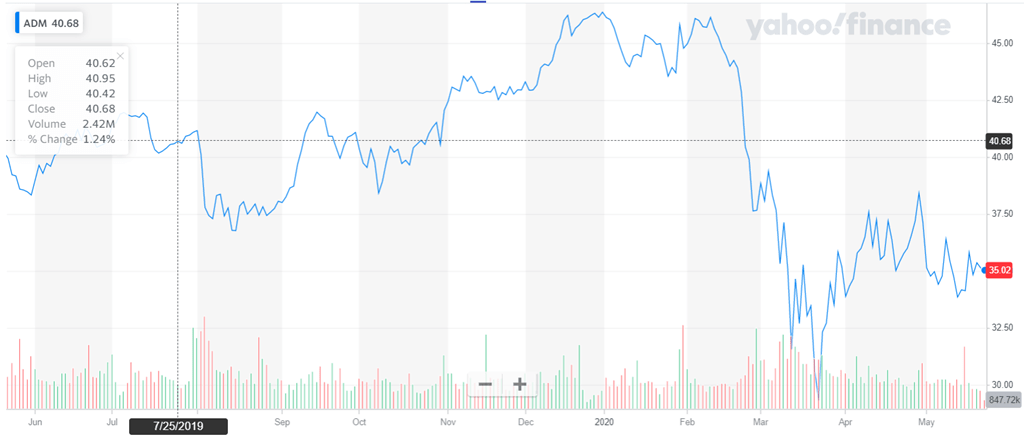
On July 25, 2019, we updated the 10-Year price targets for Archer Daniel Midlands (ADM) when the stock was trading at $40.80. At the time, we had estimated 2020 extreme undervalued target of $28.43.
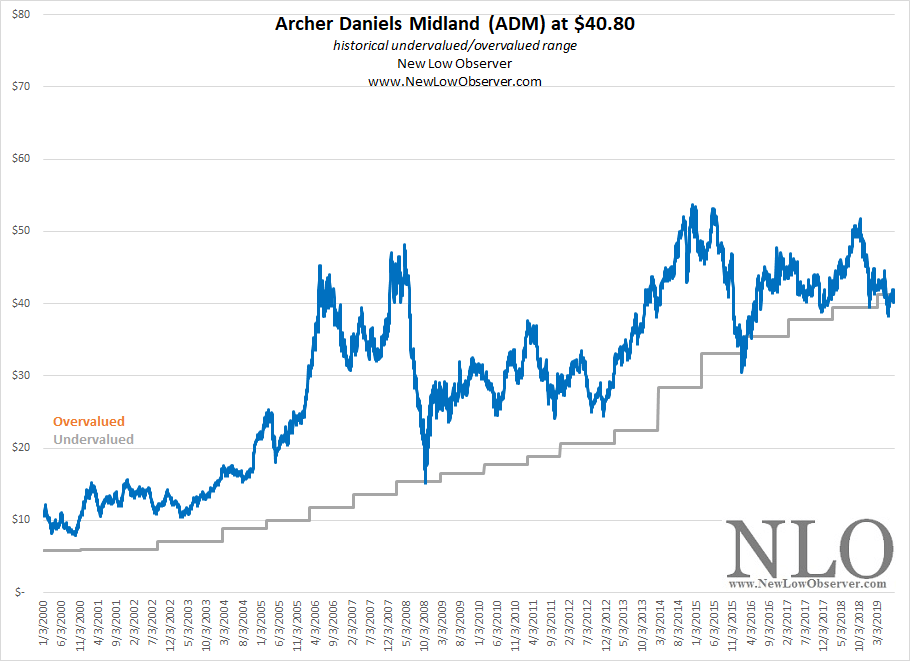
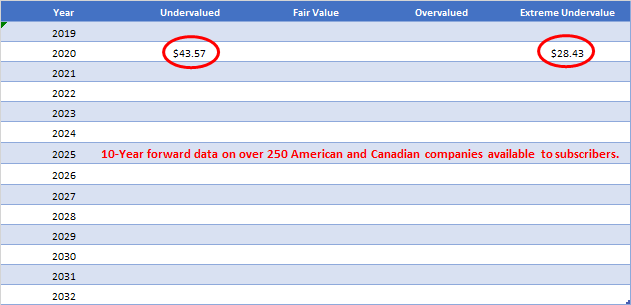
Since July 2019, ADM has had an intraday low of $28.92 on March 23, 2020.
see also: All 10-Year Targets
Posted in ADM, Target Achieved