Author Archives: nlo-admin

Transatlantic Holdings Acquisition Complete

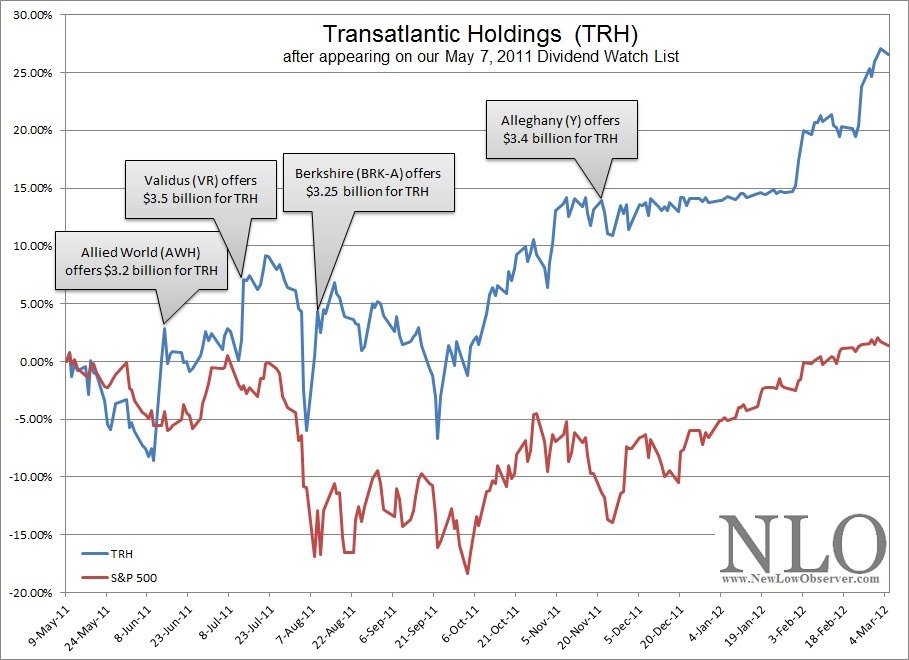
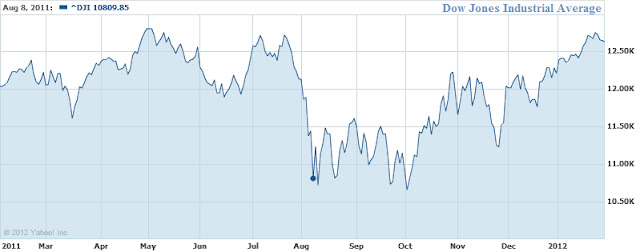
On March 6, 2012, the acquisition of Transatlantic Holdings (TRH) was completed by Alleghany Corp. (Y).  On several occasions we have made specific reference to the undervalued nature of the Transatlantic Holdings. Below is a performance chart of TRH after appearing on our May 7, 2011 Dividend Watch List.

TRH

In several accounts that we manage, TRH was already a large holding.  However, we couldn’t help but load up on additional shares after Alleghany Corp. announced that they put in a bid for TRH.  We were glad that TRH reject the lowball bid by Warren Buffett’s Berkshire Hathaway (BRK-A).

When requested  by Alleghany whether we wanted cash or shares, we took shares in the taxable accounts and cash in the tax-deferred accounts.  As luck would have it, the redemptions of our TRH shares into cash/stock comes in time for our recommendation to reduce exposure to the stock market based on Dow Theory’s non-confirmation.

Dow Theory Update

It appears that Dow Theory is not understood, by even the best in the industry.  In an article titled “The Meaning of the Transports’ Weakness,” Mark Hulbert surveyed some of the industry’s best Dow Theorists for a clue as to what the market was expected to do next. What stands out in this article is the following remark:

“Frustratingly, not all Dow Theorists agree on an answer. In fact, two of the three monitored by the Hulbert Financial Digest — Jack Schannep of TheDowtheory.com and Richard Moroney of Dow Theory Forecasts — think the appropriate point of comparison is not last summer but late October. And because, near the end of December, the Dow averages rose above their late-October highs, both Schannep and Moroney believe that the Dow Theory is solidly in the bullish camp — notwithstanding where the Dow transports might be relative to their July high.”

Within this commentary is a revealing explanation as to the reason why we believe that Schannep and Moroney got it wrong, thereby issuing a bear market indication in August 2011 and a bull market indication in late December 2011.  In order to understand this, we must first point out a diagram of how Dow Theory reversals typically occur.

Plotting of Primary Reversal

Courtesy of Richard Russell’s Dow Theory Letters (www.dowtheoryletters.com), Figure 1a and Figure 1b show how the Industrials and Transports need to retest prior lows established at point A.  This retesting of the prior low would come after a medium-term rise at point B.  Once the market rests the prior low, the market would then need to exceed the medium-term high of point B.

With the diagram above, we can now see how Schannep and Moroney could have considered that a new bull market was in the making.  Once the market exceeded what they believed to be the POINT B in figure 1a and 1b, it then appeared to be a new bull market.  Unfortunately, while the Dow Industrials appeared to follow the script in Figure 1a, the Transports were far behind in providing a similar pattern of retesting the previous low.  This error led to an incorrect assessment of a new bull market.

Interestingly, Schannep and Moroney were inaccurate even in their call of a “bull market” using Dow Theory.  Based on the diagrams of figure 1, a new bull market should have been indicated in early October instead of late December.  In the chart below, it should be noted that the false bull market indication in October had much more to gain than the late December indication.  Worse still, only a month later, in February 2012, the Dow Transportation Average starts to diverge from the path of the Dow Jones Industrial Average.

2012 03 06 Dow Theory

The current divergence between the Industrials and Transports is a confirmation of the bear market trend.  Additionally, we expected that the Industrials and Transports are going to re-test the lows of 2011.  However, our suspicion is that both the Transports and Industrials will sink below the 2011 lows and possibly go strait to the 9,700 level on the Industrials.  The prospect remains that the bear market could potentially end if the Transports retest the lows of 2011 without falling significantly below.

As early as October 15, 2011 (article here), we indicated that the “…coming market volatility will provide great opportunities for traders and allow investors a chance to cash out of otherwise undesirable positions and take profits. Our expectation is that the Dow will go to the July 2011 highs before struggling at the May 2011 highs. Again, we’re still in a cyclical bear market until the Transports and Industrials exceed their respective 2011 highs.

We hope that our readers have benefitted from our advice to unload undesirable positions.

Best regards.

NLO Dividend Watch List: March 16, 2012

The $3 Billion Greek deal may have pushed some bulls back into the market. It was a volatile week but the market finished unchanged. The S&P was virtually flat but the blue chip lost 55 points for the week. There are some bargains to be had in our watch list this week which contains 11 companies that are within 11% of the 52-week low. A reminder to our readers, these are companies with a long track records of dividend payments.

Symbol Name Price % Yr Low P/E EPS (ttm) Dividend Yield Payout Ratio
TR Tootsie Roll Industries Inc  22.9 2.31% 30.95 0.74 0.32 1.40% 43%
CHRW C.H. Robinson Worldwide, Inc.  65.67 6.50% 25.06 2.62 1.32 2.01% 50%
ATO Atmos Energy Corp. 30.71 7.69% 13.90 2.21 1.38 4.49% 62%
CLX Clorox Co. 68.21 7.95% 16.64 4.1 2.40 3.52% 59%
CWT California Water Service 18.22 8.80% 20.24 0.9 0.63 3.46% 70%
UNS UniSource Energy Corporation 36.32 9.05% 13.21 2.75 1.72 4.74% 63%
PEP PepsiCo Inc. 64.47 10.27% 16.00 4.03 2.06 3.20% 51%
CAH Cardinal Health, Inc.  41.59 10.35% 15.40 2.7 0.86 2.07% 32%
8 Companies

Watch List Summary

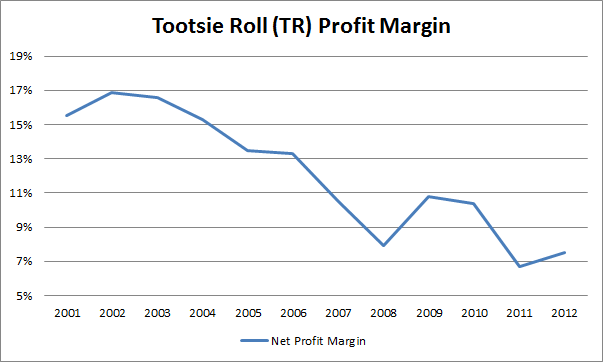
Topping our list this week is Tootsie Roll (TR). Based on the work we’ve done on this stock, we are becoming less convinced of the upside based on historical valuation. Using dividend yield theory, we see very limited upside. Our estimate is that TR's fair value is at $24. There are several factors that we are increasingly concern about regarding. One is the declining profit margin which has been shrinking since 2001 as our chart shown below. Second is the stagnant trend in dividend payments since 2009 (please note that they reward shareholders with 3% special dividend in the form of stock.) As for a cash payout, they have been returning 35% of their earning to investors. Alternatively, the board opts for a share buyback and which reduced the shares outstanding from 66 million shares to 55 million shares. This strategy helped offset the dilution from the 3% stock issuance. We have never a fan of share repurchase, though a recent letter from Warren Buffett stated the benefits of share repurchases.

image

Readers may have noticed that the largest part of our portfolio is in Tootsie Roll (TR). The rational for such action is that we are utilizing this stock as a cash holding. Our observation is that stocks that appear and continue to show up on our watch list have a good probability of being near the bottom rather than the top of their respective price range. As such, we believe the downside is limited but the upside may be equally as limited for the reasons stated above. Our action may reverse if conditions in the stock price change signficantly. For now we continue to view Tootsie Roll (TR) as a cash holding.

C.H. Robinson (CHRW), one of the largest 3rd party logistic companies, is second on our list this week. The stock has been hammered because of the recent rise in the oil prices and we believe this could be a great opportunity to start your research if you have always wanted to own a cyclical stock. Valueline estimates that CHRW trades at a fair value of 22x cash flow which suggests that the stock should be trading for $75. If you’ve read our recent review of the stock market, you will know that we are cautious because the Dow Jones Transportation Index has failed to test and exceed its July 2011 high.

If cyclical stock aren’t your cup of tea, there are three that fit the undervalued mark based on a dividend yield thesis. These companies are Clorox (CLX), PepsiCo (PEP), and Cardinal Health (CAH). The first two are great household names that are considered defensive according to Wall Street. Cardinal Health (CAH) manufactures and distributes generic drugs. On average, if these shares revert to their historical dividend yield, CAH should return somewhere between 10% to 15% in the coming year.

Top Five Performance Review

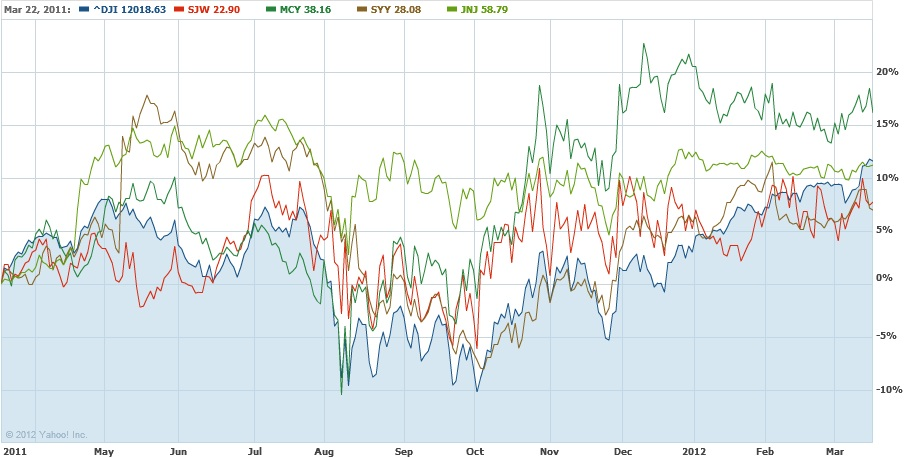
In our ongoing review of the NLO Dividend Watch List, we have taken the top five stocks on our list from March 18, 2011 (not published) and have check their performance one year later. The top five companies on that list can be seen in the table below.

Symbol Name 2011 Price 2012 Price % change
HGIC Harleysville Group Inc.  30.56 57.54 88.29%
SJW SJW Corp. 22.48 24.22 7.74%
MCY Mercury General Corp. 37.84 43.95 16.15%
SYY Sysco Corp. 27.7 29.63 6.97%
JNJ Johnson & Johnson  58.57 65.12 11.18%
Average 26.06%
DJI Dow Jones Industrial 11,858.52 13,232.62 11.59%
SPX S&P 500 1,279.21 1,404.17 9.77%

Companies on our watch list outperformed the market by a wide margin. The biggest driver was Harleysville (HGIC) which received a buyout bid from Nationwide Mutual Insurance.  However, when you exclude the gains of HGIC, our top five retained a respectable +10.51% gain.

Correction of Errors on iShares Silver Trust (SLV) Interpretation

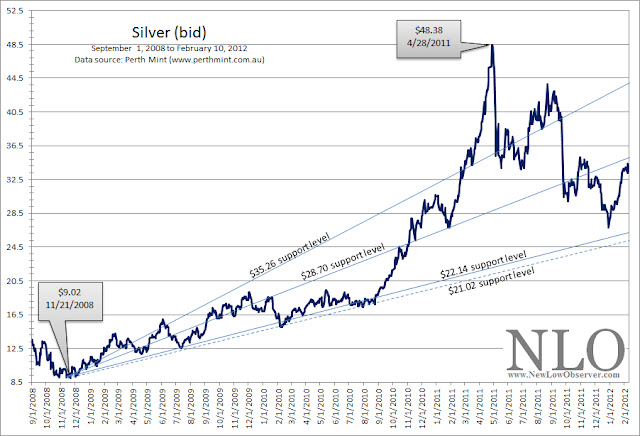
In our previous reviews of the iShares Silver Trust (SLV) (found here), we attempted to apply Dow Theory to the price movement of SLV. However, we have made an error in our analysis that has resulted in arriving at the wrong conclusion of the price potentially declining to the previous low that was established at the beginning of the bull market run on November 21, 2008 at $9.02.


Instead, we are revising our analysis to reflect that the price of silver may decline as low as $21.02 if it were to replicate the rise and decline from October 2001 to November 2008.This revision should provide a more qualitative view on the future prospects for both SLV and the price of silver.


As background to the error that was made, we first must explain that the iShares Silver Trust (SLV) is supposed to track the price of silver. However, SLV has only been in existence since April 2006.Our Dow Theory analysis of SLV was incorrect because we didn’t have an appropriate starting point, the previous low, to arrive at a correct downside target. The previous low occurred in 2001 which was long before SLV began trading.


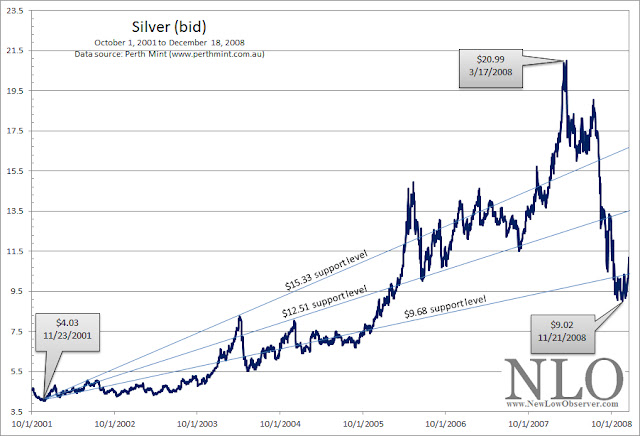
This resulted in the mistaken belief that SLV should be expected to go back to the low of 2008 at $9.02. To remedy our error, we have obtained the price of silver from the last major low in the price, and re-ran our Dow Theory analysis. The chart below provides the three downside targets from the March 17, 2008 high of $20.99.


The downside targets from the peak were as follows:
In the final outcome, the price of silver fell below the third downside target of $9.68, ultimately resting at the $9.02 level before making the ascent to the recent high of $48.35.This sets the stage for our analysis of the current price action.
Our current Dow Theory analysis involves the period from the November 21, 2008 low at $9.02 to the peak of April 28, 2011 at the $48.38 level. The downside targets are as follows:
It should be noticed in the chart below that as time passes, the support levels increase which exerts greater pressure on the price to either rise substantially or breakdown.


Despite the revision to our numbers, our previous analysis about the expected outcome has remained accurate.Our May 5, 2011 article was on target with the claim that SLV would trade in a range before falling much further. SLV traded in a range until mid-July and ultimately fell as low as $26.16, a drop of -30.87% since that article was written.
The current indications suggest that SLV will fall as the $22.14 support level. Because silver easily fell to the third support level in the period from 2001 to 2008 (within the context of a precious metal bull market), we expect that the $21.02 is a realistic worst case scenario to watch for. We will consider buying silver and related derivatives at $22.25 and below.
We view the most recent rise from the December 2011 low as running out of steam.Therefore, the rising resistance level established at $28.70 appears to be firmly in place…for now.

NLO Dividend Watch List: February 10, 2012

Despite the Euro debt fears, the market continued to churn higher.  The S&P 500 is coming close to testing its April 2011 high of 1363. The momentum in the market has pushed investors to move into the cyclical names. As such, you'll see many great household names on this week watch list. Below are 15 companies that are within 11% of the 52-week low.

February 10, 2012

Symbol Name Price % Yr Low P/E EPS (ttm) Dividend Yield Payout Ratio
CRR Carbo Ceramics 85.94 0.26% 15.29 5.62 0.96 1.12% 17%
CHRW C.H. Robinson Worldwide 63.5 1.93% 24.24 2.62 1.32 2.08% 50%
CCBG Capital City Bank Group 8.85 2.08% 30.52 0.29 0.40 4.52% 138%
TR Tootsie Roll Industries Inc 23.62 3.51% 32.81 0.72 0.32 1.35% 44%
CLX Clorox 67.75 7.44% 16.52 4.1 2.40 3.54% 59%
NFG National Fuel Gas 47.88 7.57% 15.35 3.12 1.42 2.97% 46%
JW-A John Wiley & Sons CL 'A' 45.39 8.36% 15.93 2.85 0.80 1.76% 28%
PEP PepsiCo 63.95 9.32% 16.03 3.99 2.06 3.22% 52%
T AT&T Inc 29.84 9.42% 45.21 0.66 1.76 5.90% 267%
BDX Becton, Dickinson and 76.42 9.81% 13.95 5.48 1.80 2.36% 33%
CWT California Water Service 18.29 9.85% 18.66 0.98 0.63 3.44% 64%
HNZ HJ Heinz 51.87 10.39% 17.52 2.96 1.92 3.70% 65%
ATO Atmos Energy Corp. 31.56 10.70% 13.90 2.27 1.38 4.37% 61%
KO Coca-Cola Co 67.94 10.85% 12.49 5.44 1.88 2.77% 35%
PG Procter & Gamble 63.88 10.98% 18.79 3.4 2.10 3.29% 62%
15 Companies

Watch List Summary

Topping our list this week is Carbo Ceramics (CRR) which is in a free fall. The manufacturer of ceramics used in hydraulic fracturing has been punished because of its ties to shale drilling. We suspect that some relief rally may be coming as CRR are heavily oversold. The historical dividend yield suggests that shares may be undervalued but further assessment should be made. Investors should have time for researching the stock since most dividend stocks typically do not make a "V shape" bottom.

Looking a bit further into the list you'll find many great household name such as Tootsie Roll (TR), Clorox (CLX), Pepsi (PEP), and AT&T (T). Investors craving income can get on average of a 3% yield from the entire list, three of which are Dow Jones Industrial components.

Top Five Performance Review

In our ongoing review of the NLO Dividend Watch List, we have taken the top five stocks on our list from February 11, 2011 and have check their performance one year later. The top five companies on that list can be seen in the table below.

Symbol Name 2011 Price 2012 Price % change
ABT Abbott Laboratories 45.56 55.11 20.96%
SYY Sysco Corp. 28.24 29.31 3.79%
PPL PP&L Corporation 24.75 28.45 14.95%
WABC Westamerica BanCorp. 51 46.63 -8.57%
MCY Mercury General Corp. 40.07 43.45 8.44%
      Average 7.91%
         
DJI Dow Jones Industrial 12,273.26 12,801.23 4.30%
SPX S&P 500 1,329.15 1,342.64 1.01%

Disclaimer
On our current list, we excluded companies that have no earnings. Stocks that appear on our watch lists are not recommendations to buy. Instead, they are the starting point for doing your research and determining the best company to buy. Ideally, a stock that is purchased from this list is done after a considerable decline in the price and extensive due diligence. We suggest that readers use the March 2009 low (or the companies' most distressed level in the last 2 years) as the downside projection for investing. Our view is to embrace the worse case scenario prior to investing. A minimum of 50% decline or the November 2008 to March 2009 low, whichever is lower, would fit that description. It is important to place these companies on your own watch list so that when the opportunity arises, you can purchase them with a greater margin of safety. It is our expectation that, at the most, only 1/3 of the companies that are part of our list will outperform the market over a one-year period
.

Diamond Foods and Speed Resistance Lines

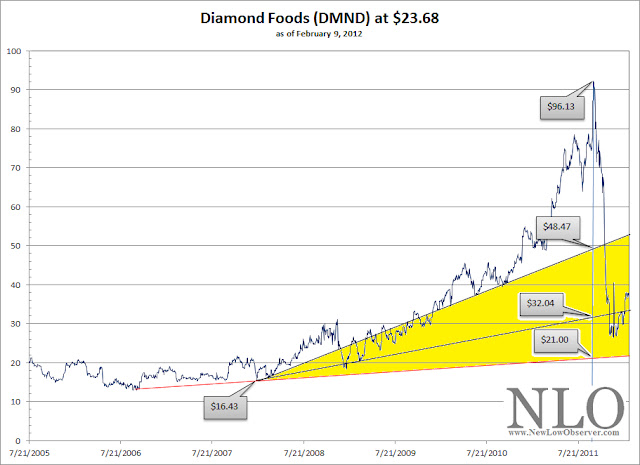
In retrospect, everything appears “oh so clear.”  We love history and attempt to interpret events from the past as a means to project into the future, assuming everything remains the same. Which is why the chart below seems so stunning to us.
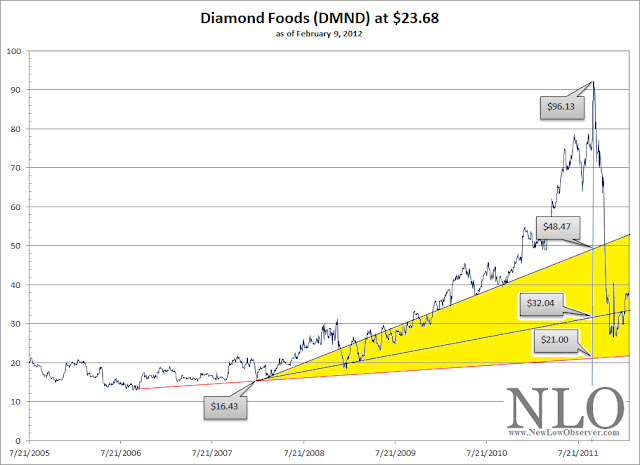
The above chart of Diamond Foods (DMND), which has recently been blown out the water due to some accounting “irregularities” and the dismissal of the CEO and CFO, demonstrates the seeming power of Edson Gould’s speed resistance lines (SRL).  First, notice that the high of DMND was at$96.13, the starting point for all analysis of SRLs.  Based on the high of $96.13, the conservative downside target would have been the $48.47 level.  At the same time, the extreme downside target would have been the $21.00 level with an intermediate downside target of $32.04.

Amazingly, every downside target has been met with DMND reaching as low as $21.44 , on an intraday low.  By the way, little mention has been made of the accounting firm that signed off on Diamond Foods spurious books.

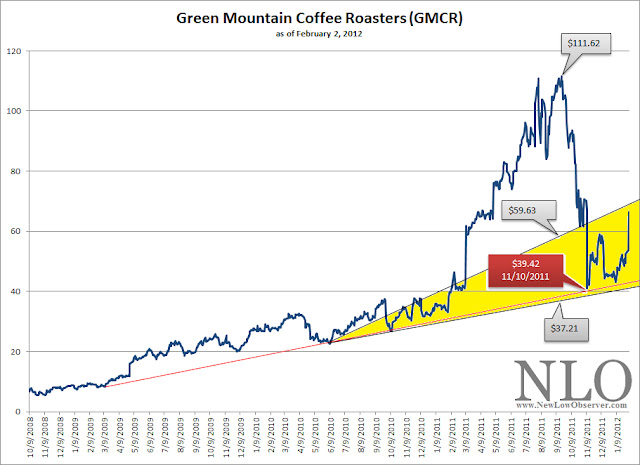
Already, in our prior work, we've seen a Netflix (NFLX) SRL, done in December 2010, give us an extreme downside target of $66.  Almost a year later, NFLX declined through the $66 level to fall to as low as $62.37 on November 30, 2011.  Another SRL that we ran before it came to fruition was Green Mountain Coffee Roasters(GMCR) on October25, 2011.  At the time, GMCR was trading at $64.75.  We estimated, using the SRL, that GMCR had an extreme downside target of $37.21.  The stock recently fell as low as $39.42 as reviewed in our February2, 2012 posting.

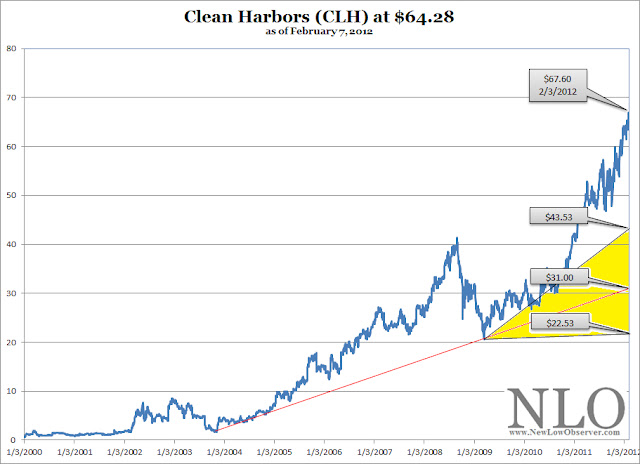
Below is the latest speed resistance lines for a stock that we've been curious about for some time, Clean Harbors (CLH).
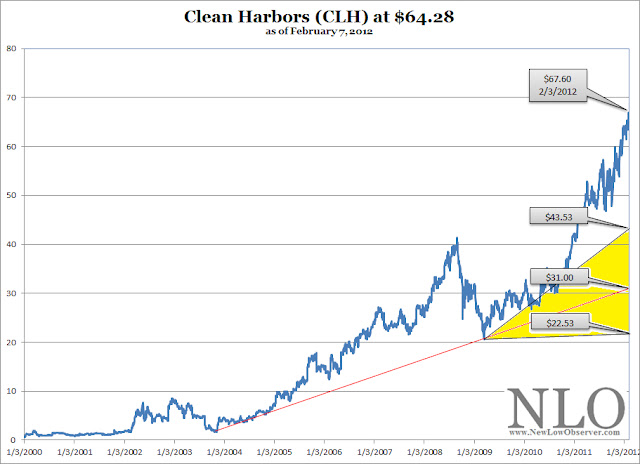
Some could reasonably argue that we’re allowing correlation to equal causation, which we’d gladly confess to.  However, this explains why we a reactively seeking companies which we can run Edson Gould’s SRLs beforehand to ensure some semblance of integrity in the concept.  We want to run this examination through as many companies as we can before the actual decline.

A word of warning, the fact that a stock reaches the extreme downside target does not necessarily mean that the stock or index is considered to be a “buy.” Nor does it suggest that the stock or index cannot fall further.  Instead, it only reflects what potentially could happen on the downside.  Additionally, SRLs do not suggest a time frame that a decline is expected to occur.

For the NLO team, speed resistance lines appeal to our sense of considering the worst case scenario, which has saved us a lot of money simply by avoiding situations that would create significant loss.  Using history to assist us in projecting the downside risk is the primary reason we started examining speed resistance lines.

More about SRLs here

Gold Stock Indicator Points Down

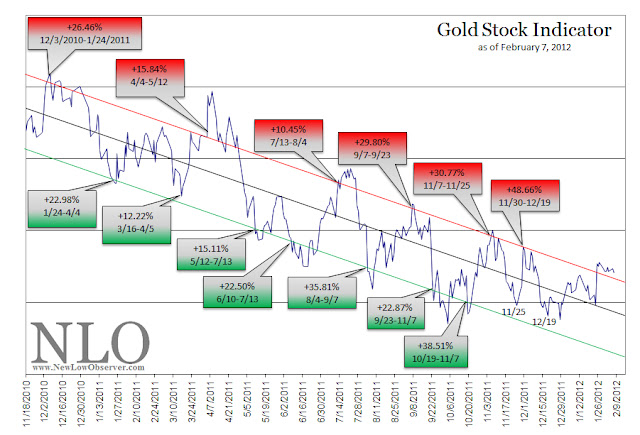
On November2, 2011, we posted an article titled “A Strategy is Needed for Lagging Gold Stocks.”  In that article we made reference to a Gold Stock Indicator that we’ve been using to determine the best times to buy and sell gold stocks.   Below is the same Gold Stock Indicator covering the period from November18, 2010 to February 7, 2012. 
In this example of the Gold Stock Indicator, we’ve provided the percentage change when the Direxion Daily Gold Miners Bear (DUST) [in red]and Direxion Daily Gold Miners Bull (NUGT) [in green] are bought and then sold when the Gold Stock Indicator has reached the opposite trend line.  In this example, the opposite of the NUGT trendline is the red trendline and vice versa. We’ve excluded the respective peaks and troughs in consideration of percentage change.  We only used the periods when the indicator first crossed the opposite trend line.
DUST and NUGT are ETFs that carry the highest risk of loss because they are intended to move at 3 times (3x) the NYSE Arca Gold Miners Index.  Therefore, DUST and NUGT are speculations and not investments.  Additionally,as the trend for the Gold Stock Indicator has been in a long declining phase,we expect that this pattern should reverse substantially at some point.  However, based on the current trajectory, we have May/June 2012 as our tentative reversal period.

In The News: February 5, 2012

MFGlobal Told S&P ‘Never Been Stronger’ as Failure Loomed at BusinessWeek
EverythingYou Know About Peak Oil Is Wrong at BusinessWeek
InsuranceCompanies Investing in Real Estate at Preqin
Fairholme’Brutal Year: Performance -32%, AUM Declines 70% at ValueWalk
CanYou Sum Up Your Investing Philosophy in 10 Words? at Wall Street Journal
‘We’reNo. 1,’ Says Suze Orman’s Newsletter Guru. Is He Right? at Wall StreetJournal
The Myth ofChoice: Personal Responsibility in a World of Limits at Yale UniversityPress
Lower-incomeHouseholds and the Auto Insurance Marketplace at Consumer Federation ofAmerica
Fleecingthe flock at The Economist
Investingfor the cheap-money era at MSN Money
IssuerRetaliation: The Case of Richard Bove at Grumpy Old Accountants
Apple Moves IntoTextbooks at Gonzo Econ
TARPComponent Closes, Returns Tiny Profit for Taxpayers at Yahoo! Finance
WillAmazon Kill Publishing? at The Atlantic
WillFacebook Mark the Market Top? at Diary of A Mad Hedge Fund Trader
TheGreat Stock Switch of 2012 at Wall Street Journal
PolarisIndustries Announces 64% Increase in Cash Dividend for 2012 at PressRelease
WhyBuying on the Dips Isn't All It's Cracked Up to Be at Wall Street Journal

Dow Theory: Non-Confirmation

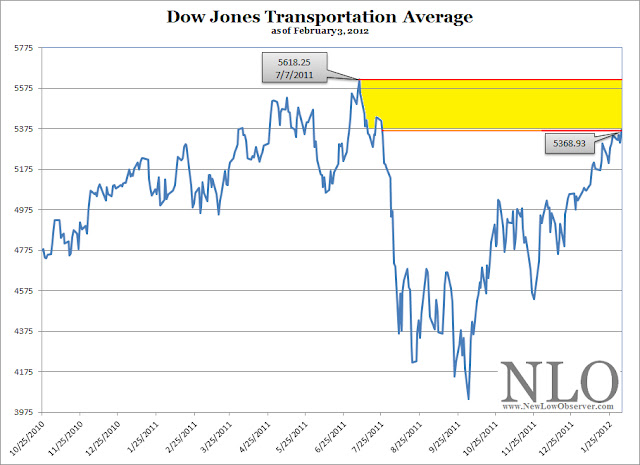
On February 3, 2012, the Dow Industrial Average made a new all time high since the low of March 2009.  All that is needed in order to achieve a confirmation of the upward trend is for the Dow Jones Transportation Average to exceed the July 7, 2011 high of 5,618.25.
There is a marginal difference of 4.64% between the Dow Transports high and the current level.  We're anxiously waiting to see if this gap can be closed with conviction in a relatively short period of time.  So far, every day that the Dow Industrials makes a new high with the Dow Transports below the previous high is considered a Dow Theory non-confirmation which reinforces the bear market thesis.

Green Mountain Coffee Roasters and Speed Resistance Lines

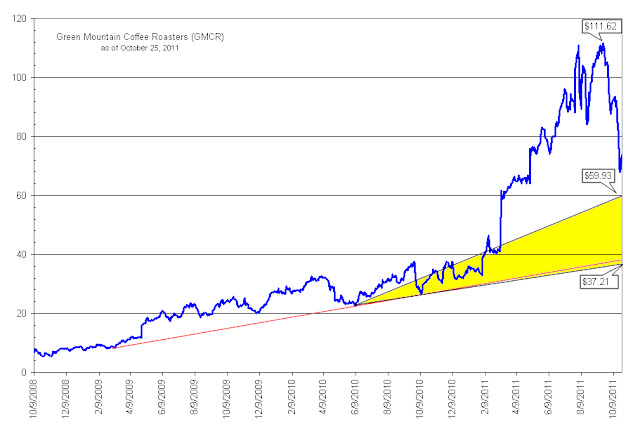
On October 25, 2011, we posted a speed resistance line for Green Mountain CoffeeRoasters (GMCR).  At that time, we proposed,based on Edson Gould’s work, that the conservative downside target was $59.93while the extreme downside target was $37.21.
 

Sixteen days later, on an intraday basis, GMCR fell as low as$39.42.  This was within 6% of the targetedextreme low of $37.21. In this example, we’re satisfied that Edson Gould’s speed resistance line has met our expectations.

Dow Theory: Non-Confirmation Looms

Review

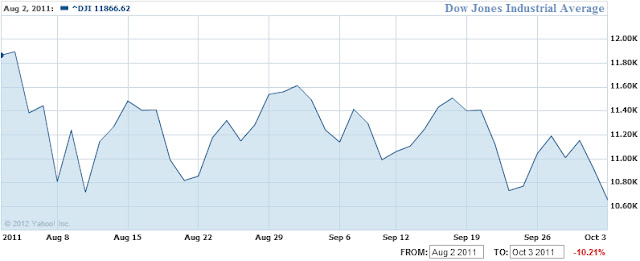
·        On August2, 2011, Dow Theory indicated that the market was headed lower.  At that time we posted an article to indicatethat the bull market run from March 9, 2009 was over.
·        OnAugust 8, 2011, all indications were that the stock market had reached a pointwhere we could estimate the upside targets or bear market rally targets.  On August9, 2011, we said the bottom had been established and that the direction washigher.  We missed the actual marketbottom by 1.42%.  We also indicated thata renewed bull market could not be considered until the old highs, set in 2011,were exceeded.
·      On October15, 2011, we said that “…the indexeswill at least rise to the July highs [DJI-12,724/DJT-5,618] and maybe even the April 2011 highs [DJI-12,807/DJT-5,527].” With this in mind we said, “The coming market volatility will providegreat opportunities for traders and allow investors a chance to cash out ofotherwise undesirable positions and take profits. 
Dow Theory: February1, 2012
Today’smarket activity has the Dow Jones Industrial Average trading as high as 12,784.62and the Dow Jones Transportation Average trading as high as 5,374.81.  While the Dow Industrials are knocking on thedoor of the July 2011 high of 12,807, the Dow Transports appear to be far fromconfirming the generally bullish market direction.  However, keep in mind that the Transportstypically jump by a greater percentage day-to-day than the Industrials so itwould not be unexpected to see the Transports potentially give a bullishconfirmation from its current level.
Leavingaside the prospect that the Industrials and Transports may give a Dow Theorybull market signal, we’re still in a bear market.  Also, we have our reservations about arenewed bull market indication, when and if it comes.  After all, the Transportation Index havetypically led the way in terms of where the general market is headed.
Throughoutthe bull market run from March 9, 2009 until August 2, 2011, the TransportationAverage continually led the market higher and refused to confirm on thedownside.  Now that we’re currently in abear market, our view is best represented in the quote from our April6, 2011 comment, “what we see fromthe Transports on the way up we may also see on the way down.
Combinedwith the fact that we are already in a bear market and potentially faced withthe downside pressure of the second half of a 4-year cycle as indicated in our January10, 2012 posting and you’ve got the recipe for a classic Dow Theorynon-confirmation of a bull market.
ThePunchline: Be on the lookout for the Dow Industrials (12,807.51) and DowTransports (5,618.25) to jointly exceed their 2011 highs.  If either index cannot go above theirrespective 2011 high, then we have to assume that the bear market still rules.  If a bear market rules, from such aprecarious height, then it would be worth re-considering any new investments atthis time.

Apple (AAPL) and Speed Resistance Lines

As describedin our article on speed resistance lines (SRL) dated September 22, 2011 (found here), Netflix (NFLX) fell below our projecteddownside target of $99.58. Although we thought that the stock would be worthconsidering below such a level, we had to concede that, “...the difficulty may be that thesentiment that pushed the stock price to $298.73 would likely be just theopposite to push the price down.” Assuming the purchase of thestock at $99.58, an investor would have gained 21.10% based on the currentprice of $120.59.
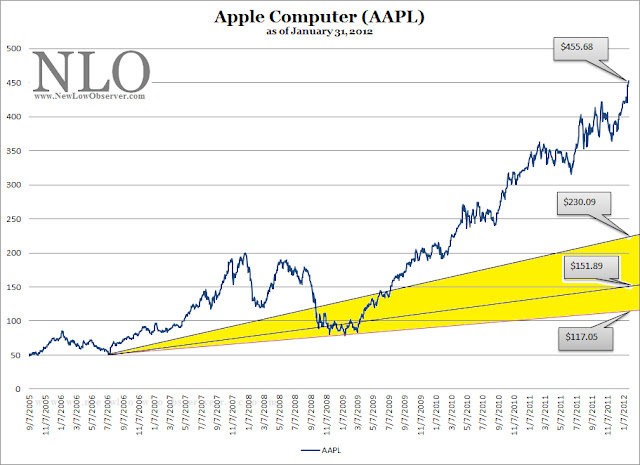
Naturally, wewondered what Edson Gould’s speed resistance lines would say about AppleComputer (AAPL). The very first thing that we look for, to determine speedresistance lines, is the most recent peak in the price.  Because AAPL is continually making new highs,we only need to use the latest price of $455.68 as our starting point.

Based onGould’s work, Apple (AAPL) has a conservative downside target of $230.09 and theextreme downside target is $151.89.  Whenwe ran the same calculations on Netflix (NFLX) in September 2011, we made aseemingly innocuous error.  We overlookedthe fact that NFLX had a lower support line (red line) at the price level of $85.  In this case, we have denoted AAPL’s supportline (also in red line), at $117.05, as a potential downside target for thestock.
As the priceof Apple increases, so too does the SRL lines based on the work ofEdson Gould.  The rampant enthusiasm for AAPLsuggests that the stock isn’t likely to decline to the indicated levels anytime soon.  However, when and if you seeAAPL start to make a swan dive, the levels indicated are reasonable downside targets.

Insurance Watch List: January 27, 2012

The following is one of our personal favorite watch lists.  We started tracking the insurance industry in January 2011 and we're very impressed with the results so far. 
Anyone who wishes to be successful in insurance stocks should read the book The Davis Dynasty by John Rothchild.  The book starts with Shelby Collum Davis investing approximately $50,000 to $100,000 that ultimately grew to $900 million after 47 years.  The strategies employed by Davis seem more accessible to average investors as opposed to Warren Buffett's leveraged strategies and education from Benjamin Graham.


NamePriceP/EEPSYieldP/Bpayout ratio% from Low
Alleghany Corp.288.0518.0715.9400.880.00%3.98%
National Western Life Insurance143.27.2819.660.30%0.41.83%10.15%
American National Insurance72.6411.296.444.20%0.5347.83%10.55%
Tower Group, Inc.21.9110.82.033.40%0.8536.95%10.77%
HCC Insurance Holdings, Inc.27.9411.562.422.20%0.9325.62%13.30%
Loews Corp.37.6312.253.070.70%0.798.14%14.38%
XL Group plc20.328.190.722.20%0.6761.11%14.75%
Kansas City Life Insurance32.3613.62.383.30%0.5145.38%15.53%
Sun Life Financial20.1413.631.486.90%0.8293.24%15.75%
Everest Re Group85.1525.563.332.30%0.7657.66%16.09%
Unum Group22.928.012.861.80%0.7114.69%16.23%
Endurance Specialty Holdings37.0870.760.523.20%0.58230.77%17.08%
Willis Group Holdings38.7324.421.592.70%2.5165.41%17.22%
Hanover Insurance Group36.6935.871.023.30%0.67117.65%18.35%

Symbol
Y NWLI ANAT TWGP HCC L XL KCLI SLF RE UNM ENH WSH THG
Watch List Summary
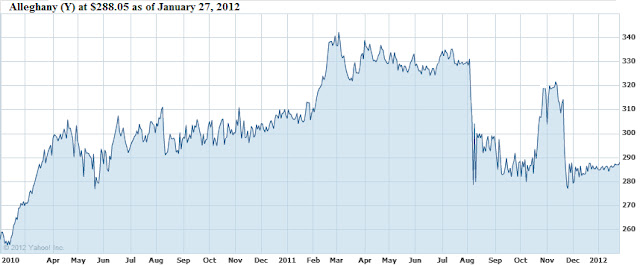
Alleghany Corp. (Y) appears to be an exceptional investment opportunity.  First and foremost, Alleghany Corp. has emerged as the suitor of our current holding of Transatlantic Holdings (TRH).  Even Warren Buffett was turned down by Transatlantic holdings after he lobbed a lowball offer for TRH.  Despite this fact, Alleghany is acquiring Transatlantic Holdings at a price nearly 10% below book value.  This alone suggests that Alleghany has an eye values.   We've been adamant that Transatlantic Holdings was a great value (found here) and is trading 8% below the offer price of $59.79.
The Punchline: Being within 4% of the 52-week low and 12% below book value, Alleghany (Y) is definitely a long-term buying opportunity at $288.  We'd make Alleghany a two part acquisition that comprises 15% of the portfolio when completed.  Keep in mind that the stock has a downside target of $266 based on Dow Theory.

In the News: January 28, 2012

High-TechEmployee AntiTrust Litigation (PDF) at Lieff, Cabraser, Heimann & Bernstein,LLP
Apple,Google Must Face Antitrust Lawsuit Over Tech Employee-Poaching Ban atBloomberg
FormerGroupon sales reps countersue over tactics at Reuters
WhatMakes FPA Crescent Tick? at Morningstar
Olympuspanel clears accounting firms of blame in scandal at Reuters
TheFannie and Freddie Chronicles, Cont. at Barron’s
PaulsonDigs Deep Hole, Needs Big Returns To Recoup Losses at Barron’s
Digitalmusic sales top physical sales at CNNMoney
Milkfutures: Better than gold at CNNMoney
FHAsays: It's ok to flip that house at CNNMoney
Yourcell phone is out of your control at CNNMoney
Gold,Silver Move Towards 3-4% Weekly Gains; Time To Sell Miners? at Barron’s
GoldETF almost a sell at MarketWatch
What'sbehind Netflix's 22% spike? at CNNMoney
Is the ETFbubble about to burst? At CNNMoney
GoldIs The Hottest Currency In The World at Forbes
BePrepared To Sell Your Soul If You Use Google at Forbes
MerrillLynch Hit With $1 Million Fine For Employee Note Collections at Forbes
The Big401(k) Match Mistake at Forbes
ThePitfalls Of Variable Annuities at Forbes
FacingSEC Charges, Ex-Fannie Chief Daniel Mudd Resigns At Fortress at Forbes
Whathappens when you walk away from your home? at Reuters
Questioningthe Volcker Rule at The Atlantic

Thoughts on Gold

A reader says:
“There's a reason Gold is the hottest in the world.Investors are simply losing faith in ALL fiat currencies. Hence, they areturning to one thing that has always been real money - GOLD!”
Our Take:
We don’t know about the far distant future of gold,governments and profligate spending. However, we've always enjoyed a historical perspective on the topic of “realmoney.”  We’ve pulled a few quotes fromRichard Russell’s Dow Theory Letterson the topic of “real money” in the same vein as described above.
The US is on a treadmill to disaster via the creation ofdebt. In time (and the time is moving very rapidly now) the debt will destroyalmost ALL forms of investments. Gold will withstand the destruction, becausereal money is never destroyed.” 
Dow TheoryLetters.  Issue 736. August 7, 1978. Page5.
Coming up in a month, a year, a few years (I can’t time it)is the BIG PROBLEM, the problem that I’ve warned about for a long time. How doyou get people to hold paper “money” when they have increasing doubts about itsworth? The answer: you must make it CONVERTIBLE into real money-gold.”
Dow TheoryLetters.  Issue 766. September 26, 1979. Page1.
My job now seems to be to try to save my subscribers fromthe deceitfulness and greediness of our own Government. So I talk about thetechnical position of gold, of where WC are, of whether gold is still a buy andwhether it will take 900 or 1000 paper dollars to buy an ounce of real moneysay six months or maybe even three months from now." 
Dow Theory Letters.  Issue 774. January 16, 1980. Page 7.
‘How can the Government ever be bankrupt if it is able to createmoney?’ The answer is that the Government could only be bankrupt if no onewould accept that money. And of course, that possibility is the reason why manysurvivalists will ‘never be without some kind of a position in real money -gold.’” 
Dow Theory Letters. Issue 805.March 25, 1981. Page 3.
Why could gold be bullish? Two opposing reasons: first,with a potential crisis in the world monetary system, people turn to real moneyas an insurance policy. Gold is real money. Second. With unbearable deficits facingthe US over coming years, politicians will be tempted to ‘print’ (monetize)some of those deficits (and suppose Edward Kennedy gets in in ‘84).
Dow TheoryLetters. Issue 841. August 11, 1982. Page 6.
Now, we’re not suggesting that the ultimate consequence ofprofligate spending isn’t coming.  Additionally,we’ve made a call for a secular bull market (as opposed to a cyclical bullmarket) in gold on September28, 2010 and silver on September5, 2009 .  However, much of thearguments during and after the peak in the price of gold are the same as today. 
Additionally, nothing has changed that was said about profligatespending at the peak in the price of gold in 1980 or the period from 1981 to1999, a time when the price of gold was in a declining trend.  Therefore, we have little to help us distinguish the difference between huge government spending when gold is rising and when gold is falling.  We're sticking to the view that Dewey and Dakins' assertion that gold vacillates in a 50 to 54-year cycle is right on target (our 2009 review of their work here). 


We’re opting for the view that goldexperiences good times and bad rather than the view that our nation is comingto an end.  After all, the redemption ofour gold, as with all forms of insurance, is not something that we look forwardto.