Author Archives: nlo-admin

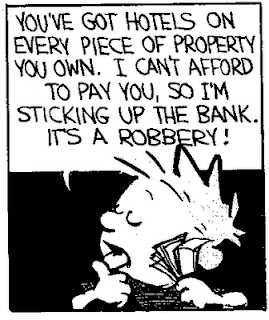
Source: Watterson, Bill. The Calvin and Hobbes Lazy Sunday Book. Universal Press Syndicate/Andrews and McMeel. 1989. page 49.

Nasdaq 100 Watch List

Below are the Nasdaq 100 companies that are within 15% of their respective 52-week lows. Stocks that appear on our watch lists are not recommendations to buy. Instead, they are the starting point for doing your research and determining the best company to buy. Ideally, a stock that is purchased from this list is done after a considerable decline in the price and rigorous due diligence.
Symbol Name Price P/E EPS Yield P/B % from Yr Low
BMC BMC Software, Inc. 34.01 13.93 2.44 N/A 3.74 7.56%
DTV DIRECTV 43.03 13.41 3.21 N/A N/A 8.06%
CHRW C.H. Robinson Worldwide, Inc. 67.66 26.33 2.57 2.00% 8.92 8.60%
NTAP NetApp, Inc. 36.85 22.46 1.64 N/A 3.54 11.67%
SYMC Symantec Corporation 16.79 19.1 0.88 N/A 2.69 12.38%
INFY Infosys Limited 52.29 18.09 2.89 1.10% 5.03 13.38%
EXPE Expedia, Inc. 31.04 9.21 3.37 3.60% 1.59 13.78%
VOD Vodafone Group Plc 27.76 13.16 2.11 3.60% 1.07 14.19%
WYNN Wynn Resorts, Limited 115.47 26.95 4.28 1.80% 5.66 14.30%
Watch List Summary
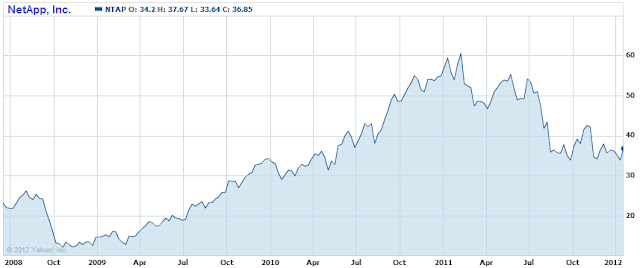
NetApp (NTAP) has fallen 39.61% from the high of $61.02 on February 11, 2011.  The low of October 2009 acts as a significant downside support since it is aligned with the long rising trendline from the 2002 low. According to Dow Theory, the current downside targets are $28.02, $22.52 and $17.02. Based on the current price of $36.85, NTAP could fall by 53% in the worst case scenario. According to Dow Theory, NTAP has  upside targets of $44.52, $50.02 and $55.52.
The Punchline: After a 39% decline in price, NetApp (NTAP) is a prime candidate for a two transaction  purchase.  The first purchase should take place starting at $30.  The second purchase should take place around $23.47.  Based on the market capitalization of NTAP may actually be a buyout candidate.
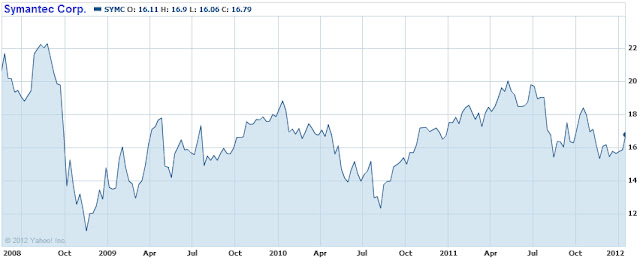
Symantec (SYMC) has declined by 19.07% from the high set on May 12, 2011.  Dow Theory ascribes downside targets of $15.08, $14.91 and $13.30.  When considering the worst case scenarios, SYMC has a downside risk of either -25.62% if the stock falls to the 2010 low of $12.34 or -39.42% at the 2009 low. Both cases  present reasonable risk/reward scenarios. The upside target is $18.67.
The Punchline:  SYMC seems like an opportune purchase for reasonable gains over next year. Consideration of a single purchase with a larger percentage of the portfolio is most ideal.  A sort of "one-and-done" with the acceptance of the downside risk of -40% is in order for SYMC.
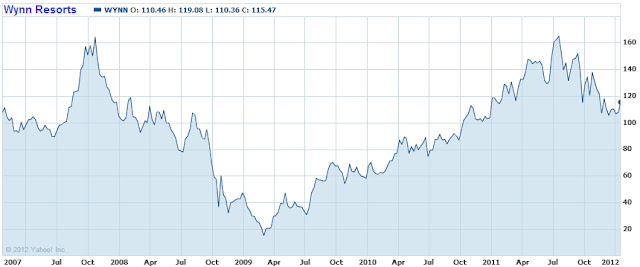
Wynn Resorts (WYNN) has extreme downside risk. Based on Dow Theory, WYNN has just fallen below the first of three support levels at $115.47.  The next downside target, based on the Dow Theory 50% principle is $74.76 which is 35% below the current price. Our expectation is that WYNN has a high probability of falling to $74 with $64 and $40 as reasonable downside targets.
 The Punchline: The volatility profile for WYNN is only for those willing to accept extreme downside risk. "Investors" in WYNN should break their transaction up into at least 3 trades.
Watch List Performance Review
In our ongoing review of the Nasdaq 100 Watch List, we have taken the stocks from our list of January 23, 2011, based on the closing price of January 21, 2011(found here), and have checked their performance one year later. The companies on that list are provided below with the closing prices from January 21, 2011 to December 20, 2012.
Symbol Name 2011 2012 % change
CEPH Cephalon, Inc. 59.64 81.5 36.65%
CSCO Cisco Systems, Inc. 20.73 19.92 -3.91%
QGEN Qiagen N.V. 18.56 15.42 -16.92%
TEVA Teva Pharmaceutical  52.86 45.83 -13.30%
ATVI Activision Blizzard, Inc 11.25 12.22 8.62%
average 2.23%
Nasdaq 100 2268.32 2437.02 7.44%
 The Watch List from last year underperformed the Nasdaq 100 by a wide margin.  Only Cephalon (CEPH) and Activision (ATVI) were able to keep pace with the index.  Teva Pharmaceutical (TEVA) and Qiagen (QGEN) took the large hit among the top five stocks.

The Time Has Come For California Water Services (CWT)

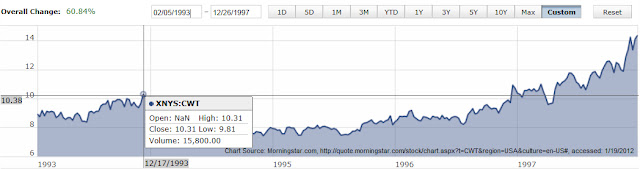
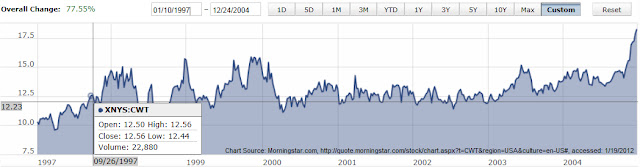
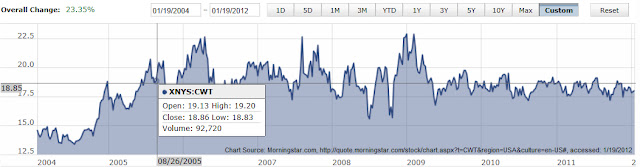
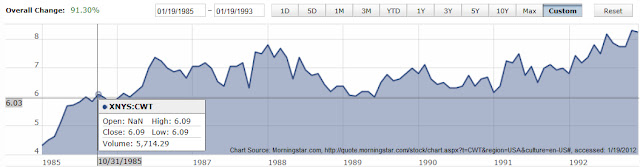
CaliforniaWater Services Group (CWT) has finally arrived at the point that we’veanticipated for the last 2 years.  OnJanuary 3, 2010, we submitted an investment observation that CWT would continueto trade in an established 6-year range that had been identified for at least4 other periods.  Just as a debrief, inthe 2010 piece (found here), we said the following periods traded in 6-year ranges afterbreaking out of the previous range:
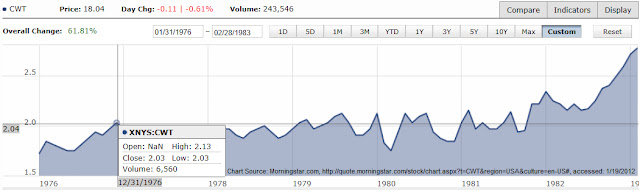
  • 1976to 1982

  • 1985to 1993

  • 1993to 1997

  • 1997to 2004

  • 2005to 2011

In a January 1,2011 piece (found here), we reiterated our view on CWT by saying the following:
“…based oncycle analysis, the prospects of CWT making a substantial move above the priorhigh would be between 2011 and 2012.”
As we enter2012, we’re of the view that this is the year that California Water ServicesGroup will break above the 2006 and 2009 highs of $23.  Those interested in buying this stock shouldacquire large quantities and be prepared for the downside risk.  We are reiterating our downside targets at:
  • $17.28
  • $13.70
  • $10.52
Finally, a boilerplatedisclaimer that should be considered for any water utility stock.  Although water is critical to life, stock investorsneed to understand that companies in the water industry aren't a "surething." The biggest reason for this is that when and if water becomes “scarce,”government regulators will step in to take over (nationalize) what shouldotherwise be sold at the most profitable price (thereby curbing wastefulconsumption.) There is literally an upside cap on profitability to a companylike this due to the critical importance of the resource being sold.
Additionally,CWT should be considered a relatively risky stock because of its low dailytrading volume. With a 3-month average volume of 220,000 shares, this stock maynot be suitable for investors who are concerned about getting the "best" price.  However, collecting the current dividend yield of 3.40% should provide some consolation for the wait to rise above $23 in 2012.

2011 Performance Review

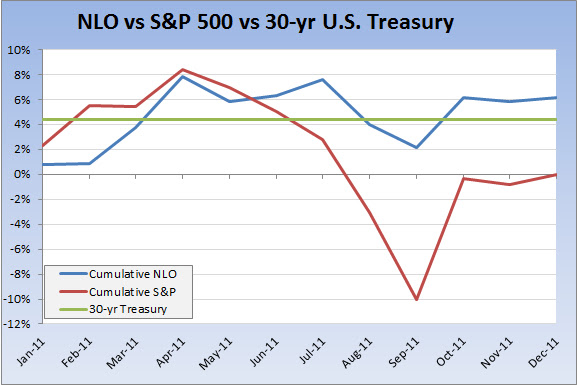
Below is a charting of howour investment portfolio performed against the S&P 500 index and the30-year Treasury based on the January 3, 2011 rate (foundhere).
As with our 2010 performance (foundhere), the 2011 portfolio experienced far less volatility than the S&P500 Index and did not fall into negative territory throughout the year.  Our end of year return was +6.20% compared tothe S&P 500’s no change for 2011.   We continue to lean on holding high levels ofour funds in cash.  Our average cash holdingsthroughout 2011 was 42.41% , based on end of month figures.
Our new target rate for 2012 is set at a mind-numbing low of2.98%, based on the January 3, 2012 30-year Treasury rate (foundhere).  Below is the annualperformance of our portfolio since the end of 2005:

Year Dow S&P 500 Nasdaq NLO Portfolio
2006 16.29% 15.74% 9.52% 18.30%
2007 6.43% 5.46% 9.81% 19.80%
2008 -33.84% -37.22% -40.54% 14.35%
2009 18.82% 27.11% 43.89% 36.65%
2010 11.02% 14.32% 16.91% 7.14%
2011 5.53% 0.00% -1.80% 6.20%

NLO Dividend Watch List: January 13, 2012

We begin the year with an impressive move upward in the S&P 500 index. Two weeks have passed and the market has gained 2.5% despite the financial trouble that continues to brew in the Europe. Our 2012 dividend list has 25 companies that are within 11% of the 52-week low.

January 13, 2012

Symbol Name Price % Yr Low P/E EPS (ttm) Dividend Yield Payout Ratio
TR Tootsie Roll Industries Inc  23.63 3.55% 32.82 0.72 0.32 1.35% 44%
BCR CR Bard, Inc. 85.45 5.75% 21.97 3.89 0.76 0.89% 20%
JW-A John Wiley & Sons Inc. 44.59 6.45% 15.65 2.85 0.80 1.79% 28%
CHRW C.H. Robinson Worldwide  66.73 7.11% 25.96 2.57 1.32 1.98% 51%
WAG Walgreen Co. 32.63 7.55% 11.02 2.96 0.90 2.76% 30%
BDX Becton, Dickinson and Co. 74.91 7.64% 13.33 5.62 1.80 2.40% 32%
CWT California Water Service 17.94 7.75% 18.31 0.98 0.62 3.46% 63%
WST West Pharmaceutical 38.29 7.86% 21.15 1.81 0.72 1.88% 40%
OMI Owens & Minor, Inc. 27.96 8.08% 15.71 1.78 0.80 2.86% 45%
ANAT American National Insurance 71.06 8.14% 11.03 6.44 3.08 4.33% 48%
CLX Clorox Co. 68.03 8.38% 19.61 3.47 2.40 3.53% 69%
AVP Avon Products, Inc. 17.52 8.89% 10.31 1.70 0.92 5.25% 54%
MATW Matthews International Corp.  31.19 9.17% 12.68 2.46 0.36 1.15% 15%
KO Coca-Cola Co 66.99 9.30% 12.31 5.44 1.88 2.81% 35%
AROW Arrow Financial Corp.  23.58 9.67% 12.75 1.85 1.00 4.24% 54%
BMO Bank of Montreal 56.92 9.82% 11.07 5.14 2.73 4.80% 53%
BMS Bemis Co Inc 29.89 9.85% 15.02 1.99 0.96 3.21% 48%
CAH Cardinal Health, Inc.   41.25 9.91% 16.11 2.56 0.86 2.08% 34%
TGT Target Corp. 49.82 10.03% 11.59 4.30 1.20 2.41% 28%
PEP PepsiCo Inc. 64.4 10.09% 16.14 3.99 2.06 3.20% 52%
WTR Aqua America Inc 21.26 10.27% 21.47 0.99 0.66 3.10% 67%
T AT&T Inc 30.07 10.55% 15.26 1.97 1.76 5.85% 89%
SJW SJW Corp. 23.11 10.73% 19.42 1.19 0.69 2.99% 58%
NFG National Fuel Gas Co. 49.35 10.87% 15.97 3.09 1.42 2.88% 46%
CATO Cato Corp. 23.98 10.97% 10.90 2.20 0.92 3.84% 42%
25 Companies


Not much movement has occurred since our last watch list on December 23, 2011.

Top Five Performance Review

In our ongoing review of the NLO Dividend Watch List, we have taken the top five stocks on our list from January 14, 2011 and have check their performance one year later. The top five companies on that list can be seen in the table below.

Symbol Name 2010 Price 2011 Price % change
ABT Abbott Laboratories 46.89 55.43 18.21%
CL Colgate-Palmolive Co. 78.31 88.52 13.04%
CLX Clorox Co. 63.98 68.03 6.33%
LLY Eli Lilly & Co. 34.91 39.94 14.41%
KMB Kimberly-Clark Corp. 63.64 72.7 14.24%


Average 13.25%


DJI Dow Jones Industrial 11,787.38 12,422.06 5.38%
SPX S&P 500 1,293.24 1,289.09 -0.32%

Disclaimer

On our current list, we excluded companies that have no earnings. Stocks that appear on our watch lists are not recommendations to buy. Instead, they are the starting point for doing your research and determining the best company to buy. Ideally, a stock that is purchased from this list is done after a considerable decline in the price and extensive due diligence. We suggest that readers use the March 2009 low (or the companies' most distressed level in the last 2 years) as the downside projection for investing. Our view is to embrace the worse case scenario prior to investing. A minimum of 50% decline or the November 2008 to March 2009 low, whichever is lower, would fit that description. It is important to place these companies on your own watch list so that when the opportunity arises, you can purchase them with a greater margin of safety. It is our expectation that, at the most, only 1/3 of the companies that are part of our list will outperform the market over a one-year period.


Please consider donating to the New Low Observer. Thank you.

4-Year Cycle Update

On June14, 2010, we wrote an article titled “AMarket Cycle Worth Observing.”  Inthat article, we proposed that there was significant validity in the beliefthat the stock market ebbs and flows in a 4 to 4 ½ year cycle.
In aneffort to make our point, we provided examples from Charles H. Dow, co-founderof the Wall Street Journal, and Richard Russell editor of the Dow Theory  Letters (www.dowtheoryletters.com).  The examples were drawn from the late 19thand 20th century.  The purposeof connecting such disparate periods was to show that regardless of the changein times, some attributes of the stock market remain intact.
In ourclosing paragraph on the 4-year cycle we said the following:
“If my observations on thistopic are correct, then we have at least until January 2011 to June 2011 beforethe half cycle is complete. Afterwards, the market would either trade in arange or establish a well-defined bottom in accordance with the 4 to 4 ½ yearmarket cycle.”
Ourarticle of June 14, 2010 came after an -11% decline in the Dow Jones IndustrialAverage.  Subsequent market action led tothe Dow Jones Industrial Average rising +25.71%.  Coincidentally, the Dow Industrials peaked onApril 29, 2011 at 12,810.54 with two failed attempts at reaching new highs inJuly 2011.
Because we’rewithin 9 months of the second half of the 4-year cycle, we believe that thereis approximately another year to go of the stock market continuing to trade ina range or reaching an ultimate low.  
For themarket to trade in a range we expect that the Dow Jones Industrial Average doesnot exceed the high of 12.810.54 by more than 10% while not falling below10,655.30.  If both the Dow Industrialsand Dow Transports exceed their respective highs we would view such action as anew cyclical bull market.  Our downsidetarget for an ultimate low on the Dow Jones Industrial Average is tentativelyset at 8,540.36.
Althoughgiving our prognostication one year in advance (as indicated in an April 2010posting below), we were off by only one month for the last peak in the market. Furthermore, the evidence suggests that the 4-year cycle is still inplay.  We feel that an appropriateinvesting strategy can be constructed around this concept.  If investing in stocks is a must, then we’drecommend considering the relatively undervalued current and former dividendincreasing stocks from our latest dividend list below.
Symbol
Name
Price
P/E
EPS
% Yield
Price/Book
% from Low
Tootsie Roll
23.77
32.82
0.72
1.40
2.03
4.12%
C.R. Bard, Inc.
85.81
22.05
3.89
0.90
3.96
6.14%
Becton, Dickinson
74.24
13.22
5.62
2.50
3.26
6.70%
John Wiley & Sons
44.77
15.7
2.85
1.80
2.66
6.88%
California Water Service
17.83
18.29
0.98
3.40
1.64
7.09%
Owens & Minor
27.8
15.61
1.78
2.90
1.93
7.46%
Clorox Company
67.76
19.54
3.47
3.60
-116.98
8.64%
West Pharmaceutical
38.55
21.28
1.81
1.90
1.85
8.73%
Frisch's Restaurants
20.27
22.93
0.88
3.30
0.8
9.92%

Crime and Punishment

The state of our financial markets rests firmly on its credibility.  However, it would not be surprising if few individual investors felt that there was no credibility in the current system.  A perfect example is the recent case of MF Global.  MF Global isn’t just a firm that was poorly managed, it also had the misfortune of “not properly segregating client’s accounts.”  This means that MF Global mixed their customers money with the firm’s money.

It turns out that MF Global was betting big on European debt at the same time the European debt was imploding.  As MF Global files for bankruptcy, a sizable portion of customer funds has gone unaccounted for.  However unlikely it may be, the regulators and those in charge of MF Global should be severely reprimanded.

As further proof of the problem we’re faced with, the recent fine levied by the Accountancy& Actuarial Discipline Board, in London, against PricewaterhouseCoopers(PwC) goes a long way to explain how MF Global and many other investment firms manage to violated seemingly simple rules. PwC was fined $2.17 million for not “…properly segregating an average of$8.6 billion of client funds” as reported by Bloomberg News (article here).

To put this fine into perspective, $2.17 million is 0.03% (3/100ths of 1%) of $8.6 billion.  Imagine if the penalty for robbing a bank of one million dollars was $300.  There would definitely be much more bank robberies if this were the case.  The current maximum penalty for robbing a bank is $250,000 and 20 years in prison. Based on this penalty, the robbers would have to try getting away with a minimum of $833 million before such action seems “feasible.”

Regardless of the amount stolen and depending on the circumstances, convicted bank robbers could easily face the maximum penalties of $250,000 and 20 years in prison.  Although there is no accounting for the logic of bank robbers, there appears to be plenty of logic for investment and accounting firms.

This brings us back to those who are responsible for enforcing the rules, the regulators.  If the Accountancy & Actuarial Discipline Board(AADB) and Public Company Accounting Oversight Board (PCAOB) cannot set meaningful penalties for the crimes committed, then such penalties will be considered a legitimate cost of doing business instead of a penalty.  So much for the credibility of the markets.

In the News: January 7, 2012


·        SECChanges Policy on Admissions of Wrongdoing at Barron’s
·        S&P500 Ends Heart-Stopping Year Down 0.003% at Barron’s
·        TheGoogle Interview Cheat Sheet at BusinessWeek
·        Quiz:How Dysfunctional Is Your Workplace? at BusinessWeek
·        AMissouri Town's Sweet Dreams Turn Sour at BusinessWeek
·        AShifting Market Stings Chinese Homeowners at BusinessWeek
·        Bewareof ETFs on Steroids at BusinessWeek

NLO Dividend Watch List: December 30, 2011

The S&P 500 ended the year at precisely where it started. The Dow, however, ended up nearly 6% for the year.

Our list from last year (December 31, 2010) posted an average gain of 9.5% which is considerably better than the overall market. This brings us to the end of the year watch list for 2011. As it stands, there are 22 companies this year versus 10 companies from last year. There is considerably less concentration compared to our list from last year. Below are the 22 companies ending our 2011 watch list:

December 30, 2011

Symbol Name Price % Yr Low P/E EPS (ttm) Dividend Yield Payout Ratio
TR Tootsie Roll Industries Inc  23.67 3.72% 32.88 0.72 0.32 1.35% 44%
FRS Frisch's Restaurants, Inc 19.4 5.21% 22.05 0.88 0.64 3.30% 73%
BMO Bank of Montreal 54.81 5.75% 10.66 5.14 2.74 5.00% 53%
BCR CR Bard, Inc. 85.5 5.82% 21.98 3.89 0.76 0.89% 20%
JW-A John Wiley & Sons Inc. 44.4 5.99% 15.58 2.85 0.80 1.80% 28%
LM Legg Mason, Inc.  24.05 6.37% 14.66 1.64 0.32 1.33% 20%
SCHW Charles Schwab Corp. 11.26 6.63% 16.81 0.67 0.24 2.13% 36%
WST West Pharmaceutical 37.95 6.90% 20.97 1.81 0.72 1.90% 40%
EXPD Expeditors Intl of Washington 40.96 7.08% 22.63 1.81 0.50 1.22% 28%
GS Goldman Sachs Group, Inc.   90.43 7.31% 13.76 6.57 1.40 1.55% 21%
BDX Becton, Dickinson and Co. 74.72 7.37% 13.30 5.62 1.80 2.41% 32%
OMI Owens & Minor, Inc. 27.79 7.42% 15.61 1.78 0.80 2.88% 45%
CAH Cardinal Health, Inc.   40.61 8.21% 15.86 2.56 0.86 2.12% 34%
AVP Avon Products, Inc. 17.47 8.58% 10.28 1.70 0.92 5.27% 54%
WAG Walgreen Co. 33.06 8.97% 11.17 2.96 0.90 2.72% 30%
AROW Arrow Financial Corp.  23.44 9.02% 12.67 1.85 1.00 4.27% 54%
UTX United Technologies Corp. 73.09 9.30% 13.71 5.33 1.92 2.63% 36%
BMI Badger Meter, Inc. 29.43 9.57% 18.28 1.61 0.64 2.17% 40%
CWT California Water Service 18.26 9.67% 18.63 0.98 0.62 3.40% 63%
CLX Clorox Co. 66.56 9.91% 19.18 3.47 2.40 3.61% 69%
MATW Matthews International Corp.  31.43 10.01% 12.78 2.46 0.36 1.15% 15%
BMS Bemis Co Inc 30.08 10.55% 15.12 1.99 0.96 3.19% 48%

We've reviewed many companies last week and nothing materially changed therefore we suggest readers revisit our posting from December 23, 2011 for watch list summary.

Last Year Review

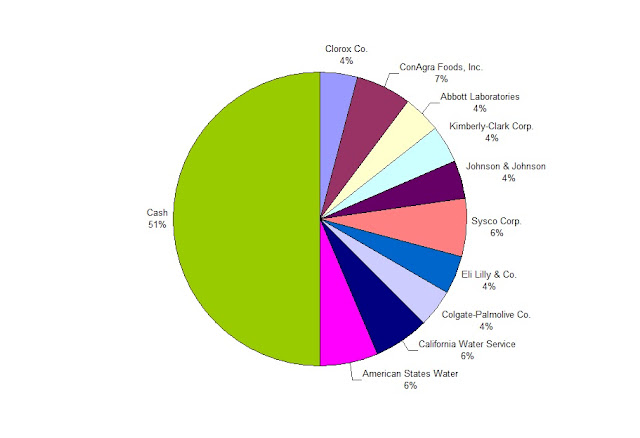
We've suggested the following asset allocation for the 10 stocks. If one was to follow that conservative allocation with 51% in cash, one would end up with a gain of 4.3% excluding dividends.

Disclaimer

On our current list, we excluded companies that have no earnings. Stocks that appear on our watch lists are not recommendations to buy. Instead, they are the starting point for doing your research and determining the best company to buy. Ideally, a stock that is purchased from this list is done after a considerable decline in the price and extensive due diligence. We suggest that readers use the March 2009 low (or the companies' most distressed level in the last 2 years) as the downside projection for investing. Our view is to embrace the worse case scenario prior to investing. A minimum of 50% decline or the November 2008 to March 2009 low, whichever is lower, would fit that description. It is important to place these companies on your own watch list so that when the opportunity arises, you can purchase them with a greater margin of safety. It is our expectation that, at the most, only 1/3 of the companies that are part of our list will outperform the market over a one-year period.

Please consider donating to the New Low Observer. Thank you.

Nasdaq 100 Watch List: December 30, 2011 (revised)

Below are the Nasdaq 100 companies that are within 10% of their respective 52-week lows. Stocks that appear on our watch lists are not recommendations to buy. Instead, they are the starting point for doing your research and determining the best company to buy. Ideally, a stock that is purchased from this list is done after a considerable decline in the price and rigorous due diligence.

Symbol Name Price P/E EPS Yield P/B % from low
BMC BMC Software, Inc. 32.78 13.43 2.44 N/A 3.65 1.83%
ORCL Oracle Corp. 25.65 14.11 1.82 0.90% 3.1 3.76%
VMED Virgin Media Inc. 21.38 68.53 0.31 0.70% 4.99 4.19%
SYMC Symantec Corp. 15.65 17.8 0.88 N/A 2.54 4.75%
CTRP Ctrip.com 23.4 19.93 1.17 N/A 3.09 4.79%
LRCX Lam Research 37.02 7.67 4.82 N/A 1.89 6.35%
EXPE Expedia, Inc. 29.02 8.61 3.37 3.90% 1.49 6.38%
BRCM Broadcom Corp 29.36 17.68 1.66 1.20% 2.57 6.42%
SRCL Stericycle, Inc. 77.92 30.92 2.52 N/A 5.66 6.67%
EXPD Expeditors Int'l of Was 40.96 22.63 1.81 1.20% 4.46 7.08%
DTV DIRECTV 42.76 13.33 3.21 N/A N/A 7.38%
AMZN Amazon.com 173.1 91.25 1.9 N/A 10.19 7.79%
CA CA Inc. 20.22 11.86 1.7 1.00% 1.74 8.62%
AVGO Avago Tech. 28.86 13.18 2.19 1.60% 3.57 9.24%
WYNN Wynn Resorts 110.49 25.79 4.28 1.80% 5.32 9.37%
MSFT Microsoft Corp. 25.96 9.44 2.75 3.10% 3.68 9.77%
NTAP NetApp, Inc. 36.27 22.1 1.64 N/A 3.42 9.91%

Watch List Summary

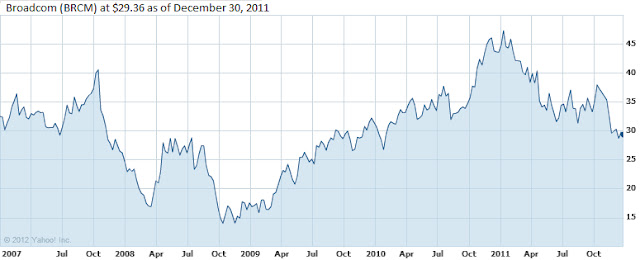
Broadcom (BRCM) has fallen to a one-year low recently, the stock is also near a two-year low.  According to Dow Theory, BRCM is considered at fair value at $30.72.  The remaining Dow Theory downside targets for this stock are $25.17, $21.47 and $17.77.  With the stock trading slightly more than double the 2009 low, the company and its fundamental allow for purchases to be made in two stages.

The Punchline: Broadcom is a strong company in a strong industry that is experiencing consolidation, thereby reducing the number of competitors.  Consider buying BRCM in two stages, once at the current price and again at any price below $25.17.

Watch List Performance Review

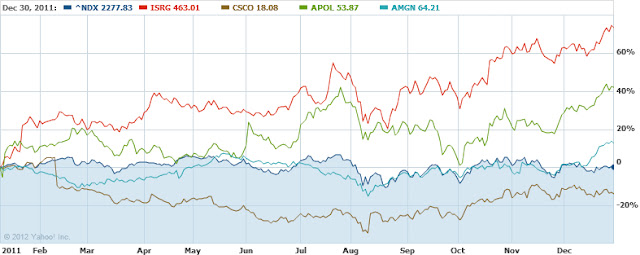
In our ongoing review of the Nasdaq 100 Watch List, we have taken the stocks from our list of January 7, 2011 (found here) and have checked their performance one year later. The companies on that list are provided below with the closing prices from January 7, 2011 to December 30, 2011.

Symbol Name Jan-11 Dec-11 % change
ISRG Intuitive Surgical 267.4 463.01 73.15%
CEPH Cephalon 60.32 81.49 35.10%
CSCO Cisco Systems 20.97 18.08 -13.78%
APOL Apollo Group 37.98 53.87 41.84%
AMGN Amgen 56.98 64.21 12.69%
Average  29.80%
^NDX Nasdaq 100 2276.7 2277.83 0.05%

Even with the underperformance from Cisco (CSCO), our watch list from the beginning of last year exceeded the Nasdaq 100 Index by a wide margin.

Disclaimer:
On our current list, we excluded companies that have no earnings. Stocks that appear on our watch lists are not recommendations to buy. Instead, they are the starting point for doing your research and determining the best company to buy. Ideally, a stock that is purchased from this list is done after a considerable decline in the price and extensive due diligence. We suggest that readers use the March 2009 low (or the companies' most distressed level in the last 2 years) as the downside projection for investing. Our view is to embrace the worse case scenario prior to investing. A minimum of 50% decline or the November 2008 to March 2009 low, whichever is lower, would fit that description. It is important to place these companies on your own watch list so that when the opportunity arises, you can purchase them with a greater margin of safety. It is our expectation that, at the most, only 1/3 of the companies that are part of our list will outperform the market over a one-year period.

NLO Dividend Watch List: December 23, 2011

The S&P 500 exploded to the upside on Friday bringing the index into positive territory for the year. It has been a slightly different story for the blue chip Dow Jones Industrial Average, which is up 6% for the year.

There may be some bargains to be had in our list of 21 companies that are within 11% of the low.

December 23, 2011

Symbol Name Price % Yr Low P/E EPS (ttm) Dividend Yield Payout Ratio
TR Tootsie Roll Industries Inc  23.74 4.03% 32.97 0.72 0.32 1.35% 44%
BMO Bank of Montreal 54.4 4.96% 10.84 5.02 2.72 5.00% 54%
JW-A John Wiley & Sons Inc 43.99 5.01% 15.44 2.85 0.80 1.82% 28%
BCR CR Bard, Inc. 85.12 5.35% 21.88 3.89 0.76 0.89% 20%
FRS Frisch's Restaurants, Inc 19.5 5.75% 22.16 0.88 0.64 3.28% 73%
WST West Pharmaceutical 37.55 5.77% 20.75 1.81 0.72 1.92% 40%
BDX Becton, Dickinson and Co. 74.44 6.97% 13.25 5.62 1.80 2.42% 32%
EXPD Expeditors Intl.of Washington 41.07 7.37% 22.69 1.81 0.50 1.22% 28%
LM Legg Mason, Inc.  24.45 8.14% 14.91 1.64 0.32 1.31% 20%
AVP Avon Products, Inc. 17.48 8.64% 10.28 1.70 0.92 5.26% 54%
OMI Owens & Minor, Inc. 28.13 8.74% 15.80 1.78 0.80 2.84% 45%
MATW Matthews International Corp.  31.07 8.75% 12.63 2.46 0.36 1.16% 15%
AROW Arrow Financial Corp.  23.44 9.02% 12.67 1.85 1.00 4.27% 54%
CAH Cardinal Health, Inc.   40.96 9.14% 16.00 2.56 0.86 2.10% 34%
SCHW Charles Schwab Corp. 11.54 9.28% 17.22 0.67 0.24 2.08% 36%
T AT&T Inc 29.87 9.82% 15.16 1.97 1.76 5.89% 89%
CLX Clorox Co. 66.59 9.96% 19.19 3.47 2.40 3.60% 69%
BMS Bemis Co Inc 29.94 10.03% 15.05 1.99 0.96 3.21% 48%
CWT California Water Service 18.35 10.21% 18.72 0.98 0.62 3.38% 63%
ANAT American National Insurance 72.75 10.71% 11.30 6.44 3.08 4.23% 48%
UTX United Technologies Corp. 74.18 10.93% 13.92 5.33 1.92 2.59% 36%
21 Companies


Watch List Summary

Tootsie Roll (TR) leads our dividend list by being 4.03% above the one year low.  The chart below shows that in the last 13 years, if TR were bought around the current level, a gain of 20% is achieved in the subsequent 18 months or less.  According to Dow Theory, the minimum retracement of the current price decline from the high is to $26.40 or 11.20% above $23.74.  The downside risk is fairly limited if viewed from the perspective of the 2009 low.  At the current price, TR would need to fall -17.81% in order to accomplish the March 9, 2009 low.  This is an ideal candidate to consider for a stock that has increased its dividend for 47 years in a row, a dividend payout ratio of less than 50% and an additional 3% stock dividend that has been paid since 1966 to go along with the 1.30% cash dividend.
The Punchline: Tootsie Roll (TR) can be purchased at the current level in large quantities relative to other positions in your portfolio.  A second purchase could be done in an equal number of shares if the price declines to the 2009 low.
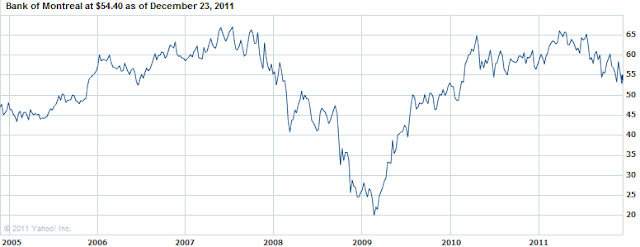
Bank of Montreal (BMO) has fallen –18.37% from the high      of April 2011.  The one-year low was at $51.83.  According to Dow Theory, BMO has established downside targets, from the high, of $51.06, $35.48 and $19.90.  It is interesting to note that BMO came close to the first downside target and has reversed.  In the short term, we believe that $57.66 is the minimum upside target for the stock based on the established downtrend.  However, if the price of BMO goes below the $51.06 level, we should expect a test of the $35.48 level.
The Punchline:  If BMO is considered for purchase then it should broken into thirds.  Although we favor strong Canadian banks of most U.S. banks, we recommend that any purchase of BMO be small relative to other stock holdings in your portfolio.  No additional purchases should be made of the stock rises after the initial purchase.
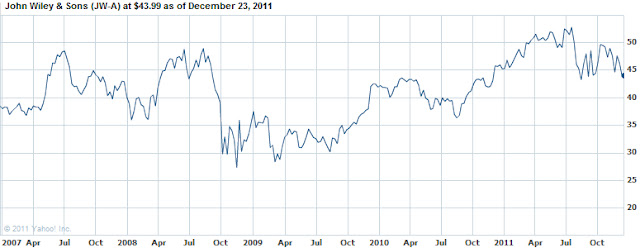
John Wiley and Sons (JW-A) is within striking distance of the 52-week low.  According to Dow Theory, based on the low in 2008 to the most recent high, the first downside target is $43.94.  However, with the stock currently at $43.99, there is the possibility that JW-A could fall to the second Dow Theory support level of $34.84.

The Punchline: John Wiley is a content provider/aggregator in a world seeking content.  Although the stock might be challenged in the short-term, the longer-term picture may favor JW-A.  However, we’re waiting for clarity on the $43.94 support level.

Sidenote: A company that is on our radar this week is Cardinal Health (CAH). After soaring to a high of $47 this year, the stock retreated as low as $37. The current yield of 2.1% implied that it is 31% undervalued (based on IQTrends [http://www.iqtrends.com/] range of 1.6% yield). This is the first time CAH is on our watch list since our recommendation of the stock in June 2009 (found here). The company spun off the CareFusion (CFN) division since our 2009 recommendation.

Top Five Performance Review

In our ongoing review of the NLO Dividend Watch List, we have taken the top five stocks on our list from December 23, 2010 (not published) and have check their performance one year later. The top five companies on that list can be seen in the table below.
Symbol Name 2010 Price 2011 Price % change
CAG ConAgra Foods, Inc. 22.40 26.6 18.75%
ABT Abbott Laboratories 47.81 56.02 17.17%
SYY Sysco Corp. 29.05 29.43 1.31%
CLX Clorox Co. 63.81 66.59 4.36%
KMB Kimberly-Clark Corp. 63.22 73.73 16.62%


Average 11.64%


DJI Dow Jones Industrial 11,573.49 12,294.00 6.23%
SPX S&P 500 1,256.77 1,265.33 0.68%

Our list from last year did extremely well. The top five beat the Dow by five percentage points, excluding dividends. Four of the top five stocks, except Kimberly Clark (KMB), reached the 10% mark within 6 months.

Disclaimer:

On our current list, we excluded companies that have no earnings. Stocks that appear on our watch lists are not recommendations to buy. Instead, they are the starting point for doing your research and determining the best company to buy. Ideally, a stock that is purchased from this list is done after a considerable decline in the price and extensive due diligence. We suggest that readers use the March 2009 low (or the companies' most distressed level in the last 2 years) as the downside projection for investing. Our view is to embrace the worse case scenario prior to investing. A minimum of 50% decline or the November 2008 to March 2009 low, whichever is lower, would fit that description. It is important to place these companies on your own watch list so that when the opportunity arises, you can purchase them with a greater margin of safety. It is our expectation that, at the most, only 1/3 of the companies that are part of our list will outperform the market over a one-year period.


Please consider donating to the New Low Observer. Thank you.

Dow Theory Applied to Silver?

A reader asks:

“How do you relate Dow Theory to the Silver market?”

Our response:

Charles H. Dow was first an economist, then a commodities expert and finally a stock market analyst. Before Charles H. Dow co-founded the Wall Street Journal, he was better known for writing the “Leadville Letters” for the Providence Journal. The “Leadville Letters” reported on Colorado’s silver mining boom in 1879. After co-founding the Wall Street Journal, the lessons learned in the silver mines ofColorado were found to have application on Wall Street.

Charles Dow was keenly aware of the importance and correlation between commodity prices and stock prices. Many of Dow’s articles in the Wall Street Journal were focused on the movement of commodity prices and all costs of production that went into commodity prices from shipping to the finished product.

As an example, Dow made the following observation:

“For the past 25 years the commodity market and the stock market have moved almost exactly together. The index number representing many commodities rose from 88 in 1878 to 120 in 1881. It dropped back to 90 in 1885, rose to 95 in 1891, dropped back to 73 in 1896, and recovered to 90 in 1900. Furthermore, index numbers kept in Europe and applied to quite different commodities had almost exactly the same movement in the same time. It is not necessary to say to anyone familiar with the course of the stock market that this has been exactly the course of stocks in the same period.”

Much of Dow Theory is based on Dow’s observation of the price action of commodities and then later applied to stock prices. The application of Dow Theory to the price of silver, gold or almost any other commodity is bringing Dow’s work back to its roots. In fact, Dow’s observations in commodities and then later applied to stocks is the basis for much of the modern fundamental and technical analysis that is done today, which includes the quest to determine the “value” of a company and the uses of Fibonacci numbers.

Dow Theory is applicable to all prices that are subject to the whims of market forces. Dow Theory also accounts for manipulation and hoarding. Dow Theory attempts to account for what can reasonably be expected of price action in the not too distant future.

Sources:

  • Dow, Charles. Review and Outlook. Wall Street Journal.February 21, 1901.
  • Bishop, George W. Jr. Who Was the First American Financial Analyst? Financial Analysts Journal, Vol. 20, No. 2 (Mar.-Apr., 1964), p.26-28.
  • Bishop, George W. Jr. New England Journalist: Highlights in the Newspaper Career of Charles H. Dow. The Business History Review.Vol. 34, No. 1 (Spring, 1960) p. 77-93.
  • More on Dow Theory from NLO

Dow Theory: 1907-1910

Bull market indication (A): According to Edwards and Magee, the bull market began on April 24, 1908. The New Low Observer believes that on January 9, 1908 (C), the DJI & DJT confirmed that we're in a bull market by going above the December 6, 1907 intermediate peaks. From the point (C) of the bull signal to the respective market tops, the DJI gained 55% and DJT gained 44%.
Bear market indication (B): Edwards and Magee indicated that on May 3, 1910, the bear market signal was initiated.  However, we believe that on January 12, 1910 (D) the DJI confirmed the  DJT bearish move of falling below the September 9, 1909 low. From the point of the bear signal (D) to the respective market bottoms, the DJI lost -23% and the DJT lost -16%.

iShares Silver Trust (SLV) Update

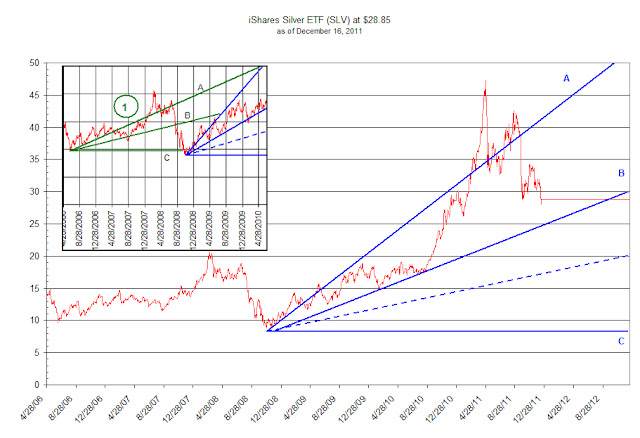
The iShares Silver Trust (SLV) ETF has fallen in line with our assessment from May 5, 2011.  However, it is times like these that we get nervous about our ability to believe that the price action of SLV will continue on a forecast that was presented over six months ago.  Back in May, we said the following:

…we should see SLV tread water for a brief period of time before falling back to the prior low which began with the current run back in November 2008.   Dow Theory suggests that a reasonable buying opportunity would exist at [or] below line B (blue line B).
Currently, the “blue line B” is around $24.31 and rising as time passes.  In our May Dow Theory interpretation of SLV, the price fell right through line B in 2008 without any hesitation.  We’re not so certain that such action will occur this time around.  As long as SLV can hold above the Dow Theory fair value of $28.15, there is a good chance silver will be able to rebound in a meaningful fashion.  However, closing below $28.15 (again) could be a confirmation of the downtrend.    
Many precious metal enthusiasts are arguing that what happened in 2008 was an outlier event for silver and therefore is unlikely to happen this time around.  It is hard to argue against such a view. However, it is difficult to get the period from 1974 to 1976 out our mind (visual here) when gold fell 50% and gold stocks fell 66% in the middle a gold bull market.  
Below is our updated chart of SLV reflecting the most recent price action:
The Punchline: If you like the idea of investing in silver, then a buying opportunity should be at/or below the blue line B ($24.31).  However, don’t go all in, just in case the dashed blue line does materialize at $17.


Nasdaq 100 Watch List: December 16, 2011

Below are the Nasdaq 100 companies that are within 10% of their respective 52-week lows. Stocks that appear on our watch lists are not recommendations to buy. Instead, they are the starting point for doing your research and determining the best company to buy. Ideally, a stock that is purchased from this list is done after a considerable decline in the price and rigorous due diligence.
Symbol
Name Trade P/E EPS Yield P/B % from Low
BMC BMC Software, Inc. 33.17 13.59 2.44 N/A 3.76 0.79%
VMED Virgin Media Inc. 20.95 67.58 0.31 0.70% 5.02 1.01%
CTRP Ctrip.com International, Ltd. 23.1 19.88 1.16 N/A 3.08 1.32%
SYMC Symantec Corporation 15.46 17.59 0.88 N/A 2.49 1.51%
BRCM Broadcom Corporation 28.72 17.29 1.66 1.30% 2.46 2.39%
LRCX Lam Research Corporation 35.92 7.45 4.82 N/A 1.85 2.86%
SRCL Stericycle, Inc. 76.51 30.36 2.52 N/A 5.49 4.74%
WYNN Wynn Resorts, Limited 105.65 24.66 4.28 2.00% 5.04 5.11%
EXPD Expeditors Int'l of Was 40.37 22.3 1.81 1.20% 4.37 5.54%
FSLR First Solar, Inc. 31.91 5.24 6.09 N/A 0.67 6.23%
AMAT Applied Materials, Inc. 10.33 7.12 1.45 3.10% 1.51 6.49%
HSIC Henry Schein, Inc. 62.44 16.39 3.81 N/A 2.23 6.74%
CHRW Robinson Worldwide 66.59 25.91 2.57 2.00% 8.6 6.89%
DTV DIRECTV 42.1 13.12 3.21 N/A N/A 7.62%
GILD Gilead Sciences, Inc. 37.16 10.86 3.42 N/A 4.76 7.87%
CA CA Inc. 20.12 11.81 1.7 1.00% 1.73 8.11%
NTAP NetApp, Inc. 35.71 21.76 1.64 N/A 3.42 8.21%
WCRX Warner Chilcott plc 14.02 36.89 0.38 N/A 88.81 8.68%
AVGO Avago Technologies 28.8 12.87 2.24 1.50% 3.76 9.01%
RIMM Research In Motion 13.44 2.45 5.48 N/A 0.79 9.19%
INFY Infosys Limited 50.37 18.12 2.78 1.10% 4.73 9.22%
MSFT Microsoft Corporation 26 9.45 2.75 3.10% 3.62 9.94%
Watch List Summary
BMC Software (BMC) has not only fallen to a new 52-week low, it has also fallen to a 2-year low.Based on the decline so far, according to Dow Theory, BMC could retrace to the $40 level.Fair value for the stock is at $44.86.The $40 level seems reasonable within the next year for BMC even though it is 20% above the current price.The most obvious downside target for BMC is the October 2008 low of $22.A decline of $22 would equal a loss of 33%.
It should be noted that despite the market turmoil of 2008, BMC did not fall to the 2006 low.Additionally, the long term support line as drawn in the chart for BMC indicates that $22 ultimate price to watch for. If BMC were to replicate the percentage decline from the May 2008 top to the October 2008 low, the stock would decline to a price of $31.11.
The Punchline: Those interested in BMC could split their investments into two transactions.The first purchase could be done between Friday’s closing price and $31.11 and the second if the stock declines to the $22 level. No additional shares should be bought if the price increases.
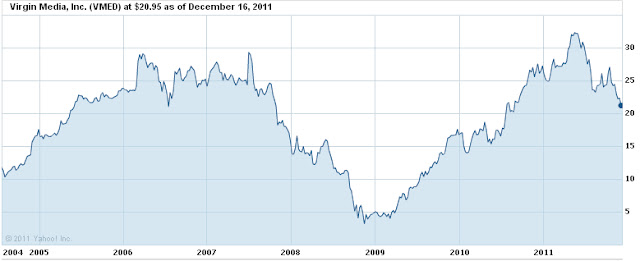
Virgin Media (VMED) has an almost uninterrupted price movement from the low in 2008 to the most recent high of $33.32 in May 2011.According to Dow Theory, VMED broke just below the initial support level of $23.30.The next downside target is the 50% principle level of $18.29.Once breaking below $18.29, VMED could be expected to drop to the $13.28 level.The next upside target for VMED is $25.07 which assumes the best case scenario.
 
However, when contrasting the price movement of VMED to BMC during the decline of 2008, the price of VMED gave up all of the gains from 2004 to 2006 and then some.Those interested in VMED should be willing to accept the stock price to decline to the $13.28 in a worst case situation.
The Punchline:There is significant price support at the $14 level for VMED.This transaction should be broken into thirds with an equal number of shares being bought at each level on the downside.No additional shares should be bought if the price increases.
Ctrip.com International (CTRP) is on a pace to replicate the performance from the high in April 2008 to the low of January 2009 which equaled a loss of 72%. A similar decline in CTRP from the high of $50.57 would bring the price down to $14.16.Suffice to say, the stock “only” needs to decline another $8.94 or 38% from the current price of 23.10.This seems very easy considering the high volatility of Chinese stocks.We believe that unless CTRP is summarily dismissed from the Nasdaq 100 index, there may yet be life in this company.
 
We believe that the Nasdaq 100 committee added CTRP to the index based on the performance of Priceline.com (PCLN).Amazingly, at the current price of $23.10, CTRP sits one penny below the 2nd Dow Theory support level of $23.11.any further deviation below the current price almost ensures that the stock is destined for the $10 range.
The Punchline: Watch and wait for CTRP to establish a solid support level.The nearest upside target is $32.26.


Watch List Performance Review
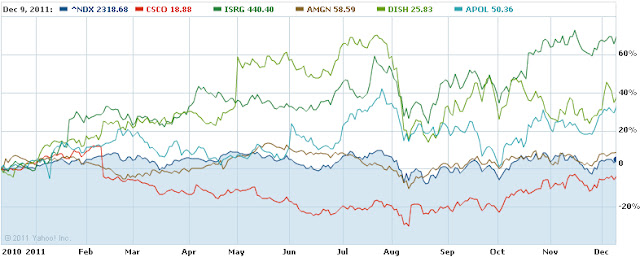
In our ongoing review of the Nasdaq 100 Watch List, we have taken the stocks from our list of December 10, 2010 (found here) and have checked their performance one year later. The companies on that list are provided below with the closing prices from December 10, 2010 to December 9, 2011.
Symbol Name 2010 2011
% change
CSCO Cisco Systems, Inc. 19.70 18.88
-4.16%
ISRG Intuitive Surgical, Inc. 260.07 440.4
69.34%
AMGN Amgen Inc. 53.89 58.59
8.72%
DISH DISH Network Corp 18.80 25.83
37.39%
APOL Apollo Group, Inc. 37.95 50.36
32.70%
Average
28.80%
^NDX Nasdaq 100 Index 2,207.45 2,318.68
5.04%
The performance of the top five stocks from last year was amazing. The average performance was five times better than the Nasdaq 100 index in the same period of time.
Disclaimer:
On our current list, we excluded companies that have no earnings. Stocks that appear on our watch lists are not recommendations to buy. Instead, they are the starting point for doing your research and determining the best company to buy. Ideally, a stock that is purchased from this list is done after a considerable decline in the price and extensive due diligence. We suggest that readers use the March 2009 low (or the companies' most distressed level in the last 2 years) as the downside projection for investing. Our view is to embrace the worse case scenario prior to investing. A minimum of 50% decline or the November 2008 to March 2009 low, whichever is lower, would fit that description. It is important to place these companies on your own watch list so that when the opportunity arises, you can purchase them with a greater margin of safety. It is our expectation that, at the most, only 1/3 of the companies that are part of our list will outperform the market over a one-year period.