Author Archives: nlo-admin

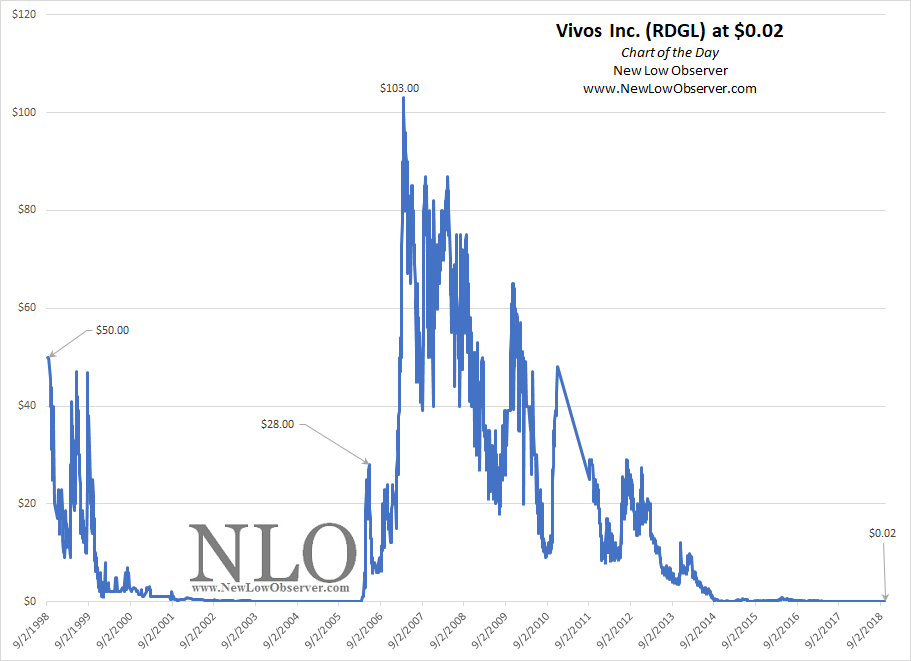
Chart of the Day: Vivos Inc.

According to Yahoo!Finance, Vivos Inc. is, “…a radiation oncology medical device company, develops brachytherapy devices for the treatment of non-resectable tumors. It focuses on the development of yttrium-90 based RadioGel device, an injectable particle-gel for brachytherapy radiation treatment of cancerous tumors in people; and IsoPet for animals. The company was formerly known as Advanced Medical Isotope Corporation and changed its name to Vivos Inc. in December 2017.”

image

Market Verdict on SHLD and JCP? Same Fate

On the day that Sears Holdings (SHLD) officially declared bankruptcy, Bill Friend, VP of Fluent Commerce, came out with a statement saying:

"Sears was raided by hedge fund guys, so they were never going to really recover…J.C. Penney is a different animal in that respect."

The clarity of this statement cannot be emphasized enough.  However, the article that highlighted Friend’s comment from Real Money (TheStreet.com) was titled “J.C. Penney and Sears Aren't Cut From the Same Cloth.”

image

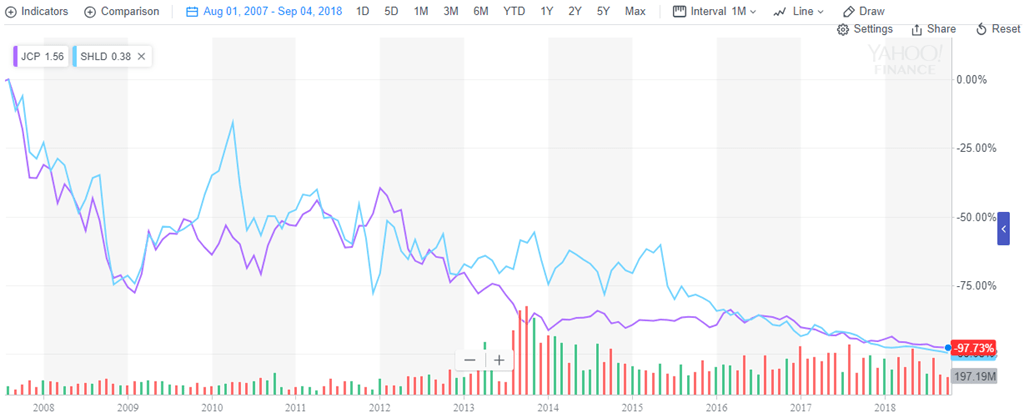
What is the best determination of whether JCP is cut from the same cloth as SHLD?  We look at the comparison of the two stocks since the peak of the market in 2007 to the intraday price on October 16, 2018.

image

With a loss of –99.99% for SHLD and –97.73% for JCP, a reasonable person would get the impression that both SHLD and JCP are cut from the exact same cloth.  At least that is what the market price has said so far.

W.W. Grainger Update

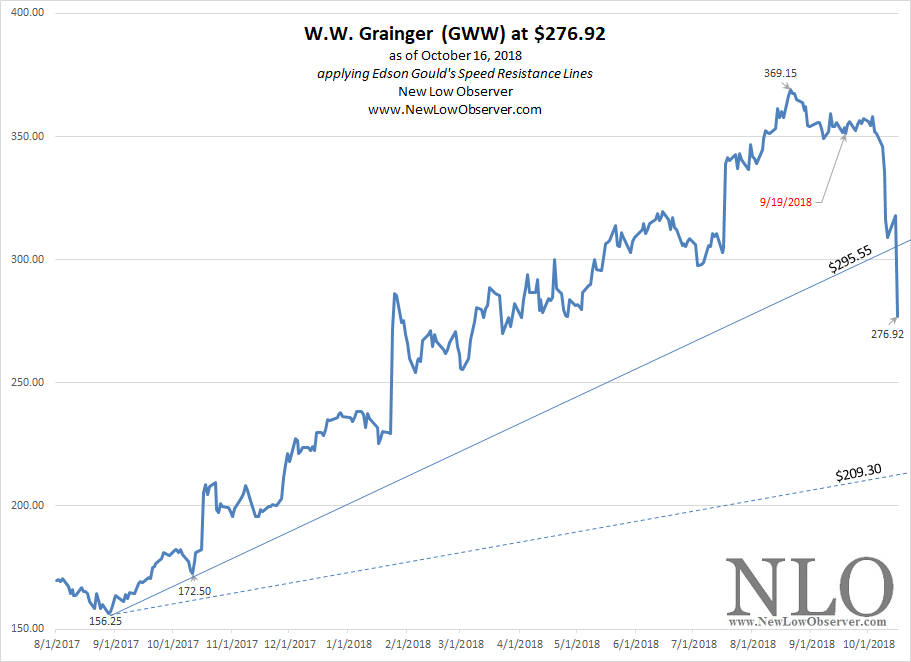
On September 19, 2018, we said that W.W. Grainger (GWW) had downside targets of $295.55, $209.30, & $123.05.  By October 16, 2018, GWW had smashed through the conservative downside target of $295.55.

image

While the Speed Resistance Lines (SRL) are guides for downside risk, the Altimeter continues to provide the needed insight on where we are with GWW on a valuation basis. Continue reading →

Cardinal Health 10-Year Targets

Below are the valuation targets for Cardinal Health (CAH) for the next 10 years. Continue reading →

U.S. Dividend Watch List: Top 5 by Ratios

Below is the breakdown of top 5 stocks from our October 12, 2018 list based on the fundamental ratios that we track. Continue reading →

Matthews International 10-Year Targets

Below are the valuation targets for Matthews International (MATW) for the next 10 years. Continue reading →

Hang Seng Index: Cyclical Trends

Below is a chart of the Hang Seng Index (HSI) from 1986 to 2018.

image

In the charts that follow, we break down the percentage change in each cyclical rise and decline of the HSI. Continue reading →

Insurance Watch List: October 2018

Below are the Insurance Watch List stocks for October 2018. Continue reading →

U.S Dividend Watch List: October 12, 2018

What a week that was with both the Dow and S&P losing nearly -4%. From the peak of 2,940 on the S&P, the market fell -6% but that was less than the pullback we saw at the beginning of the year when S&P fell a little over -10% with similar duration.

While similar, there is one major difference between the two and that is interest rates. The 10-Year T-bill rate rose 18% since the end of January. Our followers will know that we will utilize Dow Theory as a gauge for market direction. Until a change of market direction is upon us, we will utilize the watch list below as a starting point to find investment opportunities. Continue reading →

Chart of the Day: Sears, Just Like Apple

There was a time when the Chairman and CEO of Sears Holdings (SHLD) said the following:

“At Sears Holdings, we seek to create long-term value for our shareholders. Like Apple, we seek to do so by improving our operating performance, innovating, and delighting customers.”

-Eddie Lampert, Chairman of the Board. Sears Holdings February 24, 2011. link.

Since February 24, 2011, when Sears Holdings (SHLD) was trading at $62.19, the stock price has declined to the present value of $0.34 or a loss a lot of money.

image

Chart of the Day: Federal National Mortgage Association

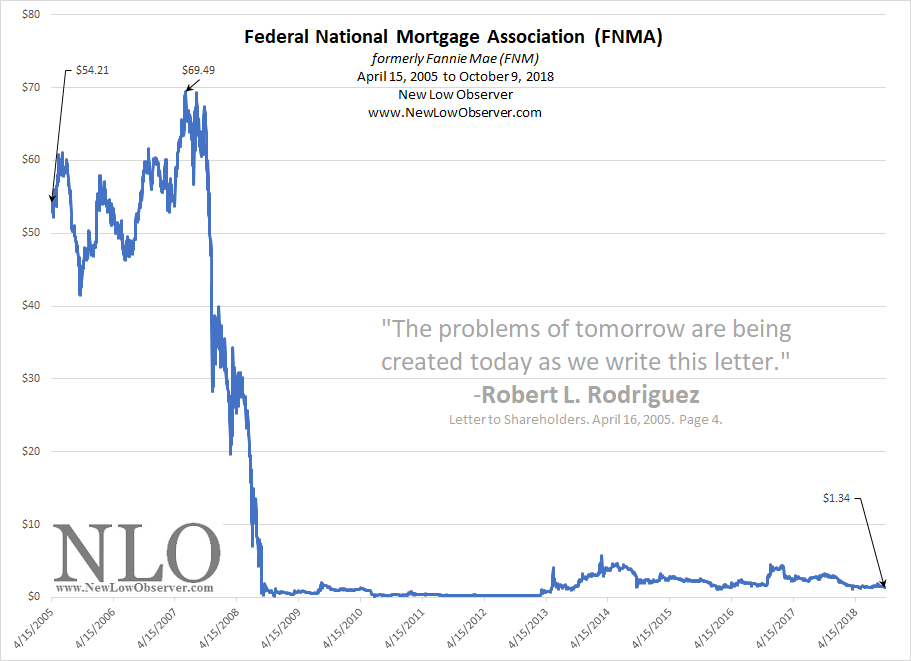
Federal National Mortgage Association (FNMA) is described by Yahoo!Finance as a provider of “…liquidity and stability support services for the mortgage market in the United States. It securitizes mortgage loans originated by lenders into Fannie Mae mortgage-backed securities (Fannie Mae MBS). The company operates through two segments, Single-Family and Multifamily.”

image

The quote inside of the chart is from Robert L. Rodriguez, former manager of the FPA Capital Funds.  Rodriguez was specifically commenting on what was going on at FNMA at the time.  The stock of FNMA has declined –97.50% since Rodriguez’s commentary.

Tencent Holdings Downside Targets

Below are the downside targets for Tencent Holdings (TCEHY).

Valmont Industries 10-Year Targets

Below are the valuation targets for Valmont Industries (VMI) for the next 10 years. Continue reading →

Berkshire Hathaway Targets

Below are the valuation targets for Berkshire Hathaway (BRK-A) for the next 10 years. Continue reading →

Diversification: DJIA vs. S&P 500

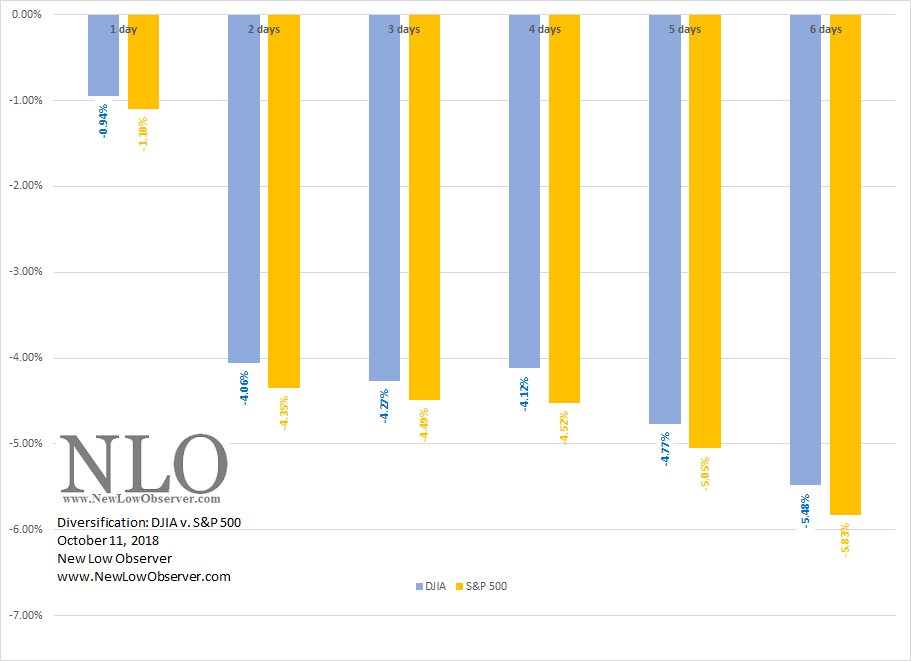
The long-standing view is that being diversified is better for the purpose of limiting losses.  the data from the most recent decline from the peak in the market confirms, for now, that diversification doesn’t matter.

DJIA S&P 500
1 day -0.94% -1.10%
2 days -4.06% -4.35%
3 days -4.27% -4.49%
4 days -4.12% -4.52%
5 days -4.77% -5.05%
6 days -5.48% -5.83%

As of October 11, 2018, and going backwards to October 3, 2018, the Dow Jones Industrial Average (DJIA) and S&P 500 have declined.  However, the extent of the decline defies the norms of diversification and concentration in investments.

image

In all scenarios, the Dow Jones Industrial Average declined less than the S&P 500.  As an example, from the October 3, peak to the present, the DJIA declined –5.19% while in the same covered period, the S&P 500 declined –5.56%.

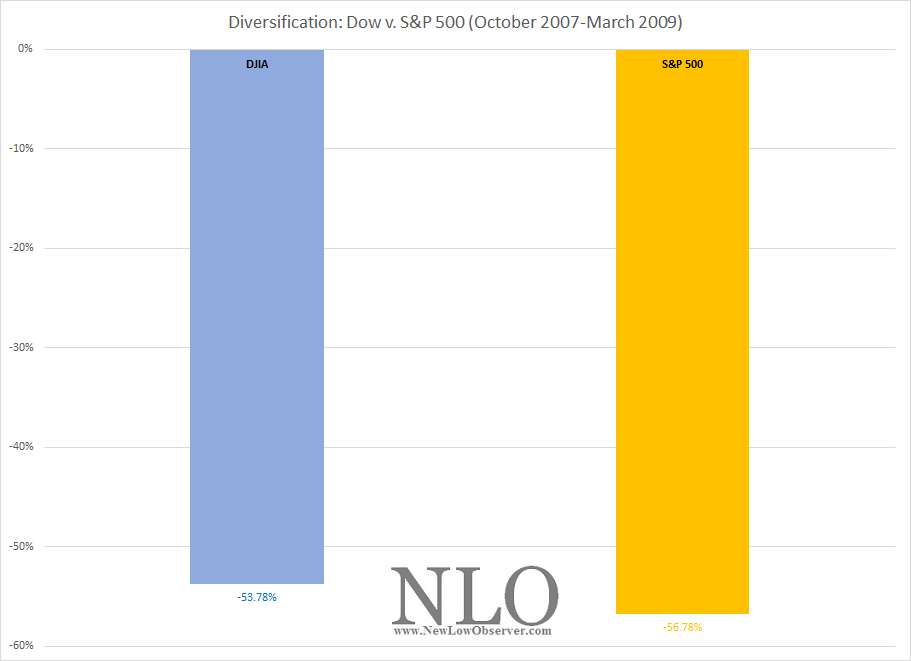
Conventional wisdom says that concentrated portfolios should rise more and fall more than diversified portfolio.  In theory, both the DJIA and S&P 500 are comprised with the same high quality stocks.  Therefore, the comparisons is supposed to be like-for-like.

image

This brings us back to the October 9, 2007 to March 9, 2009 period, when the Dow and S&P 500 peaked and troughed, respectively.  Strangely, the more concentrated Dow Jones Industrial Average, counter to the conventional wisdom, declined less than the S&P 500.  The 3% difference seems to be small, however, the theory of diversification and its failure, suggests that the amount is huge.