Below are the valuation targets for Aflac (AFL) for the next 10 years. Continue reading
-
Topics
Archives
-
-
Recent Posts
-
-
-
-

Below are the valuation targets for Aflac (AFL) for the next 10 years. Continue reading
Below are the valuation targets for Abbott Laboratories (ABT) for the next 10 years. Continue reading
According to Wikipedia, the Dogs of the Dow, “…is an investment strategy popularized by Michael B. O'Higgins in 1991, which proposes that an investor annually select for investment the ten Dow Jones Industrial Average (DJIA) stocks whose dividend is the highest fraction of their price [highest dividend yield].”
So far, in the year 2018, the ten highest yielding stocks have gained +1.10% while the ten lowest yielding stocks have gained +13.67%, on average. In the same period of time, the Dow Jones Industrial Average has gained +2.34%.
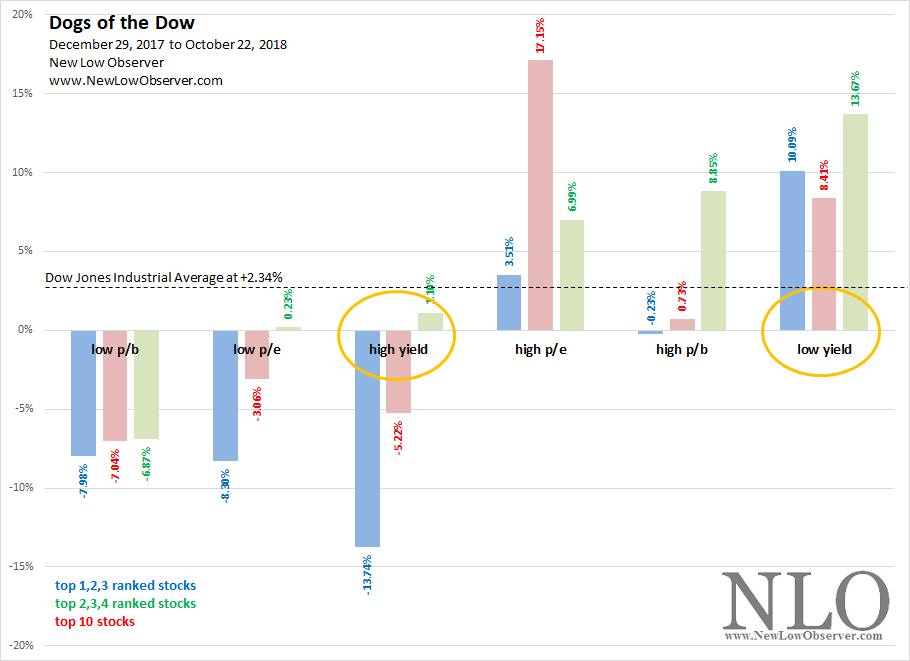
The distinction between the highest yielding stocks as compared to the lowest yielding stocks is very important because the whole purpose of the theory by Micheal O’Higgins is that you’ll be able to consistently beat the Dow Jones Industrial Average if you choose the ten highest yielding stocks every year.
As our January 6, 2018 posting on the top shows, in the period from 1996 to 2017, the “Dogs” (highest yielding stocks) routinely underperformed the DJIA annually. Because most investors are not in the position to buy ten stocks at the beginning of each year, we have provided performance data on the first three stocks (1,2,3) and the next best stocks (2,3,4).
There are several conclusions that should be drawn from the commentary above:
Posted in Dogs of the Dow
Below are the valuation targets for Abbott Laboratories (ABT) for the next 10 years.
Amkor Technology, Inc. (AMKR) provides "...outsourced semiconductor packaging and test services in the United States and internationally. The company offers turnkey packaging and test services, including semiconductor wafer bumps, wafer probes, wafer back-grinds, package design, packaging, and test and drop shipment services."
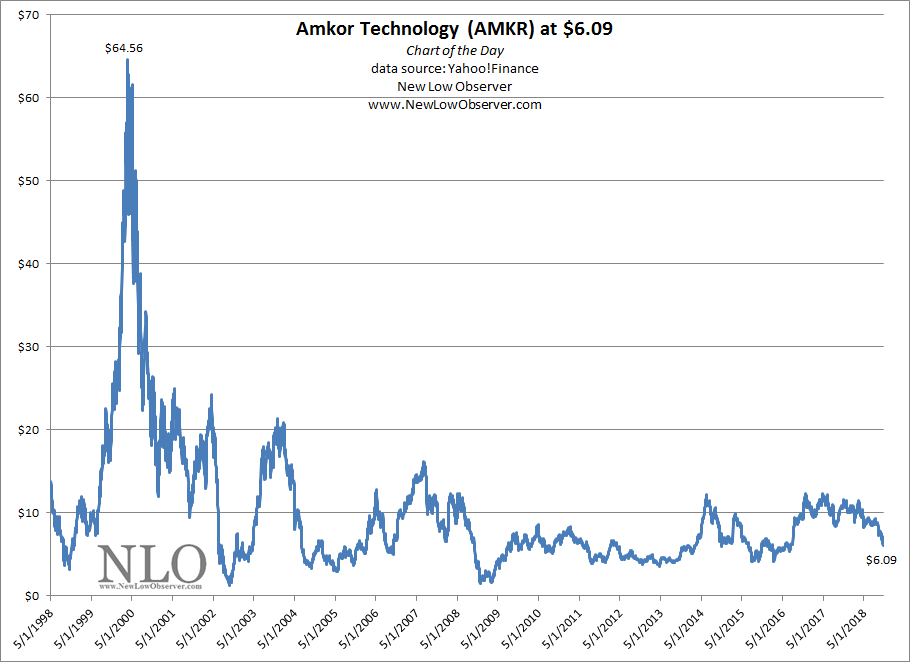
The Study of Failure
"Evidence from psychology also suggests that success generates more effort, while failure tends to lead people to reduce their effort and shift their attention to areas where they can be successful (Levin, Ben. “The Failure of Failure.” The Phi Delta Kappan, vol. 89, no. 3, 2007, pp. 234–235. JSTOR, JSTOR, www.jstor.org/stable/20442456.
Posted in AMKR, Chart of the Day, The Study of Failure
Hovnanian Enterprises (HOV) is described by Yahoo!Finance as a company that “…designs, constructs, markets, and sells residential homes in the United States. It constructs single-family detached homes, attached townhomes and condominiums, urban infill, and active lifestyle homes.”
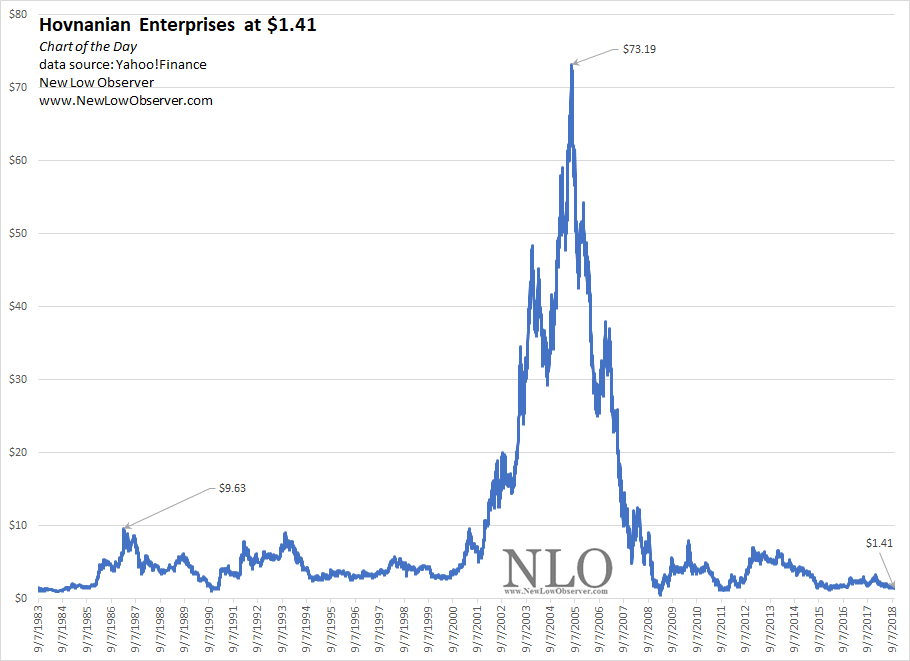
The Study of Failure
“Research on failure as a motivator is limited, though the evidence that does exist suggests that students can grow both from learning about the failures of other successful people and from experiencing failure themselves (Fattal, Isabel. The Value of Failing. The Atlantic. April 25, 2018. link).”
Posted in Chart of the Day, HOV, The Study of Failure
On August 2, 2017, when Lumber Liquidator (LL) was trading at $36.75, we said the following:
“Thus far, LL has a minimum reaction to the violent rise at the $27.03 price. However, the very fact that the stock has had such a dramatic rise in such a short period of time that a normal reaction could take the stock to $19.64.”
Since August 2, 2017, Lumber Liquidator has declined to the current price of $12.32, a decline of –66%.
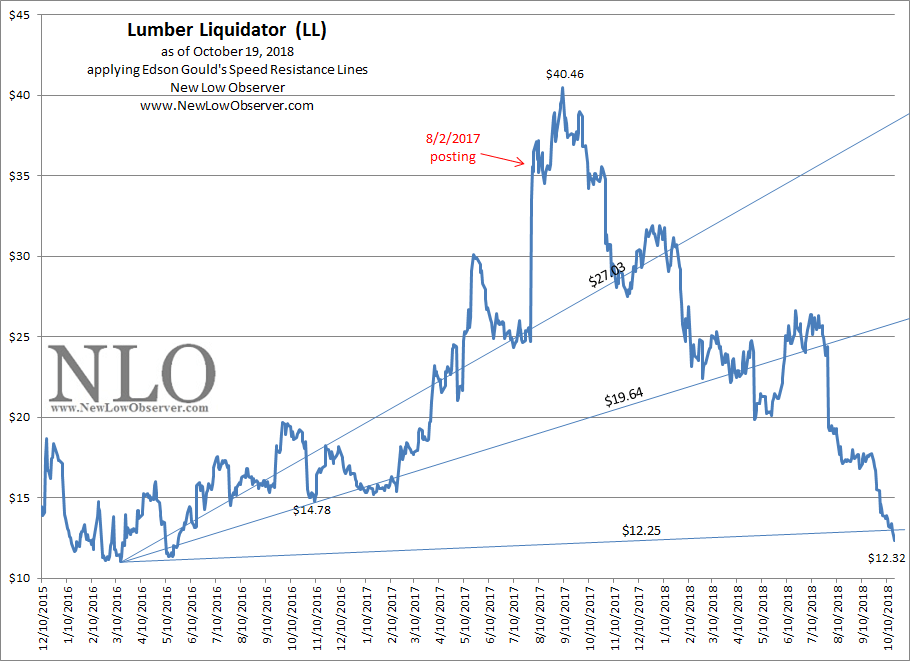
We also said the following of lumber futures and Lumber Liquidator (LL):
“These reactions are in place regardless of whether the price of Lumber Futures continue higher. If Lumber Futures decline then the $12.25 level becomes an active downside target.”
From August 2, 2017 to May 14, 2018, the Lumber futures contract nearly doubled in value. However, from May 14, 2018 to October 19, 2018, the Lumber futures have crashed nearly –50% and have help push, in our view, the price of Lumber Liquidator to the current levels.

There is a clear relationship between the price of lumber and Lumber Liquidator. However, we can’t say with conviction which is the leading indicator.
See also: February 25, 2015 Lumber Liquidator downside targets.
Posted in LL, lumber, Speed Resistance Lines, SRL
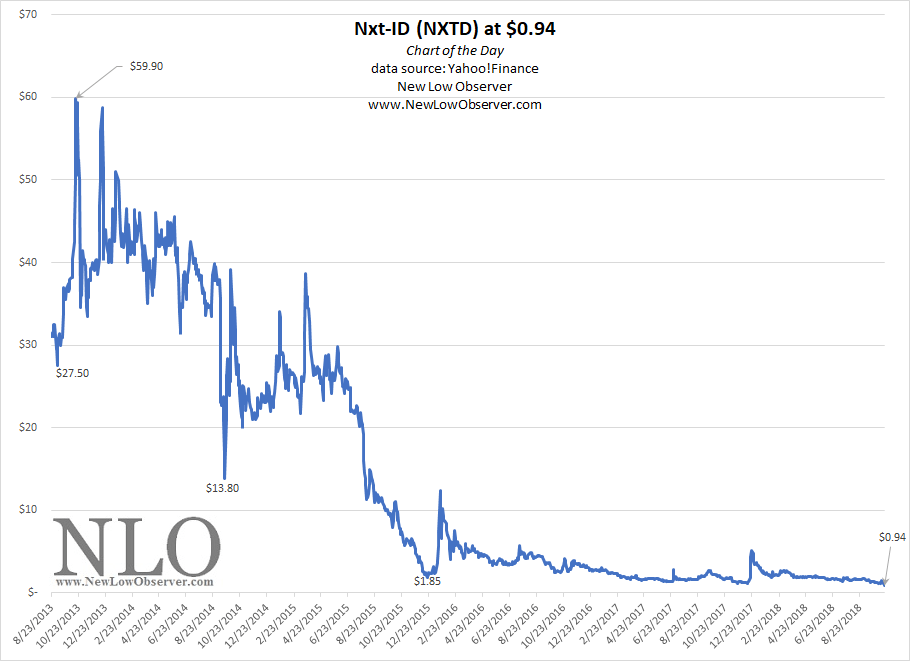
According to Yahoo!Finance, Nxt-ID is, “…a security technology company, engages in the development of products and solutions for security, healthcare, financial technology, and Internet of Things (IoT) markets. It offers non-monitored and monitored personal emergency response systems (PERS), including landline and cell-based options; the Fit Pay Trusted Payment Manager Platform (TPMP) that provides IoT and wearable devices with contactless payment capabilities and full digital wallet functionality; World Ventures Flye SmartCard, a smartcard customized for WorldVentures, the travel company; and Fit Pay General Purpose Reloadable Mastercard, which offers prepaid capabilities on wearable devices connected to the TPMP.”
The Study of Failure
“…while risk-taking can lead to either spectacular success or disastrous failure, looking only at successes will show a positive correlation between success and risk-taking.
“At least half the problem, says Denrell, is that data for failures tends to disappear. After all, companies that pursue unsuccessful strategies either go out of business or change their approach. Either way, information about the unsuccessful strategies becomes scarce, especially in comparison to the wealth of data from successful organizations (Krakovsky, Marina. What We're Missing When We Study Success. Graduate School of Business, Stanford. January 1, 2004. link.)”
Posted in Chart of the Day, The Study of Failure
On September 26, 2018, the Federal Reserve Bank increased interest rates.

How has this policy of rate increases affected the stock market? Since the first rate increase after the “financial crisis” on December 17, 2015, the Dow Jones Industrial Average has defied the scaremongers who assert that rising rates will crash the market.
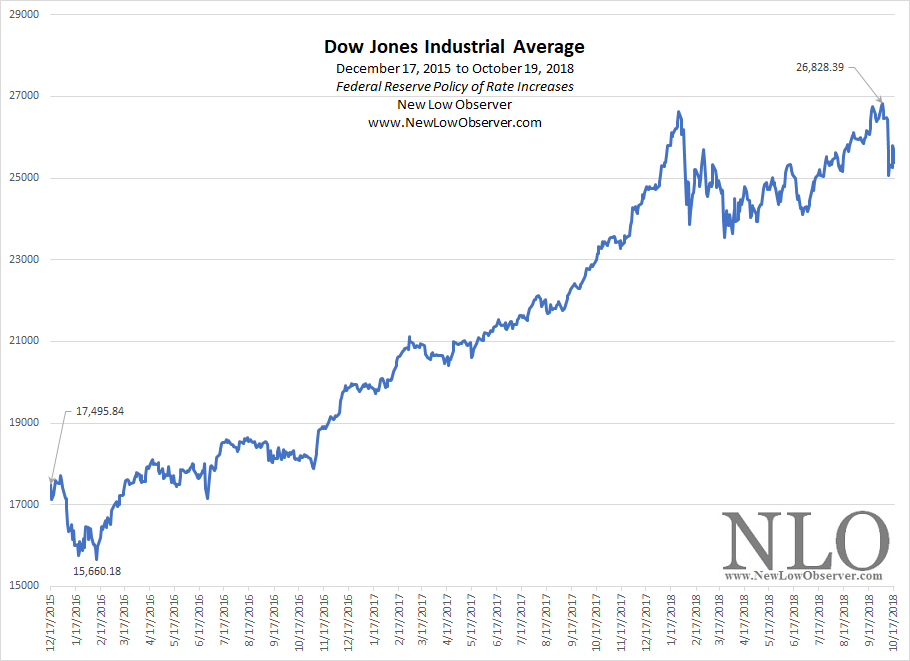
The Dow is up +45% since the rate increasing policy began.
How is it possible that the Dow Jones Industrial Average is up so much in spite of eight consecutive rate increases? Why have the scaremongers been so wrong? Two key articles that we’ve written address this perplexing issue and anticipated much of what we’re seeing in the current rise of the market with rising interest rates.
The first article, published April 20, 2011 titled “The Myth of ‘Inflation Proof’ Stocks” highlighted the performance of the Dow Jones Industrial Average from 1940 to 1966 while the 3-month Treasury increased from 0.01% to as high as 4.59%. In that period, the DJIA increased more than +900%.
The second article, published September 4, 2014 titled “Utility Stocks and Rising Interest Rates” flipped the script on the scaremongers by contrasting the performance of interest rate sensitive stocks against the backdrop of a rising rate environment. Like the Dow Jones Industrial Average, the Dow Jones Utility Average increased more than +500% in the period from 1939 to 1966. As a bonus, we included the earning and stock performance of seven regional utilities from 1949 to 1953.
Below is the 3-month Treasury and the upside resistance levels that we’re watching for a possible pullback from the rising trend. Continue reading
Below are the valuation targets for Aaron’s (AAN) for the next 10 years. Continue reading
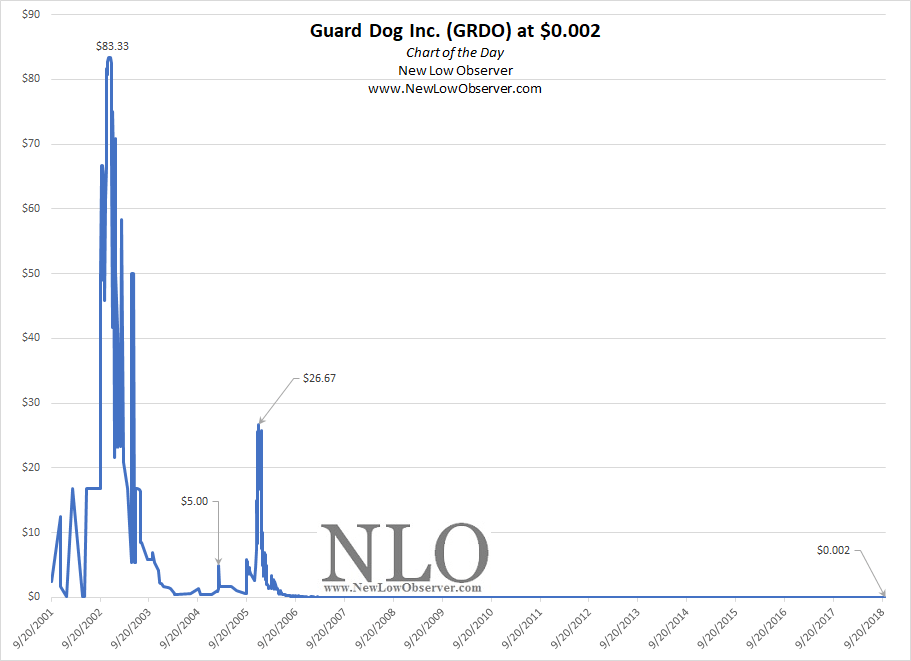
According to Yahoo!Finance, Guard Dog Inc. (GRDO), “…provides identity theft solutions for individuals, groups, and corporations in the United States. The company offers guidelines and tips for safeguarding personal information, and technology to remedy identity breaches.”
Posted in Chart of the Day, GRDO
The NLO team executed the following transaction(s): Continue reading
Below are the valuation targets for 3M Company (MMM) for the next 10 years. Continue reading
Below are the valuation targets for 1st Source (SRCE) for the next 10 years. Continue reading
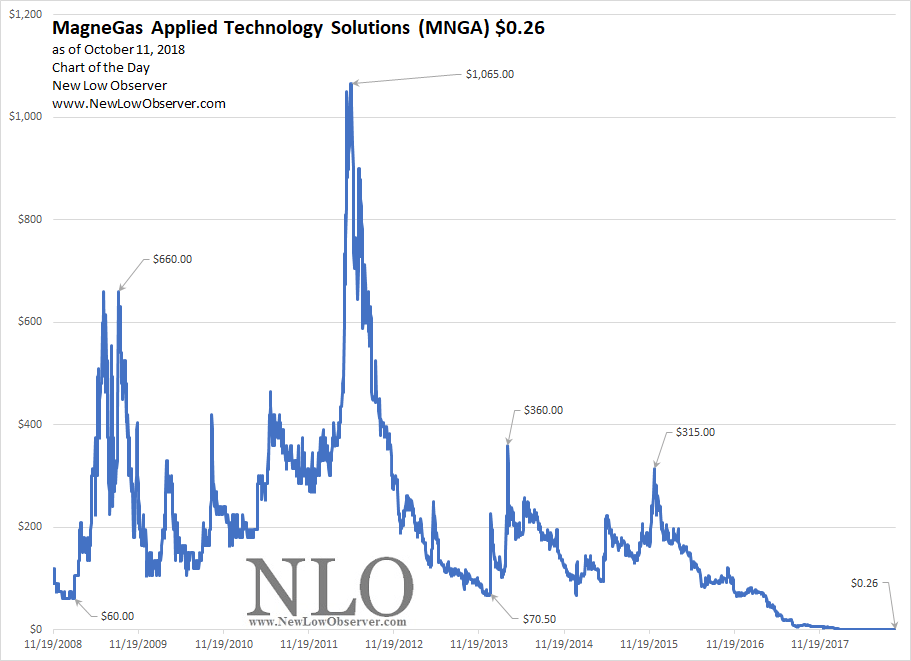
According to Yahoo!Finance, MagneGas Applied Technology Solutions (MNGA) is, “… an alternative energy company, creates and produces hydrogen based fuel through the gasification of liquid and liquid waste in the United States and internationally. The company offers MagneGas2, a hydrogen-based fuel for metal cutting as an alternative to acetylene.”
The Study of Failure
“Earlier this month, the Republican presidential nominee said if he were president he would allow domestic steel producers bigger profits, afford them greater protection from foreign competition and stretch out their timetable for meeting federally mandated clean air and water standards. Carter is likely to offer much the same ("President Carter's plan to revive the nation's ailing steel..." UPI Archive: Financial, 29 Sept. 1980. Infotrac Newsstand.).”
More reviews on failed ideas found here.
Posted in Chart of the Day, MNGA, The Study of Failure