Since I’m on the hook for the pending bailout of Boeing, it is worth knowing why the company soared so much in the first place.
Below is a chart of Boeing versus the Dow Jones Industrial Average from the March 9, 2009 low to March 20, 2020.

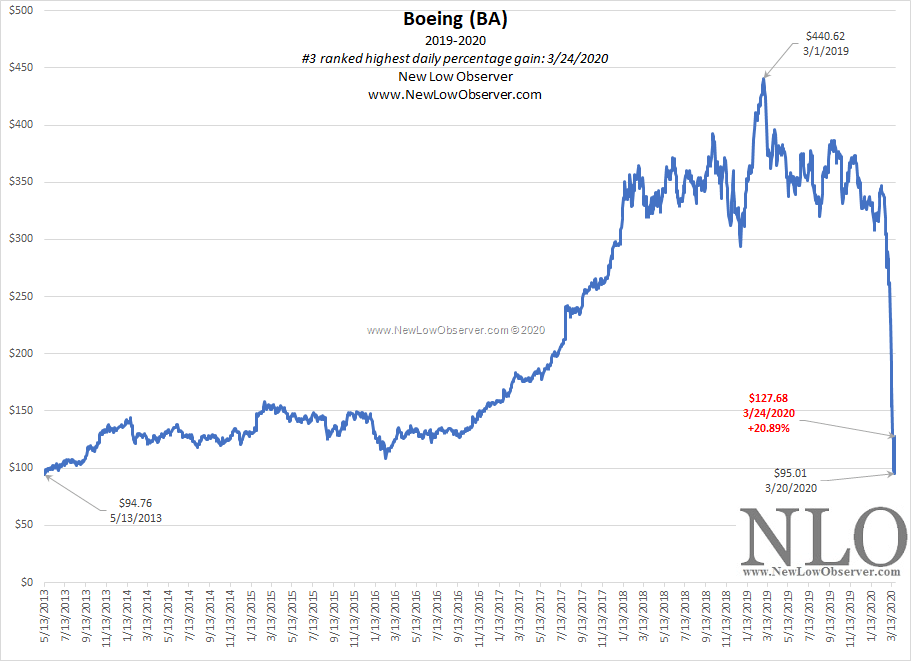
Look how majestically Boeing soars above the Dow Jones Industrial Average in the period from 2012 to 2019. As usual, the rise of Boeing wasn’t due to some kind of fluke. It was primarily an outgrowth of a accounting method that, while very legal, was questionable.
The accounting method is known as “program accounting” which allows the company to defer the costs of building planes and book the expect profits from those planes in the future, in the current period. It’s the usual time travelers dream except it is done with accounting.
Thankfully, there were well informed critic of this blatant fantasy world that Boeing was living in as noted in the excerpts below.

“Rather than booking the huge costs of building the advanced 787 or other aircraft as it pays the bills, Boeing -- with the blessing of its auditors [Deloitte & Touche LLP] and regulators and in line with accounting rules -- defers those costs, spreading them out over the number of planes it expects to sell years into the future. That allows the company to include anticipated future profits in its current earnings (Ostrower, Jon. Boeing's Unique Accounting Helped Lift Profit. Wall Street Journal. 04 Oct 2016: B1.).”
“The problem, analysts and other critics say, is that Boeing's approach stretches its profit per plane into such a distant and uncertain future that it isn't clear if it will ever recover the nearly $30 billion it has sunk into producing the plane and validate years of projected profits (Ostrower, Jon. Boeing's Unique Accounting Helped Lift Profit. Wall Street Journal. 04 Oct 2016: B1.).”
“Boeing, which hasn't confirmed or denied the investigation, has defended its accounting -- which complies with generally accepted accounting principles -- and says its profit expectations are realistic (Ostrower, Jon. Boeing's Unique Accounting Helped Lift Profit. Wall Street Journal. 04 Oct 2016: B1.).”

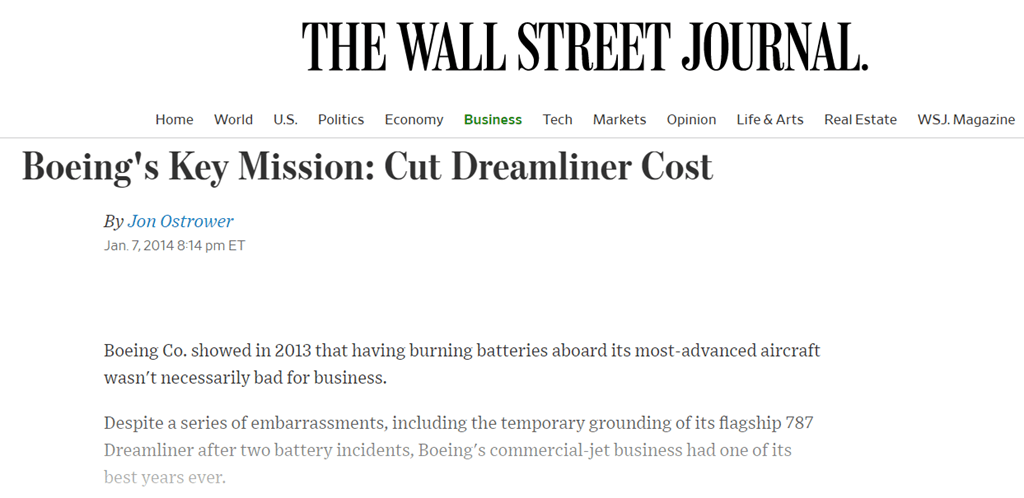
“For Boeing, the cost of producing the Dreamliner, which was delayed by 3 1/2 years because of design and manufacturing problems, is a thorny issue. The Dreamliners delivered so far continue to cost the company much more to make than what it charges for them, a fact obscured by its soaring financial results (Ostrower, Jon. Critical Mission for Boeing: Slashing Dreamliner Costs. Wall Street Journal.08 Jan 2014: B.1.).”
“If Boeing booked the difference between current sales and costs for each product it delivers, the way most companies do, its commercial-jet division's operating profit for the first nine months of 2013 would instead have been a $69 million loss, according to company figures (Ostrower, Jon. Critical Mission for Boeing: Slashing Dreamliner Costs. Wall Street Journal.08 Jan 2014: B.1.).”
Closing Thoughts
Sadly, many defenders of the bailout of Boeing will invoke claims that COVID-19 did the company in or that jobs will be lost. Few of those same people will look at how this could have been avoid by Boeing management.
On Deck: NextEra Energy: NextProblem