“I mistakenly took the vicious decline of 2007 to 2009 as a turn in the tide and a bear market.”
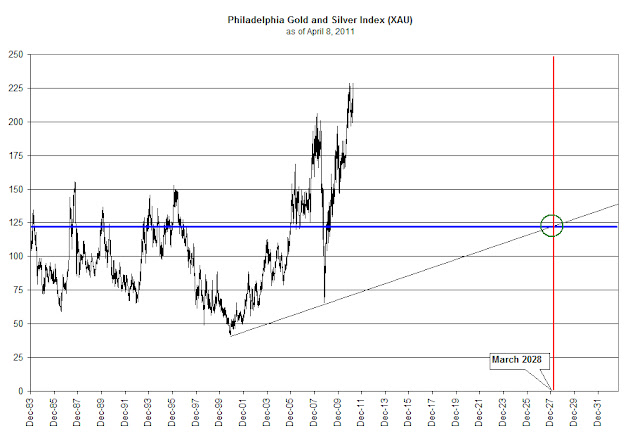
This comes as a shock since most market veterans would say that when almost every market, foreign and domestic, declines by 30% or more then it would be sufficient to label it as a bear market. When the gold stock index (XAU) declines 62% along with almost all other commodity indexes then a reasonable person, lacking any other term for it, would call that a bear market.
Instead of being a bear market, according to Russell, the decline from 2007 to 2009 was simply a “
…correction in an ongoing bull market.” As I attempted to process this thought, I only wonder what Russell would re-characterize the stock market decline in Japan (from the 38,000 to 8,000 level) as. Dow theorists like Hamilton, Rhea and many others are very clear on what constitutes a bear market. Russell’s assertion that 2007 to 2009 was simply a “correction” was in complete contradiction to his prescient call of an eminent bear market in
Barron’s in November 2007. Nor does Russell’s latest missive add credibility to his prior claims that the rise in the market from the 2003 low was a bear market rally.
To top off Richard Russell’s wild claim that a year and a half decline of over 40% in global equity price was only a “correction” is the fact that he omitted any reference to Dow Theory having any role in his sudden realization that he was wrong about his belief that we were only in a correction rather than a bear market. Russell credited his not so secret Primary Trend Indicator, Lowry’s Selling Pressure Index and Lowry’s Buying Power Index. Apparently, Dow Theory plays a small or non-existent role in a publication that is titled The Dow Theory Letters.
By inference, not crediting Dow Theory for his change in thinking suggests that Dow Theory doesn’t work. However, the NLO team has been adamant that up to this point, Dow Theory has indicated that we’re in a bull market and that a bear market has not been signaled since the July 23, 2009 bull market indication. This is in stark contrast to Russell’s back and forth calls of a bull and bear market as early as January 2009.
So what is Russell’s remedy for his error in judgment for the last 2 years? In today’s note (April 6, 2011) Russell says, “If this market is going to turn primary bearish, I would want to see an orthodox Dow Theory bear signal.” Wait a minute, as the market was rising Russell arbitrarily misapplied his version of Dow Theory and now he thinks that he’ll turn bearish when he receives “…an orthodox Dow Theory bear signal.”
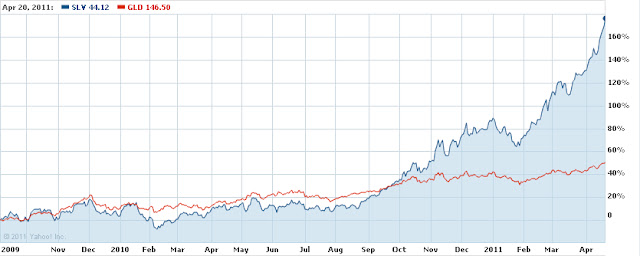
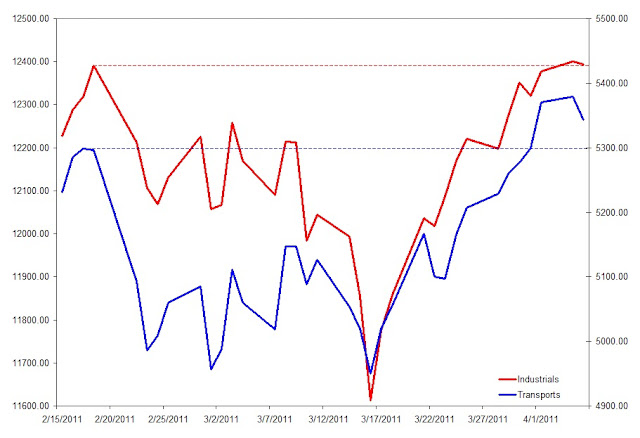
As an attempt to salvage some sort of credibility Russell says, “In the meantime, all is not lost. Gold is at new highs as are the gold ETFs, and silver is at a 31-year high.” This comes after Russell said on March 1, 2011 that if the Dow Industrials fall below 11,800 then investors should sell all stocks “including gold stocks." Well, on March 16, 2011, the Dow fell to 11,600 leaving anyone who believed Russell’s commentary on March 1, 2011 in the lurch.
The NLO team is disappointed since Richard Russell has been the primary inspiration for our work in Dow Theory and critically analyzing financial markets. In addition, we’d rather have Russell retire as a legend with a legacy that will continue to inspire. However, Russell’s latest work comes off as sloppy and requires significant willingness to view his work as entertainment, at best.