Monthly Archives: July 2010

Nasdaq 100 Watch List

Below are the Nasdaq 100 companies that are within 10% of their respective 52-week lows. Keep in mind that the March 2009 low or the November 2008 low should be your downside target for the worst case scenario.
Symbol Name Price P/E EPS Yield P/B % from Low
SYMC Symantec Corp. $12.97 14.87 0.87 0.00% 2.29 1.17%
AMAT Applied Materials $11.80 36.88 0.32 2.30% 2.19 2.79%
NVDA NVIDIA Corp. $9.19 19.07 0.48 0.00% 1.83 3.03%
TEVA Teva Pharma. $48.85 17.35 2.82 1.30% 2.19 3.96%
PAYX Paychex, Inc. $25.99 19.7 1.32 4.60% 6.73 4.42%
LIFE Life Technologies $42.99 36.04 1.19 0.00% 1.84 4.60%
GILD Gilead Sciences $33.32 10.1 3.3 0.00% 4.4 5.01%
XRAY DENTSPLY Intl $30.02 16.41 1.83 0.70% 2.35 6.08%
HSIC Henry Schein, Inc. $52.49 15.11 3.47 0.00% 2.15 6.90%
HOLX Hologic, Inc. $14.14 25.71 0.55 0.00% 1.3 6.96%
CEPH Cephalon, Inc. $56.75 11.32 5.01 0.00% 1.79 6.97%
GRMN Garmin Ltd. $28.51 8.28 3.44 5.00% 2.23 7.42%
VRTX Vertex Pharma $33.66 N/A -3.5 0.00% 6.65 7.71%
SPLS Staples, Inc. $20.33 18.81 1.08 1.80% 2.14 8.02%
AMGN Amgen Inc. $54.53 11.57 4.71 0.00% 2.31 8.37%
STX Seagate Tech. $12.55 4.01 3.13 0.00% 2.22 8.56%
EBAY eBay Inc. $20.91 10.99 1.9 0.00% 1.92 9.71%
CA CA Inc. $19.56 12.85 1.52 0.80% 1.94 9.89%

Watch List Summary

Of particular interest to us is Garmin Limited (GRMN) which happens to have the highest dividend yield.  We're suckers for high dividend yields which means we'll do just as much research as possible to determine if the yield is justified.  One approach that we used compares the dividend to the price as a ratio.  In this analysis, we were able to determine that the current price of $28.51, based on the current dividend, is the equivalent to the May 22, 2009 price of $19.74.  In addition, the earnings would have to decline 56% before the current dividend is no longer serviceable before borrowing, issuance of shares or the dividend is ultimately cut.  This appears to be a wide margin of safety for those concerned about earnings slippage going forward. 
The caveat to all of this analysis on Garmin (GRMN) is that we're not sure if the company is truly committed to paying a dividend.  Since the history of dividend payments is so short (since 2003) it is hard to say whether or not the dividend will stick.  In addition, the company has an erratic dividend payment schedule.  I'd like to say that the payment is annually however we cannot be certain that the next dividend payment will occur at the same time next year as it did this year.  Finally, annual payments of the dividend requires nerves of steel in order to get through to the next dividend payment, if it arrives.
For those drawn to the company for their dividend and the high visibility of their products, Garmin (GRMN) appears to be an interesting company to do follow-up research for the speculative portion of your portfolio.  In addition, Garmin (GRMN) might be underpriced at the current level and could be a possible takeover candidate due to their strong foothold in the niche business of GPS navigation.

Genzyme Corp: Value is Finally Being Recognized

There has been a lot of news about Genzyme (GENZ) being considered as a takeover candidate by Sanofi-Aventis (SNY). Typically, rumors are simply that, nothing more than prattle about a washed up company that has little or no life remaining. However, we have demonstrated that discussions of Genzyme (GENZ) being taken over are not so far fetched.
On October 17, 2009 (article link), we had only four companies that were on our Nasdaq 100 Watch List that was within 20% of their respective 52-week lows. This was in contravention to the overall market; which was racing higher every day. So compelling were the companies on the list that we felt it was necessary to give mini-profiles on their value propositions.
Genzyme (GENZ) was one such company that was on that list. We included Genzyme (GENZ) as the last company we profiled since we felt that it was “…a far superior value proposition.” This was despite the fact that Genzyme (GENZ) was the farthest from the new low among the companies on the list.
On October 30, 2009 (article link), we weren’t surprised that drug and medical device makers dominated our list of companies near a new low. In that posting to our site we said, “The continued undervaluation of these companies makes them prime targets for acquisition…” Genzyme (GENZ) was on the list and trading at $50.60. The performance of the stocks that were on the on the October 30 watch list is as follows:

The average gain for the group was 15.32% in 9 months. The worst performing stock has been Gilead Sciences (GILD) with a decline of 22.21%. The best performing stock has been Biogen (BIIB). Our sanguine view on Gilead Sciences (GILD) may be worth reviewing since it has fallen so much since October 30, 2009.
Genzyme has already indicated that they’re not going to accept the Sanofi-Aventis (SNY). This opens the door for competing bids, which should push the price up. Our view at this time is that Genzyme is strictly a speculation, at best, given the rise of nearly 33% since our mention of being a takeover candidate in October 2009.

Dividend Achiever Watch List

At the end of the week, our watch list contracted to 30 companies. Here is the watch list which ranks current and former Dividend Achievers that are within 10% of the 52-week low for July 23, 2010. We filtered out companies that has no earning and payout ratio in excess of 100%.  Stocks that appear on our watch lists are not recommendations to buy.  Instead, they are the starting point for doing your research and determining the best company to buy.  Ideally, a stock that is purchased from this list is done after a considerable decline in the price and extensive due diligence.

Symbol Name Price % Yr Low P/E EPS (ttm) Div/Shr Yield Payout Ratio
BEC Beckman Coulter, Inc. 47.26 0.00% 19.77 2.39 0.72 1.52% 30%
JNJ Johnson & Johnson   57.63 1.35% 11.91 4.84 2.16 3.75% 45%
FRS Frisch's Restaurants, Inc 19.99 2.46% 10.10 1.98 0.52 2.60% 26%
XRAY DENTSPLY International Inc.  29.26 3.39% 15.99 1.83 0.20 0.68% 11%
WST West Pharmaceutical Services, Inc. 35.41 3.48% 15.88 2.23 0.64 1.81% 29%
FII Federated Investors Inc 20.98 3.55% 10.70 1.96 0.96 4.58% 49%
PFE Pfizer Inc 14.58 4.14% 13.50 1.08 0.72 4.94% 67%
NTRS Northern Trust Corp.  47.51 4.53% 14.94 3.18 1.12 2.36% 35%
BDX Becton, Dickinson and Co. 66.89 5.49% 12.84 5.21 1.48 2.21% 28%
FFIN First Financial Bankshares, Inc.  48.49 6.15% 18.79 2.58 1.36 2.80% 53%
XOM Exxon Mobil Corp.   59.72 6.76% 13.60 4.39 1.76 2.95% 40%
UMBF UMB Financial Corp.  36.92 6.80% 16.05 2.30 0.74 2.00% 32%
PAYX Paychex, Inc.  26.64 7.03% 20.18 1.32 1.24 4.65% 94%
MDT Medtronic, Inc. 36.58 7.24% 13.11 2.79 0.90 2.46% 32%
HCC HCC Insurance Holdings, Inc. 25.59 7.30% 8.53 3.00 0.54 2.11% 18%
DNB Dun & Bradstreet Corp. 70.34 7.39% 14.10 4.99 1.40 1.99% 28%
T AT&T Inc 25.54 7.40% 12.71 2.01 1.68 6.58% 84%
STFC State Auto Financial Corp.  16.00 7.96% 17.20 0.93 0.60 3.75% 65%
WMT Wal-Mart Stores, Inc. 51.67 8.16% 13.56 3.81 1.21 2.34% 32%
MSA Mine Safety Appliances Co 24.24 8.21% 21.26 1.14 1.00 4.13% 88%
OMI Owens & Minor, Inc. 27.67 8.42% 14.72 1.88 0.71 2.57% 38%
AROW Arrow Financial Corp.  23.78 8.44% 12.26 1.94 1.00 4.21% 52%
SVU SUPERVALU INC 11.28 8.46% 6.10 1.85 0.35 3.10% 19%
CWT California Water Service Group 36.75 8.70% 19.04 1.93 1.19 3.24% 62%
ITW Illinois Tool Works, Inc. 43.31 9.65% 14.34 3.02 1.24 2.86% 41%
LLY Eli Lilly & Co. 35.17 9.84% 9.06 3.88 1.96 5.57% 51%
LOW Lowe's Companies Inc 21.11 10.23% 17.30 1.22 0.44 2.08% 36%
TRH Transatlantic Holdings, Inc. 48.22 10.32% 7.70 6.26 0.84 1.74% 13%
CTWS Connecticut Water Service, Inc.  22.15 10.75% 18.77 1.18 0.91 4.11% 77%
UFPI Universal Forest Products, Inc.  31.72 10.95% 25.79 1.23 0.40 1.26% 33%
30 Companies


Watch List Summary
The best performing stock from the previous list was Matthews International (MATW) which rose 17%!  The worst performing stock was Johnson & Johnson (JNJ) which fell 4.8%.  Because our list has more than a handful of great companies, I urged investors to filter for companies with less than 50% payout ratio. This should minimized the risk of dividend reduction if earnings are to fall by half. If you understand the companies' history and their ability to pay the dividend, payout ratios in excess of 50% may be considered.
Beckman Coulter (BEC) fell 21% on Friday and broke below its 52-week low. They are now withing 20% of their December 2008 low of $37. The company reported earnings that were 21% less than the analyst estimated. In addition, they took down their full year profit guidance by 10%. Our view is that the price action was not justified and we took a position in the name. We'll detail more about this company in the coming days.
Johnson & Johnson (JNJ) is another name that is getting interesting at this level.  Based on IQTrends (http://www.iqtrends.com/), JNJ is undervalued at or around 3.5% yield. With current yield of 3.75%, we suggest readers add JNJ to your investment opportunities list.
Once again, I suggest readers to use the March 2009 low (or companies' most distressed time) as the downside projection for investing.  Our conservative view is to embrace the worse case scenario prior to investing.  The March 2009 low fits that description.  Although we use the one year (52-week low) time frame, the past year was nothing but a major bull run and anyone who bought at or near the low could, and should, be taking profits.  It is important to place these companies in your own watch list so that when the opportunity arises, you can purchase them with a greater margin of safety.

Email our team here.

Richard Russell Review: Letter 762

Letter 762 was published on August 1, 1979. At the time, the Dow Jones Industrial Average was indicated at 839.76. There were a couple of items that stood out as I read this newsletter.
Richard Russell said:
“As a matter of fact with Libya’s recent 10% cut in oil shipments and Algeria’s just announced 20% cut, I suspect that there’s an oil (and gas) glut building up now! The world is learning to cut back on fuel use—and fast, and this could turn out to be the shocker of 1979-1980.” Page 2.
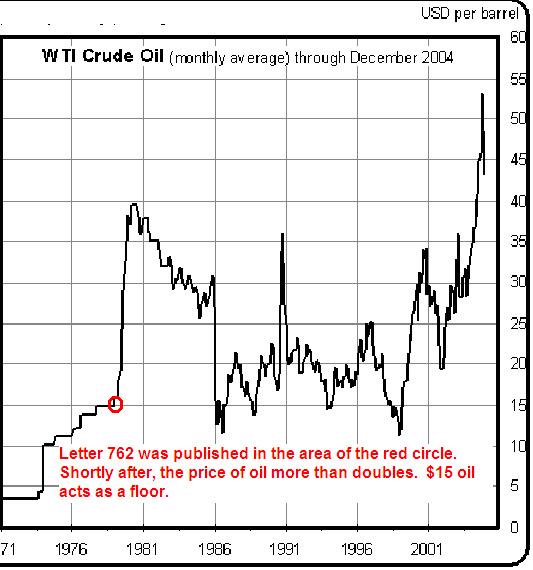
In fact, it wasn’t long before oil prices reflected the glut that Richard Russell spoke of. Under normal circumstances, it would be difficult to see beyond the present crisis and think that it will end at some point. It seems that Russell was cognizant of the prospect, as remote as it seemed at the time. Unfortunately, as indicated in the chart below, $15 oil would become a base, or floor, instead of a ceiling.
One item that has been a longstanding issue with Richard Russell is reflected in the next quote.
Russell said:
“Last week I was asked this question: ‘Russell, if you could change any part of your stock approach over the past year, what would have done?’ My answer was, ‘There are many subscribers who are willing to speculate, and I think I have been too conservative and too stubborn on this issue. The change I would have made is that I would have offered speculative choices for those willing to assume the risk of buying in a market that is not over-sold and not in an ideal buying area.’” Page 2.
In addition to the previous remark by Richard Russell, he also said:

“I want to add that I personally am buying no shares here. I prefer to wait for the ‘ideal buying situation.’” Page 2.

The two remarks above have been the biggest challenge to Russell’s ability to adhere to Dow Theory or even his Primary Trend Index which was created to avoid potential market manipulation. Russell is infinitely waiting for the “ideal buying situation” while ignore individual values along the way.
Russell points out a fact that every investor should have ingrained in their mind before committing a single dollar to the stock market or any other potential investment opportunity. Russell said:
“Every investment must ultimately be valued on its return. In the stock market that means dividends. Ultimately, dividends must be paid if a stock is to be worth anything.” Page 4.
I thought that the following remark was profound.
“Now here’s an interesting aside on inflation. One of the reasons it’s so insidious is that as soon as a man starts protecting himself against it, as soon as he buys a house or a load of gold coins or a painting or a stamp collection-that man wants his inflation hedge to go up. He becomes (deep in his heart) an inflationist. Take housing: the value of total housing in this nation is $2.2 trillion (two thirds of these houses have mortgages). The last thing these home-owners want is a declining market. They are secretly in favor of rising prices and inflation.” Page 4.
Russell’s comment is right on target when it comes to the attitude of most people. It seems that everybody is an inflationist. There are few market participants or commentators who express the view that they hope their long position will decline in value. The NLO team happens to be among the few who, after going long a stock, are eagerly anticipating a decline in price. Shameless self-promotion aside, Russell’s commentary on the closet inflationists is truly profound.
Russell points out that if you’re in commodities but not in precious metal then you could be losing your shirt. Russell says:
“Commodity traders have had one of their roughest seasons in years. If you weren’t in the metals, you probably ‘got killed.’ For instance, the October cattle contract is now down from 74.45 to 61, a drop of almost 18%. One trader told me that ‘it looks like the country is vegetarian.’ Live hogs are much worse, with the October contract dropping from 51 to 32 a drop of 37%. On piggies I was told that they act like ‘the whole world is going Jewish!’” Page 5.
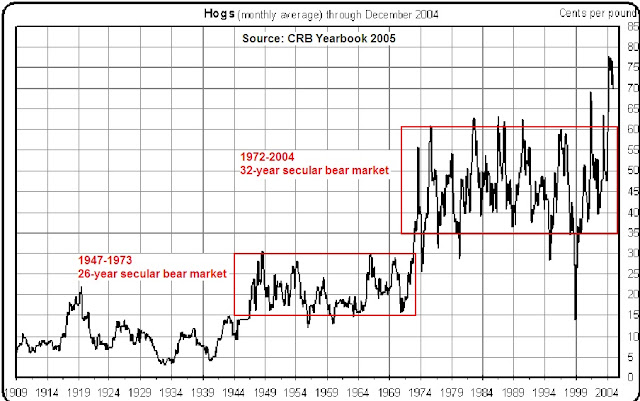
This counters the belief that during inflationary periods, all commodities do well or go up in value. It should be noted that the declines that were mentioned by Russell could have been the equivalent of a temporary pullback or secondary reaction. Interestingly, monthly hog prices traded in a wide range from 1972 to 2004 as indicated in the chart below. Suffice to say, anyone involved in commodity trading should be willing to accept even greater losses than the 50% that we expect for long positions in stocks before seeing any gains.
On the topic of interest rates Russell says the following:

“To the casual observer, it looked like a world embroiled in an interest rate war. And the fact is that rising inflation is being fought all over Europe and Japan- via an interest rate squeeze. The US is a frightened and reluctant follower.

“A few weeks ago Germany raised her bank rate. At the same time Britain boosted her borrowing rate a whopping 2%. Last week the US raised its discount rate an insufficient .5% to a record 10%. Canada immediately followed with a boost to 11.75% in her bank discount rate. The Japan jumped her lending fee to institutions a full 1%.” Page 5.
My thoughts on this passage are that it seems fascinating that the US wasn’t taking the lead in interest rate policy. Especially in comparison to the countries that were mention. It may have been a purposeful attempt to adjust rates when it was absolutely necessary. Could you imagine interest rates jumping 2% at a time?
Russell indicated that as the world’s leading power, the U.S. with its excessive printing of dollars cannot continue unabated. Russell said that foreign holders of dollars would become anxious and “move towards the exits.”
Russell mentions the Gold/Stock ratio; which divides the price of gold by the value of the NYSE Composite. Of the rising trend of the ratio, indicating strength in the price of gold, Russell says:

“Day after day the ratio climbs higher, and it is clear to me that shortly, SOMETHING IS GOING TO GIVE.” Page 5.

With hindsight being 20/20, my thought is that what “gives” in this situation is high inflation unless Russell was proposing that all governments are going the way of hyperinflation. My observation is that what tends to break, when two normally divergent indicators are going in the same direction, is the one that appears to be the “strongest.” In this case the stronger component of the Gold/Stock ratio was gold which had been in a multi-year rising trend while the NYSE had been in a wide trading range for an extended period of time.
I do have concerns about the sensibility of a gold/stock indicator since I have presented the view that gold and stocks usually follow each other rather than move counter to each other. For the most part, we have seen gold lag on declines and lead on rises in the stock market. One thing I’m certain of, if the price of gold rises then the stock market isn’t far behind. There may be an occasional divergence but the overall picture is that gold and stocks generally move in unison.
More:

H&R Block Rumors Fly, Attesting to Its Value

Today it was announced that H&R Block (HRB) was a potential buyout candidate by Liberty Tax Service. On the news, HRB stock jumped 4.50% on trading volume that was 2½ times the 3-month average.
In our opinion, it is no coincidence that the buyout offer, or talk of a buyout, from Liberty Tax Service would come in at or near the exact price that we initiated our research recommendation almost a year ago. Most recently, HRB has been on our Dividend Achiever Watch List since May 21, 2010. However, in a SeekingAlpha.com article on May 19, 2009, we suggested that HRB was an ideal research candidate at a price of $13.73.
Our observation has been that although we recommended selling (HRB) literally days after our initial recommendation, thereby missing the nearly 45% increase in the stock price, if we had held the stock as “long-term” investors we’d have little reason to celebrate at an announced buyout. However, our policy of “seeking fair profits” at the risk of potential tax consequences especially for non-deferred accounts is a sound policy when properly implemented.
An important point about our watch list is that companies may not be undervalued. However, we know for a fact that they are not overpriced. Some have accused the NLO team of “bottom fishing” rather than doing “real” analysis of stocks. However, our applied research and practical experience has demonstrated that when you choose to use fundamental analysis is almost as important as the stocks you us it on.
As we’ve duly noted, all the fundamental analysis in the world will do no good when a stock has reached a new high. In fact, using fundamental analysis to justify a stock purchase that has reached a new high or even in a rising trend undermines the credibility of fundamental analysis. In effect, the numbers begin to lie regardless of the question that is asked.
Based on the use of fundamental analysis, when a stock is rising, if the stock goes up in price then the buyer is convinced that their analysis was accurate. If the price falls then the buyer has to justify the reason why the stock should continue to be held typically on a basis that was may have been flawed from the beginning. If the stock falls out of proportion to all expectation then the buyer of the stock is left with the feeling that investing in stocks must be gambling and those who pursue this effort are fools. There are few valuable lessons to be learned when attempting to apply fundamental analysis to stocks in a rising trend.
Applying fundamental analysis to stocks when they’ve reached a new low however, will quickly tell the investor/analyst whether they are wrong or right in their analysis. Not only can the soundness of the analysis be determined very quickly, you can also determine exactly where the analysis is flawed. All theory about the soundness of fundamental analysis becomes “obvious” to anyone who is willing to observe. For us it also doesn’t hurt that we expect, and look forward to, any recommendation or purchase to fall at least 50% as pointed out by Warren Buffet’s right hand man Charlie Munger.
If the deal for H&R Block never goes through, we know that the company is under priced at the current level. It should be noted that our recommendation of HRB last year just happened to be at the lowest point since May 2001. In addition, our meager 11.50% gain in 18 days surpasses the absence of gains (saved for the annual dividend) since our May 19, 2009 recommendation.
We think H&B Block is at fair valuation when it sells for $18.34. HRB would need to rise by 25% in order to reach fair valuation from today's closing price of $14.61. Any price above $18.34 would be considered a premium in our view.

New Low Option Strategies

It is our pleasure to introduce a new section to our website dedicated to the many requests to apply options to the companies that we track.  Our New Low Option Strategies will provide unvarnished insight into the application of options to Dividend Achievers, Canadian Dividend Achievers, Dow Composite Index and Nasdaq 100 stocks.  We hope you find this feature instructive as we attempt to address an area that has been requested of us for quite a while.  Although a work in progress, we hope you enjoy our efforts in this new venture.

Email our team here.

Dow Theory

The challenge of the current stock market action based on Dow Theory is the fact that we’ve had many different signals to contend with. First, lets recap the major issues that have been throwing us for a loop so far.
  • Non-confirmation of the intermediate peak of May at point B1, which failed to retest the April peak from the March 9, 2009 low.
  • Failure of the Transports and Industrials to confirm the continuation of the long-term bull trend by giving a non-confirmation at point D in mid-June.
  • Transports not confirming the declining trend by staying above the Feb. 5th low on June 6th at point C1.
The most pressing matter before us right now is the fact that the Dow Industrial decline from the April 26th peak at 11,205.03 to July 2nd at 9,686.48 (point C2). This decline equaled 1,518.55 points, half of which equals 759.28. When adding 759.28 to the July 2nd low of 9,686.48 we get 10,445.76.
On June 18th, the Industrials closed at 10,450.63 and failed to maintain the level. As alarming as the first test was (June 18th), the fact that the retest of 10,445.76 resulted in a peak of 10,366.72 on July 14th at point D2. This demonstrates a large amount of weakness, and resistance, at the halfway point of a large intermediate decline. If the market cannot definitively breach the 10,445.76 level then my bias on the market is bearish. We will be in a bear market, from a Dow Theory standpoint, when, and if, the Industrials and the Transports go below their respective February 5th lows.

Email our team here.

Canadian Dividend Achievers

This list of Canadian Dividend Achievers, published by Mergent's, includes current and former Canadian Dividend Achievers and then ranking the companies based on those closest to the 52-week low as of July 16, 2010. We've updated the stock symbol to connect to the Financial Post, one of Canada's top business publications. You'll find the most complete fundamental information on these companies at the FP website. However, Yahoo!Finance probably has the better long-term charts and historical dividend data. Enjoy.

Name Yahoo Quote FP Quote Price Pct from Yr Low
ENSIGN ENERGY SERVICES INC. ESI.TO ESI $12.33 1.31%
POWER CORP CDA POW.TO POW $26.20 4.17%
POWER FINANCIAL CORP. PWF.TO PWF $27.89 4.26%
TALISMAN ENERGY INC. TLM.TO TLM $16.55 5.35%
IMPERIAL OIL IMO.TO IMO $39.87 5.62%
IGM FINANCIAL INC. IGM.TO IGM $38.80 5.69%
RITCHIE BROS AUCTIONEERS RBA.TO RBA $19.34 6.85%
SUNCOR ENERGY INC. SU.TO SU $32.33 8.09%
GREAT-WEST LIFECO INC GWO.TO GWO $24.50 8.12%
SNC-LAVALIN SV SNC.TO SNC $45.06 8.34%
CANADIAN TIRE CTC-A.TO CTC.A $55.63 9.38%

Email our team here.

Nasdaq 100 Watch List

Below are the Nasdaq 100 companies that are within 10% of the 52-week low. This list is strictly for the purpose of researching whether or not the companies have viable business models. These companies are deemed highly speculative unless otherwise noted.

Sym. Name Price P/E EPS Yield P/B % to Low
GILD Gilead Sciences $31.94 10.24 $3.12 0.00% 4.29 0.35%
NVDA NVIDIA $10.05 20.85 $0.48 0.00% 2.14 1.52%
XRAY DENTSPLY $29.25 15.99 $1.83 0.70% 2.46 1.77%
FISV Fiserv, Inc. $45.60 14.29 $3.19 0.00% 2.31 1.79%
SPLS Staples, Inc. $19.31 17.86 $1.08 1.80% 2.18 2.60%
PAYX Paychex, Inc. $25.67 19.46 $1.32 4.70% 6.83 3.13%
AMGN Amgen Inc. $52.17 11.07 $4.71 0.00% 2.29 3.68%
VRTX Vertex Pharma. $32.47 0 -$3.50 0.00% 6.89 3.90%
ERTS Electronic Arts Inc. $14.79 0 -$2.08 0.00% 1.87 5.19%
ADBE Adobe Systems $27.39 38.47 $0.71 0.00% 2.86 5.31%
FWLT Foster Wheeler $21.52 7.85 $2.74 0.00% 3.28 5.85%
AMAT Applied Materials $12.19 38.09 $0.32 2.20% 2.29 6.18%
HOLX Hologic, Inc. $14.12 25.67 $0.55 0.00% 1.35 6.49%
CA CA Inc. $19.00 12.9 $1.47 0.80% 1.99 6.74%
SHLD Sears Holding $63.23 32.69 $1.93 0.00% 0.87 6.79%
SYMC Symantec $14.59 16.73 $0.87 0.00% 2.62 7.44%
YHOO Yahoo! Inc. $14.90 26.75 $0.56 0.00% 1.67 8.36%
GOOG Google Inc. $459.61 20.92 $21.97 0.00% 4.11 8.53%
LOGI Logitech Intl $14.33 0 $0.00 0.00% 0 8.81%
MSFT Microsoft $24.89 12.9 $1.93 2.00% 4.89 9.50%
KLAC KLA-Tencor $29.23 68.45 $0.43 2.00% 2.34 9.52%
EBAY eBay Inc. $20.09 10.87 $1.85 0.00% 1.95 9.72%
APOL Apollo Group $45.57 11.68 $3.90 0.00% 4.77 9.94%

Watch List Notes

Two stocks of particular interest on this week's list are Dentsply International (XRAY) and Paychex (PAYX).  Both companies are former Dividend Achievers with Dentsply raising their dividend 14 out of the last 15 years and Paychex raising their dividend 20 out the last 21 years.  Both companies have above average compounded annual growth rates of their dividends.  Of the two companies, Paychex (PAYX) appears to be the best value. 
Currently, Paychex is selling slightly below the year 2000 price while Dentsply (XRAY) is selling around the 2005 price.  This means that the value component of PAYX is 5 years ahead of XRAY.  If the shares of PAYX don't rise soon then they are a likely candidate for buyout.  Maybe because the shares of Intuit (INTU) and PAYX have been on divergent paths since October 2008, Intuit (INTU) might be a great acquirer of PAYX.  In either case, XRAY and PAYX would be quality acquisitions for short-term or long term portfolios after considerable research.  These stocks will be profiled in upcoming Investment Observations.
Email our team here.

Our 2nd Annual Reader Appreciation Day

We would like to show our appreciation to everyone who has continued to read our website on a regular basis despite our errors and omissions. This year, we will be giving away a copy of Dow Theory Unplugged: Charles Dow's Original Editorials & Their Relevance Today.  This book contains the original articles written by Charles H. Dow, The Wall Street Journal's editor and founder.  The book is in excellent condition and is almost new.

The following is the review of the book on Amazon.com:

"Dow Theory Unplugged is the most complete collection of Charles Dow's original writing ever assembled.


"Dow Theory is widely credited as the basis for modern technical analysis. Yet its origins, Charles Dow's original writings, have been all but forgotten. Dow Theory Unplugged contains a critical selection of 220 original Wall Street Journal columns from more than one hundred years ago, the raw material that led to the development of Dow Theory and remains relevant for the twenty-first-century trader. In addition, top Dow Theorists, including Richard Russell, Charles Carlson and Paul Shread, contribute modern-day analysis to help you apply Dow principles to your trading practice today.
"Charles Dow understood the markets better than anyone in his own time, and perhaps any time since. As co-founder of the Wall Street Journal and the Dow Jones Indexes, he developed the framework for monitoring market movement that we have been using for the last century. Dow also wrote hundreds of columns in the Journal outlining a groundbreaking market strategy that became the first chart-following systematic approach to investing."

Although billed as a book about technical analysis, you're more than likely to find concepts associated with fundamental stock analysis and economics terms like profits, capital, labor, values, supply & demand, dividends, scarcity, balance of trade, and the effects of easy money policies.  In fact, there are very few references to stock charts.  Actually, the original articles never did contain stock charts.  For this reason, it became necessary, and easier, for future generations to represent graphically many of the concepts that Dow spoke of.
For the next 12 days we will put the email addresses of all confirmed subscribers to our website into a basket. On July 28th, we will randomly select the winner of the book. The email address that is randomly selected will be notified (by email) to obtain the mailing address and the book will be sent within 10 days and arrive at your location through book rate mailing to wherever in the world you are. Additionally, we will publish the winner's first name with the location on our website.
Last year's winner was very pleased to receive Robert Rhea's book Dow's Theory Applied to Business and Banking
Thanks again for reading our website and tell a friend.

Email our team here.

Tracking Individual Stock Recommendations on Seeking Alpha

On a regular basis, Seeking Alpha profiles a money manager to obtain their insight on the best pick for long or short investment opportunity. Seeking Alpha has provided these insights since late November 2009 until the present. Initially, Seeking Apha called it the “High Conviction” picks and was later changed to “Just One Stock” or “Just One ETF.”
We decided to provide a performance update on the stocks since the beginning of 2010 until the end of June based on the closing price as of July 14, 2010. As some might expect, the results have demonstrated the difficulty of making individual recommendations.
In aggregate, 66% of the stocks declined in value and 34% of the stocks increased in value. Out of the 99 companies that we could verify as recommendations starting on January 2010, the average change was a decline of –7.21%. This is contrasted by a year-to-date (YTD) performance of the S&P 500 and Russell 3000 of –1.79% and –1.26%, respectively. We noticed that stocks recommended with a price below $10 lost an average of –12.66%, significantly about the average for the group. Stocks that were recommended with a price above $10 had losses of –5.65%, reasonably below the average for the group.
Of the best performing stocks, the top two are standouts. The recommendation by Cara Goldenberg at Permian Investment Partners lived up to its top billing. Mrs. Goldenberg’s recommendation of Valeant Pharmaceuticals (VRX) has racked up a return of 40.13% in 141 days. Mrs. Goldenberg is known for having presented her top investment picks to Mr. Warren Buffett. Buffett, being impressed with Mrs. Goldenberg’s selections, invited Goldenberg to Omaha to discuss her methodology.
The other top recommendation was by Jeff Bogue at Bogue Asset Management for his selection of the ETN iPath VIX Short-Term Futures Exchange Traded Notes (VXX) which racked up a stunning 35.40% in 92 days. Although Bogue didn’t advise the use of VXX as a core holding, it was well timed nonetheless.
Below is a list of the 5 best performing stocks that were recommended since January 1, 2010. The list represents the top 15% of all the net positive returns that were recommended on a total return basis (dividends including appreciation.) Select the date to view the original Seeking Alpha interview with the recommended stock.
Best Performing recommendations
Date symbol rec. price as of 7/14/2010 % change
February 24, 2010 vrx $36.76 $51.51 40.13%
April 14, 2010 vxx $19.15 $25.93 35.40%
February 9, 2010 pnk $7.42 $10.03 35.18%
January 25, 2010 move $1.83 $2.30 25.68%
March 1, 2010 boot $15.42 $19.10 23.87%
Finally, we get down to the specifics of those selections that didn’t fare so well since their recommendation. While the possibility does exist for these stocks to come from behind, the challenge is all the more difficult when the starting line is moved back 30% or more. Because money managers are putting their reputation on the line when making individual recommendations it would be useful to put these loses in perspective. Hopefully the stocks in this category can provide us with lessons on how to avoid similar pitfalls. Alternatively, there may be attributes to these companies worthy of your re-consideration.
Below is a list of the 10 worst performing stocks that were recommended since January 1, 2010. The list represents approximately 15% of all the net negative returns that were accrued. Select the date to view the original Seeking Alpha interview with the recommended stock.
Date symbol rec. price as of 7/14/2010 % change
January 11, 2010 apwr $19.11 $8.08 -57.72%
January 12, 2010 cytx $7.22 $4.01 -44.46%
February 12, 2010 aob $4.22 $2.39 -43.36%
February 18, 2010 tlvt $33.41 $19.00 -43.13%
January 13, 2010 lgdi.ob $1.54 $0.90 -41.56%
April 5, 2010 trit $15.48 $9.10 -41.21%
April 16, 2010 ek $7.39 $4.71 -36.27%
April 29, 2010 drys $6.17 $4.06 -34.20%
April 27, 2010 auxl $34.76 $22.92 -34.06%
May 7, 2010 coco $14.27 $9.52 -33.29%
Email our team here.

Meridian Biosciences (VIVO) Gets FDA Approval, Price Jumps

It was only yesterday that we expressed interest in Meridian Biosciences (VIVO).  Today, news came out that VIVO received FDA approval for their Clostridium difficile test.  On the news, the stock jumped 8.28%.  

The most recent (5/28/10) Value Line on VIVO had this to say about the stock:

"Illumigene is an important opportunity. Sales of C. difficile products have been hurt by the commercialization of new molecular tests by peers. In response, Meridian has created its own molecular test, illumigene. This product represents a more sensitive technology and should improve the company’s competitiveness in the C. difficile market. The test was recently launched in Europe and should receive approval in the U.S. before the start of fiscal 2011.

"Shares of untimely Meridian Bioscience should only appeal to income oriented investors. The stock’s generous yield appears to be secure, as management has stated its preference for a dividend-to profit ratio of at least 75%."
There are a couple of things that I like about what Value Line said about VIVO.  First, VIVO is on track by getting approval for the test before the fiscal year end on September 30th.  The company is meeting their goals as planned.  Second, Value Line doesn't really like the shares.  This is great because institutional momentum hasn't gained traction yet.  With a dividend yield of 4.16% after the price increase today, VIVO is still worthy of consideration.  The stock goes ex-dividend at the end of this month so get as much research in as you can.
As always, if we were to buy this stock at the current price it would be with the expectation that the shares could drop 50% and we'd be able to sleep comfortably at night.  Keep an eye out for our Dividend Achiever Watch Lists, they contain many gems that have yet to be discovered by the broader market.

Odds and Ends

Question:
Do you think Richard Russell has been overrated regarding his abilities to forecast the directions of the markets? It seems like one good call (1975) allows one in his position to reap benefits for years despite demonstrating no skill when one goes back and, with the benefit of hindsight, takes a critical look at the entire record.
Our Thoughts:
Anyone, including NLO team, who attempts to predict the stock market is under extraordinary pressure. The challenge that Russell presents is that he often ignores that he has a bias towards the market falling rather than rising. This becomes a problem when, against his experience and better judgment, Dow Theory might be indicating that the direction is up despite all the negative market fundamentals.
Again, Dow Theory is supposed to include all the current and foreseeable hopes and fears as it relates money. I think that if Russell would follow Dow Theory or even his PTI indicator more often he would get a more accurate readings on the market.
It should be noted that within the content of his Dow Theory Letters from 1958 to the present, there are many great calls.  As I post more reviews of Russell’s letters, I will be able to point out too many instances of where Russell was spot on.
Unfortunately, Russell often didn’t stick to his guns or he forgot his earlier good advice or information. As an example, Russell talks about the importance of compounding. This cannot be accomplished if you’re buying and selling based on Dow Theory. Another example is Russell’s commentary on values. You can’t speak of values if you’re primarily focused on ETFs, index funds or stocks that don’t increase their dividends when plenty of them exist.
The pace and excitement of the markets become challenging for anyone to remain focused on the fundamentals. Russell has fallen astray of the basic principals of Dow Theory and value investing. Although the two seem mutually incompatible, there is a middle ground which Russell hasn’t attempted to address in all the years of his work.
Question:
I'm curious that you write "In my observations, market volume has increasingly become an addendum to Dow Theory." Meaning, only as a sidelight, or as an increasingly important variable? It does seem harder to judge given increased manipulation on light volume. Looks like lots of stick saves last week.
Answer:
It may be a function of the markets being driven by various large institutions (mutual funds, hedge funds, index funds, ETFs etc...) but volume seems to be less reliable when trying to determine sentiment and trends on the NYSE. I suspect that the diminished impact of smaller participants and derivative markets have had a lot to do with my concerns about volume not being a strong indicator. However, I will continue track volume just in case.
Question:
What did you do with the proceeds from the sale of WTR?
Answer:
After investing in WTR we recommended CEPH and SVU which generated 13% and 11% gains respectively. Both stocks were on our Watch Lists and in each case we accomplished our targets and made subsequent sell recommendations. In addition to our posted recommendations, we also participated in CWT and GENZ. Both positions accomplished our short-term after tax goals which allowed for the purchases of new stocks on our dividend Watch List.
Our article titled “Meridian Biosciences and Other Profitable Market Lessons” provides a framework for the strategy we’d like to employ when investing in Dividend Achievers. Another article that weighs heavily on our investment decisions is titled “It Isn’t Easy Being Green.” That article outlined Hetty Green’s approach to handling her funds when not invested in stocks. We’ve simply applied a similar strategy to Dividend Achievers and Nasdaq 100 stocks at a new low (after careful analysis).
Question:
Would you venture to provide a top pick from your current dividend achievers list?
Answer:
As you can tell, the current list has too many companies that are candidates for investment. Without providing any detailed analysis,  I would say that my top four choices for additional research would be Ritchie Bros Auctioneers (RBA), Northern Trust (NTRS), Dentsply (XRAY), and Meridian Biosciences (VIVO).  We expect, and hope, that the price of these stocks will fall further while we get more research in.  We're using the March 2009 low as our benchmark for all investment analysis going forward and we hope that you do the same.
Russell Blurb:
For what it is worth Richard Russell’s commentary today (July 12, 2010) seems to fly in the face of the commentary that he gave on Friday July 9, 2010. Go figure:

“The recent non-confirmation by the Transports may have served as an entry spot for bold speculators, but I doubt if the 2007 highs in the Averages will be approached or bettered. Nevertheless, we may see a brief period of better markets, a "breather" in the long life of the bear. I believe this primary bear market will extend into 2016.

A near-term marker or target is to see whether the Dow and the Transports can better their recent June highs. Those highs were 10450.64 for Industrials and 4467.25 for Transports. Write those figures down. I'm betting that the two D-J Averages will not be able to better the June highs. Let's wait and see.”

All I can say is, at least he indicated an upside target that matches the one we came up with yesterday.  Can't understand how he was so bullish on Friday and is now sounding so skeptical today.

Email our team here.

Dow Theory and Richard Russell

In attempting to understand Dow Theory it is necessary to follow the best and the brightest on this topic. Over the last 52 years, the brightest person on Dow Theory has been Richard Russell. No single person has been more outspoken on their views on the market using Dow Theory, uninterrupted since 1958, than Richard Russell. So when Richard Russell does an about face on his interpretation of Dow Theory it is worth our time to examine the reasons.

First, it is necessary to provide context around the ideas on Russell’s most recent market call.

  • From November 12, 2007 to January 2, 2009, Russell indicated that we were in a bear market. The Dow went from 12,987.55 to 9,034.69, a decline of -30.44%.
  • From January 5, 2009 to January 12, 2009, Russell indicated that we were in a bull market. The Dow went from 8,952.89 to 6,926.49, a decline of –22.63%.
  • From March 11, 2009 to July 22, 2009, Russell indicated that we were in a bear market. The Dow went from 6,930.40 to 8,881.26, a gain of +28.15%.
  • From July 23, 2009 to May 19, 2010, Russell indicated that we were in a bull market. The Dow went from 9,069.29 to 10,444.37, a gain of +15.16%.
  • From May 20, 2010 to July 8, 2010, Russell indicated that we were in a bear market. The Dow went from 10,068.01 to 10,138.99, a slight gain was registered for the period (<1%).

On July 9, 2010, Richard Russell said:

“When the facts change, I change. To do otherwise would be idiotic. Something occurred yesterday that made me sit up and take notice. We had the non-confirmation by the D-J Transportation Average, a situation that I discussed on the July 5 site.”

“Following the Transport non-confirmation, yesterday the market surged higher, Dow up 274 and Transports up 152. But that’s not all. What I noticed was that yesterday was a 90% up day [up volume versus down volume] — the formula for a bottom.”

According to Russell, the Transports non-confirmation along with a 90% up volume/down volume ratio is what led to the conclusion that the market was indicating that a bottom was in. Russell goes on to recommend buying various ETFs with stop losses. Several problems arise when market action is viewed from Russell’s perspective.

First, Russell has ignored the fact that a trend is in place until a counter trend is signaled. So far, we haven’t had a bear market indication since the March 9, 2009 low. If the Transports were to confirm the Industrials by falling below the February 5, 2010 low, then we’d have our first bear market signal.

Second, when thinking in terms of Dow Theory, market participants have three variables to consider the Dow Jones Transportation index, Dow Jones Industrials and NYSE volume. Volume attributes are considered over a period of time. Single day action on volume should not be the determining factor for considering a bull or bear market. If this is the case, then most market signals could be very misleading. In my observations, market volume has increasingly become an addendum to Dow Theory.

Third, Russell has often disregarded the pure Dow Theory indications that have come along the way since the March 2009 low. It seems that Russell’s understanding of macro issues and his personal experience in the markets has led to his decision to err on the side of caution. However, Russell’s cautious streak has usurped the value of Dow Theory to act as a “…composite index of all the hopes, disappointments, and knowledge of everyone who knows anything of financial matters, and for that reason the effects of coming events (excluding acts of God) are always properly discounted in their movement. The averages quickly appraise such calamities as fires and earthquakes.” (Rhea, Robert, The Dow Theory, page 19).

Next, Russell has set himself up for the need to change his analysis by not thinking through Dow Theory to its conclusion. By calling a bottom at this juncture, Russell has left out the all-important confirmation that is required by the Industrials and Transports. 10,450.64 and 4,467.25 are the new levels that the Industrials and Transports need to surpass before any buying policy should be considered. In addition, after surpassing the referenced upside confirmation points, the next level of resistance is 8% away for both indexes. This means that we could go to the old high and then quickly reverse to the downside if a bull market confirmation isn’t signaled. However, given the most recent market action, our focus should be on the confirmation of the reversal pattern first, then the possible bull market indication.

Another matter of concern is that Richard Russell makes recommendations that don’t address the issue of investing in values. Values are a core tenet of Dow Theory. In fact, when you read Dow Theory Unplugged or Charles H. Dow: Economist, you will find that values, not technicals, are espoused. Russell points his readers to speculative opportunities instead of undervalued stocks which can be held for “the long term” if the bullish assessment happens to be incorrect. Our list of Dividend Achiever stocks at or near a new low addresses the prospect that if we’re wrong there is some recourse. In this case, you get the ability to compound your investment over time with the prospect of capital appreciation.

Finally, our stance on stop loss orders is widely known as indicated in the article “Automatic Orders Don’t Provide Protection” as well as our disclaimer at the end of each sell recommendation. Russell’s recommendation of buying ETFs is reckless at best especially in light of the May 6, 2010 “flash crash.” Adding fuel to the flames is the article titled “ETF ‘Circuit Breakers’ Needed to Stop Flash Crashes: Pros.” Our stance on ETFs is well founded and preceded any discussion of the true risks associated with them on May 6th (“ETF: Mediocrity With No Pretense of Value” and “ETF: Indiscriminant Risk”).

It is likely that perma-bulls will seize on the Russell commentary of July 9th as the heralding of a new-new era in investing. On the other hand, “contrarian investors” will suggest that when Richard Russell, perma-bear that he is, has entered the bull ring then the bull run is definitely over. It is our contention that while Richard Russell might be right about a reversal pattern being in place he is not using Dow Theory.

Our latest views on Dow Theory can be found at the following link (NLO on Dow Theory). Keep in mind that all trends are considered to remain in place until otherwise indicated. So far we are still in a cyclical bull market within a secular bear market

Sell Aqua America (WTR) at the Market

Is it possible that your ship can come not once but twice?  We think so.  This is a situation where shareholders of AquaAmerica (WTR) get to understand exactly what Geraldine Weiss, author of Dividend's Don't Lie, means when she says that a stock trades in its own value range. 
In our research recommendation (found here) of WTR, it just so happened that we managed to pick the proverial bottom in the stock's price.  The stock has not fallen below the level indicated in the last year.  However, in our haste to obtain 10% profits, we sold our position in the stock on our sell recommendation of December 15, 2009.  On an annualized basis, we landed a 79.35% gain on our invested capital in 46 days.  Just a note about our view on investing, we want 10% returns in the shortest time possible with the fallback provision being the compounding of dividends if we happen to be wrong in our timing.
In the chart above, you can see our own buy and sell points along with the two most opportune times to exit WTR after our sell recommendation.  With WTR reaching a new high in the stock price and  exhibiting signs of topping out on a technical basis, it may be worth selling this stock.  If you had bought based on our research your total return so far (including dividends) would be 22.77% or an annualized gain of 33.44%. 
We know for a fact that better alternatives exist in the world of Dividend Achievers based on our Watch List and strongly recommend that you capture the sizable gains that have been made thus far.  An opportunity to cash out now is the equivalent of your ship coming in for the second time since May.