
Members
-
Topics
Archives
-
-
Recent Posts
-
-
-
Investor Education
Market Return After Exceptional Years
Dollar Cost Averaging Tool
Dow Theory: The Formation of a Line
Dividend Capture Strategy Analysis
Golden Cross – How Golden Is It?
Debunked – Death Cross
Work Smart, Not Hard
Charles H. Dow, Father of Value Investing
It's All About the Dividends
Dow Theory: Buying in Scales
How to Avoid Losses
When Dividends are Canceled
Cyclical and Secular Markets
Inflation Proof Myth
What is Fair Value?
Issues with P-E Ratios
Beware of Gold Dividends
Gold Standard Myth
Lagging Gold Stocks?
No Sophisticated Investors
Dollar down, Gold up?
Problems with Market Share
Aim for Annualized Returns
Anatomy of Bear Market Trade
Don’t Use Stop Orders
How to Value Earnings
Low Yields, Big Gains
Set Limits, Gain More
Ex-Dividend Dates -
-
Historical Data
1290-1950: Price Index
1670-2012: Inflation Rate
1790-1947: Wholesale Price Cycle
1795-1973: Real Estate Cycle
1800-1965: U.S. Yields
1834-1928: U.S. Stock Index
1835-2019: Booms and Busts
1846-1895: Gold/Silver Value
1853-2019: Recession/Depression Index
1860-1907: Most Active Stock Average
1870-2033: Real Estate Cycles
1871-2020: Market Dividend Yield
1875-1940: St. Louis Rents
1876-1934: Credit-New Dwellings
1896-1925: Inflation-Stocks
1897-2019: Sentiment Index
1900-1903: Dow Theory
1900-1923: Cigars and Cigarettes
1900-2019: Silver/Dow Ratio
1901-2019: YoY DJIA
1903-1907: Dow Theory
1906-1932: Barron's Averages
1907-1910: Dow Theory
1910-1913: Dow Theory
1910-1936: U.S. Real Estate
1910-2016: Union Pacific Corp.
1914-2012: Fed/GDP Ratio
1919-1934: Barron's Industrial Production
1920-1940: Homestake Mining
1921-1939: US Realty
1922-1930: Discount Rate
1924-2001: Gold/Silver Stocks
1927-1937: Borden Co.
1927-1937: National Dairy Products
1927-1937: Union Carbide
1928-1943: Discount Rate
1929-1937: Monsanto Co.
1937-1969: Intelligent Investor
1939-1965: Utility Stocks v. Interest Rates
1941-1967: Texas Pacific Land
1947-1970: Inventory-Sales Ratio
1948-2019: Profits v. DJIA
1949-1970: Dow 600? SRL
1958-1976: Gold Expert
1963-1977: Farmland Values
1971-2018: Nasdaq v. Gold
1971-1974: REIT Crash
1972-1979: REIT Index Crash
1986-2018: Hang Seng Index Cycles
1986-2019: Crude Oil Cycles
1999-2017: Cell Phone Market Share
2008: Transaction History
2010-2021: Bitcoin Cycles -
Interesting Read
Inside a Moneymaking Machine Like No Other
The Fuzzy, Insane Math That's Creating So Many Billion-Dollar Tech Companies
Berkshire Hathaway Shareholder Letters
Forex Investors May Face $1 Billion Loss as Trade Site Vanishes
Why the oil price is falling
How a $600 Million Hedge Fund Disappeared
Hedge Fund Manager Who Remembers 1998 Rout Says Prepare for Pain
Swiss National Bank Starts Negative
Tice: Crash is Coming...Although
More on Edson Gould (PDF)
Schiller's CAPE ratio is wrong
Double-Digit Inflation in the 1970s (PDF)
401k Crisis
Quick Link Archive
Category Archives: interest rates
Reader Question & Answer
Q: “Wondering if the key is to watch for divergence w commodities and equities?”
Posted in inflation, Interest Rate Monitor, interest rates, Pandemic, Pandemic Roundtrip, Q and A, Wholesale Prices
Tagged members
Interest Rates and Central Banks
On February 13, 2024, we received a thoughtful response from Hanif Bayat to a comment that we made about the rise in real estate prices in Canada.

This response was preceded by the comment from Hanif Bayat, “Maybe Bank of Canada’s too many rate cuts in 2008, while Canadian home prices didn't crash unlike U.S.”
First and foremost, neither the Bank of Canada or the Federal Reserve of the United States have any say in the direction of interest rates. Rate policy is dictated by the markets. The only issue is how long before the central banks respond to the market rates.
We start with the longest running and continuously reported data series [a must for good analysis] on interest rates found at the Federal Reserve Bank of St. Louis (FRED).

Using the “Monthly, Percent, Not Seasonally Adjusted” (TB3MS) data from January 1934 to January 2024, we can compare that to the “Interest Rates, Discount Rate for United States” (INTDSRUSM193N) data from 1950 to 2021.

The “Interest Rates, Discount Rate for United States” is the actual Federal Reserve response to market rates.
What you’ll notice between to the two data sets from 1950 and after is that the Federal Reserve never led the directions of interest rates from a prior peak or trough.


Pick your period and you’ll see the same outcome. Let’s expand this concept beyond the limited period offered by FRED.

If the 90 year history of the data is consistent with the Federal Reserve Bank following the market then we can expand that to the period from 1915 to 1960 for a reasonable period of overlap to confirm the consistency of the claim [THE CLAIM: neither the Bank of Canada or the Federal Reserve of the United States have any say in the direction of interest rates. Rate policy is dictated by the markets] and the data.
The claim of the Fed holding rates at any level “too long” or “too short” is nullified. This extends to the Bank of Canada. Why?
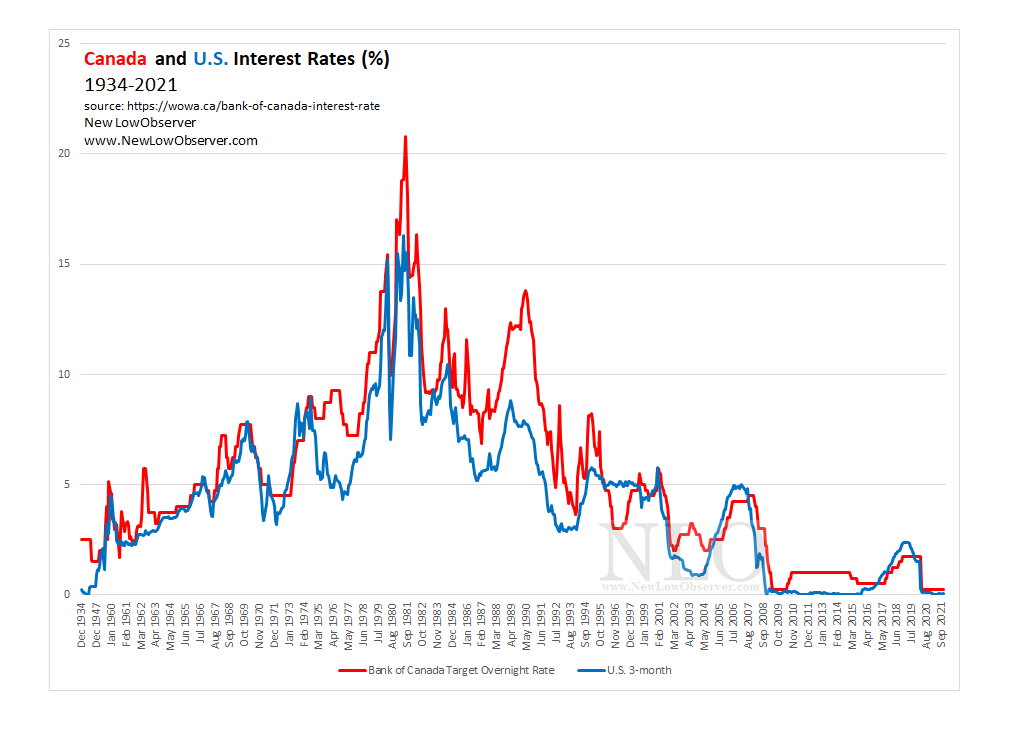
Autonomy of interest rates is a nuanced topic. However, when we zoom out, we can clearly see that the overall direction of interest rates, on a secular basis, between Canada and the U.S. are joined at the hip. This confirms the words of Charles H. Dow (co-founder of the Wall Street Journal) in October 1, 1901:

For this reason, when we see that the Canadian rate environment following the same secular trend as the U.S., then we don’t have to worry about whether or not Canada has any control over their rates. For this reason, the Bank of Canada didn’t hold down rates artificially or too long.
Let’s solidify the idea that central banks have zero say over the secular trend in interest rates. Why? Because we haphazardly referred to the idea earlier but did not nail down the concept.

In the 1947 book titled “Cycles: The Science of Prediction”, Edward Dewey and Edwin Dakin present the idea that there would be a peak in inflation and interest rates in 1979. This assessment is based on the cyclical pattern of rates from 1790 to 1947. In addition to the idea of a peak in 1979 that would be followed by a decline, Dewey had a low set at 2006. Years of work with cycles has taught us that there will be slippage that pushes out any expected peak or trough.
Most important to understand about Dewey’s work ( founder, Foundation for the Study of Cycles) is that it was premised on the data from 1790 and earlier. For the Wholesale Prices from 1790 to 2000 above, the period in red indicates before the modern central bank.
Let’s reinforce the idea that central banks have little impact on the direction of interest rates. The chart below was generously provided by @WinfieldSmart on Twitter from October 12, 2020. Our update to the chart was to simply indicate the period before the Federal Reserve in red.

As can be plainly seen, the direction of interest rates, on average, has been on a vigorous declining trend for the period in question. That interest rates would possibly go to zero and stay there for an extended period of time should not surprise anyone.
Some have proposed that central bank policy is moving the needle for interest rates in the short term and therefore, they do have an impact on interest rates. More specifically, this claim is often associated with the concept of Quantitative Easing (QE) as a remedy for the housing crisis (GFC). Let’s put that idea to rest with the following review of the data.
The concept of modern Quantitative Easing (QE) is thanks to the work of the Bank of Japan. The perceived manipulation of markets with the uses of QE surely must have been the reason that interest rates were held down for so long, right?

In a piece by Henry McMillan and Jerome Baesel from 1988, they projected the direction of interest rates from near double digits rates to negative rates by 2008 to 2022. Remember, this was before the implementation of QE in Japan and the U.S.
Nothing that central banks have done is out of line for what could have been expected from 1988 or 1310. This brings us to the topic of home prices in Canada. That will be our follow-up article in the commentary with Hanif Bayat.
See also:
Posted in Canada, Central Bank, Federal Reserve Bank, interest rates, QE
Twitter Tape: Raising Rates & QT
It was mentioned that in order to save the banking system, it is necessary to raise interest rates.
“Either they raise rates rapidly to save the bond market — or they lose the whole banking system. This will become obvious and existential (soon)”

As we’ve noted in the past, the history of rising rates has been very good for markets under the right conditions. However, the real question is, how is it beneficial to have Quantitative tightening (QT) or a balance sheet unwind?
One of our favorite examples is found in the unwind of the Reconstruction Finance Corporation.

When the government gets out of the business of bailing out, the reverse of the “crowding out effect” takes place. As noted by us:

This is consistent with Dow Theory which says, when the government gets involved, they take away the risk portion of the market. This could mean that the market crashes due to government meddling. However, according to Dow Theory, it typically means that whatever the government got involved in will trade more like a government bond, flat to middling at best.

This concept of trading like a bond can best be seen in nationalization of railroads during the period 1918-1921. This is also seen in the performance of Fannie Mae.

In this case, the wild upside potential before government control in 2008 cannot and will not be seen after government control. This in spite of the fact that from the 2009 lows, Fannie Mae has jumped +600%. Again, contrast that with +6,000% move before 2005.
See also:
Posted in Dow Theory, interest rates, QT, Quantitative tightening, Twitter Tape
YoY: iShares 20-Year Treasury Bond ETF
Below is a chart of the iShares 20+ Year Treasury Bond ETF (TLT) from 2003 to 2021 reflecting the year-over-year (YoY) percentage change.
Interest Rate Cycle Comparison
1940-2020: The Full Interest Rate Cycle

Reasonable assumption on interest rates should be done based on relative or comparable starting points. With interest rates at secular lows, we should only compare rate activity from the 1940 to 1980 period which was a secular rising trend while avoid comparing rate activity to the 1980 to 2008 period.
Fastest Rate Increase, From the Low
Below we compare the rate increase of the 3-Month Treasury from the secular low in 1940 at 0.01% to the rate increases from the 2011 low at 0.01%.

From the level of 0.01% to 2.39%, the rate of increase was exaggerated for the period from 2011 to 2019 compared to the period of 1940 to 1956. The currently level of volatility is not unexpected for the early phase of the secular rising rate trend.
Buffett Buys Japanese Brokerages; Rate Thesis Intact
It was announced that Warren Buffett has accumulated shares of Japanese brokerages.
As we’ve long stated, the secular trend in rates is up:
-
“A single rate increase by the Federal Reserve in no way makes for a trend. However, markets often lead the way and what initially seems “bizarre” is only a natural change in regime, a change that we haven’t seen since the early 1940’s (December 16, 2015.).”
-
“We’ve only included the point in the interest rate cycle that corresponds to the phase that we are entering, coming from an all-time low to an eventual all-time high (November 15, 2015.).”
-
“Investors anticipating a general rise in interest rates should feel some comfort in knowing that most manager(s) in the utility sector are ready for what is to come. Rising interest rates are not an automatic death sentence for utility stock prices or earnings. In fact, the early stages of rising interest rates may see utility stocks match or exceed the returns of non-interest rate sensitive stocks, on a total return basis. Only when the outlook is cloudy will it become difficult to offer projections that are in line with prior expectations (September 4, 2014.).”
We’ve also said that Japan outperforms under such conditions.
With this is mind, maybe this is what Buffett & Co. are seeing for the future of the secular trend and beyond.


Posted in inflation, interest rates, Warren Buffett
Bank Stocks and Rising Interest Rates
On August 6, 2020, we published an article about the trend in interest rates and our expectations for the future. In this posting, we’ll attempt to address the impact of interest rates on bank stocks in a secular rising trend. We’ll provide real world example to highlight the good, bad, and ugly.
All of our work is based on precedent rather than theory. If the conventional wisdom is that stock markets fall when interest rates rise then we check the interest rate cycle and confirm the claim. If the “wisdom” doesn’t hold up we reject the claim and provide evidence.
Interest Rate Cycles
In the case of interest rate cycles, the secular trend is so long that people generally take what they see in the last 30 years and use that as the template for their analysis going forward. Unfortunately, the interest rate cycle, a full peak to peak or trough to trough, is 54 years or more. To gain more background, we refer to wholesale price from 1790 to 2006.

The above chart is from the 1947 book Cycles: The Science of Prediction by Edward R. Dewey and Edwin F. Dakin. Notice how it was predicted that the cycle peak would occur in 1979 (actual 1980) and the cycle trough was predicted in 2006 (actual 2008). These are good reference markers for assessing the quality of analysis.
If, according to Dewy and Dakin, the last secular rising trend was from 1952 to 1979, it would be helpful for us to review the performance of bank stocks in that period to better understand the impact of rising rates. Below, we have provided data from within the rising rate environment to see what the potential outcome could be for bank stocks going forward. Continue reading
Posted in Bank of America, bank stock, banking, Corn Exchange Bank, interest rates, National City Bank
Tagged members
Rising Secular Trend in Interest Rates
As we have long advocated, the declining trend in interest rates is coming to an end and the secular trend in rates is up. To provide a decent level of analysis on what might happen going forward, we have a comparison of the Dow Jones Industrial Average to the 3-month Treasury from 1934 to the peak in May 1981.

Conventional wisdom says that as interest rates rise then stocks should underperform. However, when contrasted to the interest rate sensitive Dow Jones Utility Average, we see that the index increased +1,321% from the April 1942 low to the March 1965 peak.
We contrast the change in the Dow Jones Utility Average to the 3-month Treasury to highlight what happened to the price of Silver in the same secular trend.

Historically, it is understood that rising interest rates mean rising commodity prices. In the last secular trend, the price of silver increased modestly until, in the late stage of the cycle, all commodity prices go wild. We believe that such a trend is likely to occur again.
Our general conclusion on the secular trend in rising interest rates is that the best alternative in the initial stages is stocks and commodities in late stage of the same trend.
“For the past 25 years the commodity market and the stock market have moved almost exactly together. The index number representing many commodities rose from 88 in 1878 to 120 in 1881. It dropped back to 90 in 1885, rose to 95 in 1891, dropped back to 73 in 1896, and recovered to 90 in 1900. Furthermore, index numbers kept in Europe and applied to quite different commodities had almost exactly the same movement in the same time. It is not necessary to say to anyone familiar with the course of the stock market that this has been exactly the course of stocks in the same period ( source: Dow, Charles H. Review and Outlook. Wall Street Journal.February 21, 1901.)”
Fed Balance Sheet Unwind and Market Rise
In the period from 2013 to 2019, the Federal Reserve was actively in the process of unwinding their balance sheet with what we can only imagine was their non-core “assets.”
In the period from 2013 to 2019, counter to the claim that the Fed is THE reason the market has increased from the 2009 low, the stock market, as represented by the Dow Jones Industrial Average, increased +74.10%.

This assessment goes along with our prior work on this same topic making the point that the increase in interest rates would result in a stock market and gold price increase.
See Also:
Posted in Federal Reserve Bank, interest rates
Chart of the Day: Southern California Edison
Below is the annual 52-week low for Southern California Edison (SCE) from 1958 to 1967. We’ve also included the 3-month Treasury Bill as a comparison to show how utility stocks perform against the backdrop of rising interest rates.

In this example, the 3-month Treasury Bill increased from 1.77% to 4.31%. Meanwhile, Southern California Edison (SCE) had a 52-week low range from $15.87 to $31.75.
Posted in 1958-1968, Chart of the Day, interest rates, SCE
Interest Rate Monitor: March 2020
For the last 40 years, interest rates have been in decline. So people can be forgiven when they have the view that the trend is down, it should be down, and if it ever goes up and something goes wrong then the solution must be to cut interest rates.
Unfortunately, during a secular rising trend, cutting interest rates aren’t the solution. Worse still, falling rates ARE THE PROBLEM. Adding QE and stimulus to rate cuts compounds an already bad situation.
Review
We have been unanimous in our view that the secular trend in interest rates is up rather than down and that increasing interest rates are good for the market. Our view preceded the Federal Reserve’s policy of rate increases starting December 15, 2015.
-
“A single rate increase by the Federal Reserve in no way makes for a trend. However, markets often lead the way and what initially seems “bizarre” is only a natural change in regime, a change that we haven’t seen since the early 1940’s (December 16, 2015.).”
-
“We’ve only included the point in the interest rate cycle that corresponds to the phase that we are entering, coming from an all-time low to an eventual all-time high (November 15, 2015.).”
-
“Investors anticipating a general rise in interest rates should feel some comfort in knowing that most manager(s) in the utility sector are ready for what is to come. Rising interest rates are not an automatic death sentence for utility stock prices or earnings. In fact, the early stages of rising interest rates may see utility stocks match or exceed the returns of non-interest rate sensitive stocks, on a total return basis. Only when the outlook is cloudy will it become difficult to offer projections that are in line with prior expectations (September 4, 2014.).”
Current Rate Environment
As we have stated well before rates started to increase, in a secular rising trend in interest rates, going up will be good for stocks and the economy. What this also means is that in a secular rising trend in interest rates, going down will be bad for stocks and the economy. We have depicted the change below.
Rates Going Up

Rates Going Down

We have used the Daily 3-Month Treasury for one simple reason, when it goes up or down, the Federal Reserve ALWAYS follows.
Conclusion
The door has been closed on the rate cutting tool that the Federal Reserve has wielded like a force field against any perceived threat to the economy. However, the reality is that we’re in a secular rising trend in interest rates. ANY additional stimulus (fiscal or monetary) should be looked upon as prolonging the problem rather than improving or fixing the problem.
Posted in Interest Rate Monitor, interest rates
Interest Rate Monitor: October 2019
On November 21, 2015, we said the following:
“While a Fed rate increase is what everyone is waiting for, history suggests that Fed policy (government regulated) follows short-term Treasuries (market driven).”
We made the commentary because we saw that the 3-month Treasury rate was advancing higher.
Since that time, we’ve watched as the Federal Reserve Bank continues to followed the short-term market rates both up and down. After the November 21, 2015 posting, we saw, in December 15, 2015, the Federal Reserve increase the Fed Funds Rate for the first time since June 29, 2006. Again, the Fed Funds Rate increase followed the action of 3-month Treasury.
As with the rate increases in the 3-month Treasury followed by the Fed Funds Rate shortly thereafter, so too did we see the Fed Funds Rate decline after the 3-month Treasury reversed to the downside. As we said in our April 23, 2019 posting:
“If the current run of stability in rates is anything like the period of 2015 to 2016, we should see a sharp drop in rates…”

The chart above highlights the point of our April 23, 2019 claim relative to the actual rate activity that has followed. Most important is the fact that Fed Funds Rate policy did not take place until four months after the peak in the 3-month Treasury. Even after the rate decreased in July 2019, it was clear that the Fed would have to catch up for lost ground which is reflected in the September 18, 2019 rate cut.
Below are the targets that we have set for the 3-month Treasury which will be reflected, in direction only, with the Fed Funds Rate. Continue reading
Posted in 3-month, Federal Reserve Bank, Interest Rate Monitor, interest rates
Tagged members
Chart of the Day: New England Electric Systems
Below is the annual 52-week low for New England Electric Systems (NES) from 1958 to 1967. We’ve also included the 3-month Treasury Bill as a comparison to show how utility stocks perform against the backdrop of rising interest rates.

In this example, the 3-month Treasury Bill increased from 1.77% to 4.31%. Meanwhile, New England Electric Systems (NES) had a 52-week low range from $14.50 to $23.50.
Chart of the Day: Ohio Edison
Below is the annual 52-week low for Ohio Edison (OEC) from 1958 to 1967. We’ve also included the 3-month Treasury Bill as a comparison to show how utility stocks perform against the backdrop of rising interest rates.

In this example, the 3-month Treasury Bill increased from 1.77% to 4.31%. Meanwhile, Ohio Edison (OE) had a 52-week low range from $12.75 to $27.87.
Posted in 10-year Targets, 1958-1968, Chart of the Day, interest rates, Ohio Edison, OSE