Category Archives: QE

Interest Rates and Central Banks

On February 13, 2024, we received a thoughtful response from Hanif Bayat to a comment that we made about the rise in real estate prices in Canada.

image

This response was preceded by the comment from Hanif Bayat, “Maybe Bank of Canada’s too many rate cuts in 2008, while Canadian home prices didn't crash unlike U.S.”

First and foremost, neither the Bank of Canada or the Federal Reserve of the United States have any say in the direction of interest rates.  Rate policy is dictated by the markets.  The only issue is how long before the central banks respond to the market rates.

We start with the longest running and continuously reported data series [a must for good analysis] on interest rates found at the Federal Reserve Bank of St. Louis (FRED).

image

Using the “Monthly, Percent, Not Seasonally Adjusted” (TB3MS) data from January 1934 to January 2024, we can compare that to the “Interest Rates, Discount Rate for United States” (INTDSRUSM193N) data from 1950 to 2021. 

image

The “Interest Rates, Discount Rate for United States” is the actual Federal Reserve response to market rates. 

What you’ll notice between to the two data sets from 1950 and after is that the Federal Reserve never led the directions of interest rates from a prior peak or trough.

image

image

Pick your period and you’ll see the same outcome.  Let’s expand this concept beyond the limited period offered by FRED.

image

If the 90 year history of the data is consistent with the Federal Reserve Bank following the market then we can expand that to the period from 1915 to 1960 for a reasonable period of overlap to confirm the consistency of the claim [THE CLAIM: neither the Bank of Canada or the Federal Reserve of the United States have any say in the direction of interest rates.  Rate policy is dictated by the markets] and the data.

The claim of the Fed holding rates at any level “too long” or “too short” is nullified.  This extends to the Bank of Canada.  Why?

Image

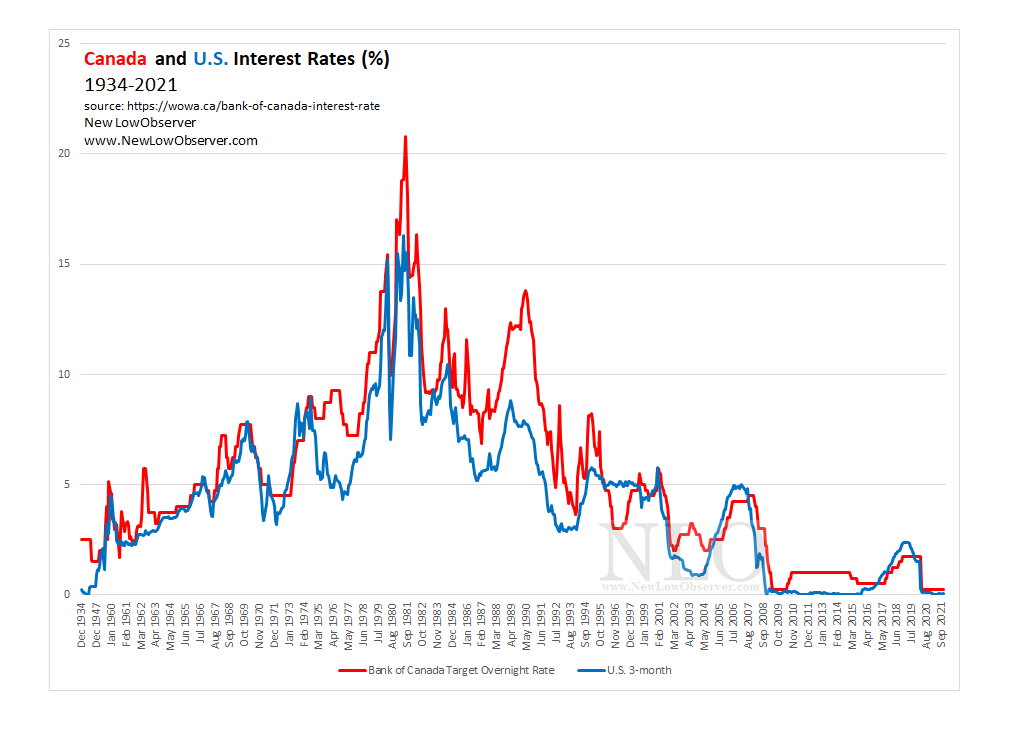
Autonomy of interest rates is a nuanced topic.  However, when we zoom out, we can clearly see that the overall direction of interest rates, on a secular basis, between Canada and the U.S. are joined at the hip.  This confirms the words of Charles H. Dow (co-founder of the Wall Street Journal) in October 1, 1901:

image

For this reason, when we see that the Canadian rate environment following  the same secular trend as the U.S., then we don’t have to worry about whether or not Canada has any control over their rates.  For this reason, the Bank of Canada didn’t hold down rates artificially or too long.

Let’s solidify the idea that central banks have zero say over the secular trend in interest rates. Why? Because we haphazardly referred to the idea earlier but did not nail down the concept.

image

In the 1947 book titled “Cycles: The Science of Prediction”, Edward Dewey and Edwin Dakin present the idea that there would be a peak in inflation and interest rates in 1979.  This assessment is based on the cyclical pattern of rates from 1790 to 1947. In addition to the idea of a peak in 1979 that would be followed by a decline, Dewey had a low set at 2006.  Years of work with cycles has taught us that there will be slippage that pushes out any expected peak or trough. 

Most important to understand about Dewey’s work ( founder, Foundation for the Study of Cycles) is that it was premised on the data from 1790 and earlier.  For the Wholesale Prices from 1790 to 2000 above, the period in red indicates before the modern central bank.

Let’s reinforce the idea that central banks have little impact on the direction of interest rates.  The chart below was generously provided by @WinfieldSmart on Twitter from October 12, 2020. Our update to the chart was to simply indicate the period before the Federal Reserve in red.

image

As can be plainly seen, the direction of interest rates, on average, has been on a vigorous declining trend for the period in question.  That interest rates would possibly go to zero and stay there for an extended period of time should not surprise anyone.

Some have proposed that central bank policy is moving the needle for interest rates in the short term and therefore, they do have an impact on interest rates. More specifically, this claim is often associated with the concept of Quantitative Easing (QE) as a remedy for the housing crisis (GFC).  Let’s put that idea to rest with the following review of the data.

The concept of modern Quantitative Easing (QE) is thanks to the work of the Bank of Japan.  The perceived manipulation of markets with the uses of QE surely must have been the reason that interest rates were held down for so long, right?

image

In a piece by Henry McMillan and Jerome Baesel from 1988, they projected the direction of interest rates from near double digits rates to negative rates by 2008 to 2022.  Remember, this was before the implementation of QE in Japan and the U.S.

Nothing that central banks have done is out of line for what could have been expected from 1988 or 1310.  This brings us to the topic of home prices in Canada.  That will be our follow-up article in the commentary with Hanif Bayat. 

See also:

The “Even Greater” Depression of 1990 to 2019

As the saying goes, “it is a recession when it happens to others and a depression when it happens to you.”

In the last “Great” Depression from 1929 to 1945, Americans were well aware of the pain and misery that was wrought on the nation.  There are even some who wrongly claim that the only reason the United States got out of the “Great” Depression was World War II.  Debates aside, below is a percentage change chart of the Dow Jones Industrial Average from 1929 to 1954, the period of time that it took for the index to get back to “break even.”

image

There is no debate among the average American or Harvard economist about when the last “Great” Depression occurred in the United States.  However, when the exact same thing happens to one of our allies, it seem difficult for even the most esteem experts on the “Great” Depression to recognize the current depression simply because it isn’t happening to us.

That ally is Japan. To put our claim in context, we will show you the stock market of Japan as represented by the Nikkei 225 Index in exactly the same format as the Dow Jones Industrial Average above.

image

Someone please tell us that what Japan is going through isn’t a depression. We use the stock market as the most accurate real-time reflection of the economy, politics, and social well being, which is nothing new to long-time readers of our work.

Let’s reflect for a moment, in Japan from 1989 to 2008:

  • interest rates have been in decline
  • quantitative easing has been applied
  • banks that were among the top 6 of 10 in 1989 are now either defunct or merged into each other

How is it possible, that a key measure of the health of a nation like Japan could suffer so much and not be recognized to be in an “Even Greater” Depression?

Look at the Dow Jones Industrial Average from 1929 to 1954 again.  It took 25 years for the index to break even.  Now look at the Nikkei 225 Index, it has already been 29 years and the index is still –40% below the prior peak.

Let’s take a brief refresher course on what was said of Japan prior to the decline of 1990, this from the Dow Theory Letters as published by Richard Russell and dated May 12, 1989:

image

Or how about the following, dated October 18, 1989:

image

And this from November 29, 1989:

image

And finally, this from April 5, 1989:

image

It is not an uniquely American attribute to forget the past but to blithely walk past the “Even Greater” Depression within our midst while it impacts our ally is a brewing storm.

Investors, politicians, and citizens alike would do well to note the exact same (subtle and not so subtle) slights and invectives being lobbed around today.  Meanwhile, due diligence is necessary to first acknowledge the plight of an ally and act in the interest of both nations before it is too late.

Quantitative Easing: Addition by Subtraction

What is Quantitative Easing?

“Quantitative easing (QE), also known as large-scale asset purchases, is an expansionary monetary policy whereby a central bank buys predetermined amounts of government bonds or other financial assets in order to stimulate the economy and increase liquidity. An unconventional form of monetary policy, it is usually used when inflation is very low or negative, and standard expansionary monetary policy has become ineffective (source).”

Does Quantitative Easing Work?

We don’t think quantitative easing works.  We think that if it works then there should be evidence to support this ideas, little or none exists.  Japan was the “first” country to implement the modern version of quantitative easing in 2001.  That didn’t result in the same outsized change in the Japanese stock market.

However, some people believe very strongly in the idea that central bank policy in the form of quantitative easing meaningfully affects the economy and liquidity.  Surprisingly, the believers are not just fans of central bank intervention but also critics of the existence of central banks. 

What Happens When Quantitative Easing Ends?

Fans of central bank intervention suggest that Quantitative Easing ends when the economy and liquidity has been “restored.”  The assumption is that everything is alright and the economy will chug along as it “should.”

Critics of central banks say the stock market and economy will suffer without quantitative easing.  The view is that, since the market increase was due solely to Federal Reserve “stimulus” then without the injections, interest rate will climb and the stock market should collapse.

While we’re not lined ups as fans of central bank intervention, we believe the critics, mentioned above, are also sorely mistaken in their theory.

A Picture Worth Considering

In an article titled “The Rise and (Eventual) Fall in the Fed’s Balance Sheet” there is a chart depicting the historical level of the Federal Reserve Balance Sheet relative to nominal GDP. The chart, as seen below, potentially implies that, the contraction of the Federal Reserve balance sheet could be the biggest and best thing for the economy and liquidity of the markets.

image

Interpretation

The last peak in the Federal Reserve balance sheet, relative to nominal GDP, was in the period from 1937-1940.  In that period (‘37-‘40), interest rates bottomed out and started a long march to peak in 1981.  Also in that time, from 1940 to 1981, the Dow Jones Industrial Average ranged from a low of 42.42 on April 28, 1942 to a high of 1,051.70 on January 11, 1973 (+2,379.25%).

Also worth noting is the minor decline in the Fed balance sheet relative to nominal GDP from 1917 to 1929.  In  that period, the Dow Jones Industrial Average increased from 69.29 on December 24, 1917 to 380.33 on August 30, 1929 (+448.89%).

The critics of punch bowl economics might be surprised when they find that the exact opposite is likely to happen when the Federal Reserve attempts to reduce their balance sheet AND interest rates increase.  History suggests that taking away the “punch bowl” actually improves conditions for greater market stability and liquidity, for a while at least.  Sometimes, less is more.