Nasdaq 100 Watch List

Below are the Nasdaq 100 companies that are within 20% of the 52-week low. This list is strictly for the purpose of researching whether or not the companies have viable business models or are about to go out of business. These companies are deemed highly speculative unless otherwise noted. -Touc
Symbol Name Trade P/E EPS Yield P/B Pct from Yr Low
First Solar
114.19
15.22
7.50
N/A
3.93
13.17%
Apollo Group
59.93
14.42
4.16
N/A
6.45
13.53%
Gilead Sciences
46.38
16.44
2.82
N/A
6.43
14.18%
Activision Blizzard
10.21
41.67
0.25
N/A
1.14
15.63%
QUALCOMM
38.04
30.53
1.25
1.80%
2.99
16.54%
Electronic Arts
17.26
N/A
-4.06
N/A
2.08
17.02%
Genzyme
55.17
31.45
1.75
N/A
1.89
17.16%
Stericycle
52.00
26.58
1.96
N/A
5.76
17.22%

Market Commentary

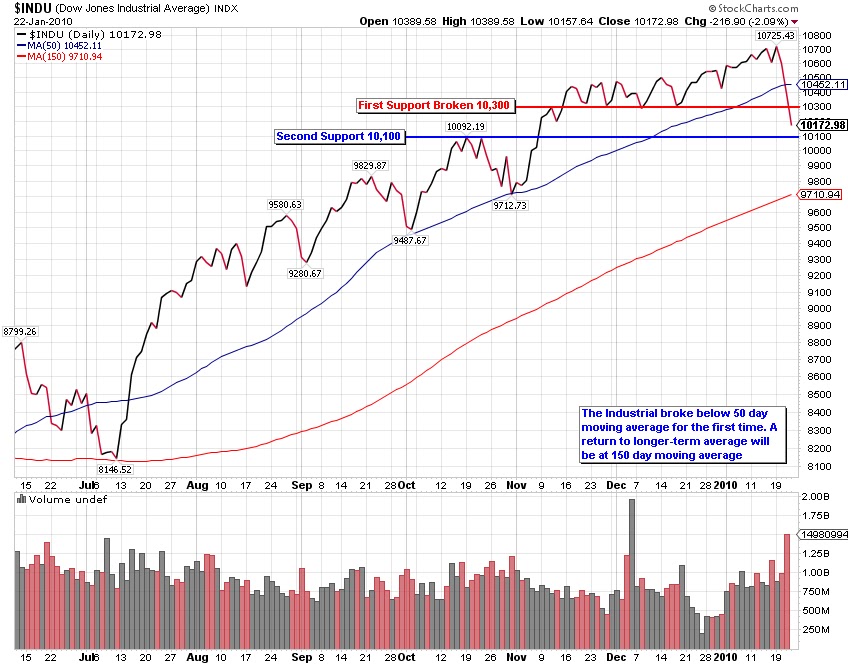
It was a volatile week for the Dow which closed the week 12 points above 10,000. During the week the Dow climbed as high as 10,300 then fell below 9,900. The charts below illustrate things to look out for.
The Dow has gotten support (green arrow) from the 150 days moving average back in July 2009. Another two supports came at the 50 days moving average. Currently, the market showed some strength in being able to rebound off the moving average and closed well above it.
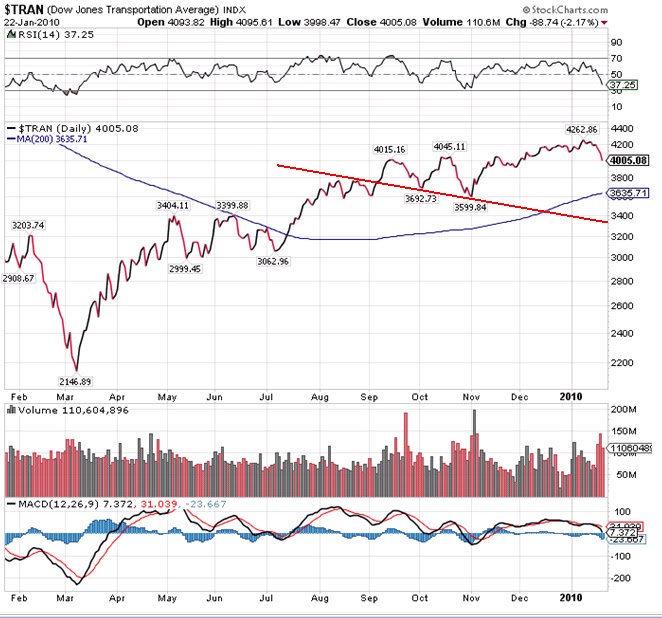
The Transportation index shows a entirely different story. After a strong run up to 4,200 level, the index appears to be getting weaker and weaker. The index was supported back in July but Thursday closed below the 150 day moving average which is bearish. Moreover, the index tried to break above the 150 day moving average but couldn't managed to get through (red arrow).
The two charts above suggest some kind of divergence between the two indexes. I'm not implying that this is a Dow Theory sell signal but that possibility isn't far out given the way the market is behaving. In addition, even if a sell signal is to occurred, it doesn't mean sell all your holdings and go into cash. Similar to a buy signal which investors shouldn't interpret as "all in." Investors should instead focus on seeking fair profits which isn't hard to understand but rather hard to implement.
Short-term rally could come within a week or two as the bottoming in several technical indicators (RSI & MACD) indicated.
I suggest everyone to revisit our article 3 Steps to Investment Success for a better understanding of our investing strategy.
- Art

Dividend Achiever Watch List

At the end of the week, my watch list contains 27 companies compared to 22 companies from the previous week. Here are the companies on my watch list as of February 5 , 2010.

Symbol Name Price % Yr Low P/E EPS Div/Shr Yield Payout Ratio
THFF First Financial Corp 27.45 3.47% 15.00 1.83 0.90 3.28% 49%
XOM EXXON MOBIL 64.80 4.75% 15.09 4.29 1.68 2.59% 39%
SHEN Shenandoah Telecom 17.09 6.15% 27.56 0.62 0.32 1.87% 52%
CWT CALIFORNIA WATER 36.03 7.58% 18.02 2.00 1.19 3.30% 60%
SRCE 1st Source Corporation 14.93 7.88% 18.90 0.79 0.60 4.02% 76%
RBCAA Republic Bancorp, Inc. 15.73 9.46% 7.79 2.02 0.53 3.37% 26%
WTR AQUA AMERICA INC 16.92 9.94% 22.26 0.76 0.58 3.43% 76%
AWR AMER ST WATER 32.74 10.01% 20.21 1.62 1.04 3.18% 64%
NTRS Northern Trust Corp 50.54 10.40% 15.84 3.19 1.12 2.22% 35%
WGL WGL HOLDINGS INC 31.63 10.63% 13.23 2.39 1.47 4.65% 62%
UMBF UMB Financial Corp 37.60 11.74% 17.90 2.10 0.74 1.97% 35%
NWN NORTHWEST NAT GAS 42.23 11.99% 14.61 2.89 1.66 3.93% 57%
WEYS Weyco Group, Inc. 22.61 12.43% 22.61 1.00 0.60 2.65% 60%
SYBT S.Y. Bancorp, Inc. 20.66 12.96% 15.30 1.35 0.68 3.29% 50%
TMP TOMPKINS FINANCIAL 36.22 13.01% 13.46 2.69 1.36 3.75% 51%
FPL F P L GROUP INC 47.40 14.27% 11.94 3.97 1.89 3.99% 48%
WMT WAL MART STORES 53.45 15.00% 15.49 3.45 1.09 2.04% 32%
MON* MONSANTO CO. 76.74 15.28% 27.62 2.78 1.06 1.38% 38%
BCR BARD C R INC 79.92 15.93% 17.37 4.60 0.68 0.85% 15%
NJR N J RESOURCES CP 34.79 16.16% 54.36 0.64 1.36 3.91% 213%
UGI U G I CP 24.70 16.84% 10.47 2.36 0.80 3.24% 34%
MLM MARTIN MARIETTA 78.62 16.91% 29.90 2.63 1.60 2.04% 61%
T AT&T INC. 25.24 17.72% 11.91 2.12 1.68 6.66% 79%
PNY PIEDMONT NAT GAS 24.69 19.39% 14.78 1.67 1.08 4.37% 65%
MGEE MGE Energy Inc. 32.63 19.66% 15.39 2.12 1.47 4.51% 69%
SJW S J W CP 21.86 19.98% 24.29 0.90 0.68 3.11% 76%
SVU SUPERVALU INC 14.59 20.28% 32.42 0.45 0.35 2.40% 78%
27 Companies

*Although Monsanto (MON) isn't a Dividend Achiever, we feel that it has a good potential of becoming one.

Out of this week's list is Pitney Bowes (PBI) which rose 6.8% in one week and raised its dividend from 36 cents to 36.5 cents, an increase of 1.3%.
Back on the list are Piedmont Nat Gas (PNY), San Jose Water (SJW), and SuperValu (SVU). - Art

Electromagnetic Interference: Toyota (TM) Isn’t Alone

The alarm over the recent discovery of braking problems with Toyota (TM) automobiles has garnered a lot of attention in the news for good reason.  After all, the once esteemed car manufacturer that could do no wrong has suddenly been found to have a flaw.  
Some market analysts contend that, as Toyota scrambles to seek ways to offset the PR  damage, companies like Honda (HMC), Ford (F) and General Motors (GM), Hyundai (SEO:005380) and Chrysler Group will benefit from the stumbles of Toyota.  However, the flaw in this case may be a problem which has existed for a long time and has been known to occur among modern devices that require a computer chip and complex electrical components.  The extent of the problem is not limited to Toyota and will be revealed as such in due time.  The problem is known as electromagnetic interference (EMI).
When searching the internet, you can find numerous articles that outline the long existing problem with EMI.  However, it is best to start with the earliest examples of EMI.  During WWII, EMI was commonly known as a gremlin who would take over the electrical system of a fighter plane wrecking havoc on the control systems especially during thunderstorms or highly charged atmosphere.  Like in the movie "Gremlins," you would never want your electrical system to get wet because the problems that you experience would "multiply."  Airplanes have always been most susceptible to EMI issues due to their passage through the atmosphere.
 As our world becomes designed around electronic devices, there becomes the threat that everything we rely upon is at risk of failing to an extent which is irreversible and potentially fatal.  Although the threat is limited it does exist where it didn't exist before.  
It is my opinion that Toyota (TM) is at the leading edge of dealing with EMI while other car manufacturers wring their hands at how to recall their vehicles before the next fatality or serious crash.  In the "Study to Predict the Electromagnetic Interference for a Typical House in 2010,"  the author, Anita Woogara at Bristol University, says:
"Cars and other vehicles now contain many electronic systems. These range from electronic engine management systems to achieve maximum efficiency to electronically operated airbags to protect the driver in the event of a crash. Unfortunately this leaves cars more vulnerable to electromagnetic interference. Mobile phones and passing taxi radios have been known to interfere with Anti-skid Braking Systems (ABS) and airbags, causing drivers to lose control of the car. Car ignition has been changed recently to a short high voltage spark, although better for exhaust emissions this causes wideband interference. As the car industry is very competitive, cutbacks are often made on the wiring, which increases the risk of susceptibility.
  • The inclusion of computers in cars for navigation purposes will also increase the susceptibility.
Automobiles are covered in the Automotive Directive; this excludes them from the EMC Directive on sub-assemblies and devices that may be sold separately from the vehicles. All of the systems in the car have to be able to work simultaneously without interference from each other; ignition interference and external radiated interference. However, interference from objects brought into the car, such as mobile phones and laptops, may have been missed out. Additionally, household electronics can be affected by cars outside, in the street or garage, which is especially relevant in houses with small front gardens."
The long standing issues with EMI presents a challenge for those wishing for more sophisticated electronic devices in, and around, their vehicles.  I suspect that Toyota will emerge from this matter in a far better position than most market analysts expect.  Toyota's problems, especially with the Prius, reflect the highly advanced nature of the automobiles that they create.  Anyone willing to compete against Toyota will be faced with trying to solve the EMI dilemma while integrating highly advanced electronic devices and features.

Back of the Envelope Analysis on Toyota (TM)
  • Fair Market Value according to Dow Theory: $89.59
  • Mean Value according to Value Line: $45.20
  • Oversold at:$60 and below
 When viewed from the perspective of Dow Theory, we see that TM has struggled with being able to rise significantly above the $89.59 level after rising from the low of $41.17 in early 2003 and then descending from the peak of $138 in February 2007.  We can expect that the current downside target for TM will be around the double bottom of $56 set in March of 2009.

-Touc

Sell Abbott Labs (ABT) at the Market

It is now time to recommend that Abbott Labs (ABT) be sold at the market. The stock has performed moderately since the stockwatch/investment observation was issued on September 24, 2009. It is highly recommended that anyone who bought the stock based on our insight should re-read the posting. Unfortunately, it was not possible to buy this stock at any price lower than on the recommended date.

ABT's stock price has gone nothing but up since the recommendation. However, in the pursuit of "seeking fair profits" the returns that this stock has provided within the last 133 days say that it is necessary to consider alternative opportunities. The key to investment success and a key principle of economics is to seek the best alternatives.

ABT was recommended when it closed at $46.94 on September 24th. As of February 3, 2010, ABT was quoted at $54.60. Based on yesterday's closing price of $54.44, ABT has gained 16.80% (including reinvested dividends.) The annualized return on this position would be close to 46%. Selling this stock now generates a return of 4.94x greater than the amount of the dividend yield if held for a full year. Additionally, the 16.80% gain exceeds the return on a 30-year treasury purchased on September 24, 2009 by 4.01x (if held to maturity.)

Those not interested in following through with our sell recommendation can feel comfortable knowing that ABT is a great long-term holding with a 16.80% downside cushion since our investment observation. As the price of ABT rises, it should be noted that the stock faces significant upside resistance at $56.50, $57.50 and $60.

As we have indicated in the purposes and function of this site, our goal is to:

  • maximize the annual yield of each trade.
  • reduce time between buying and selling of each stock.
  • exceed the annual yield of government guaranteed alternatives in each trade.
Investment observations are intended to be a starting point for investigating a quality company at a reasonable price. It is hoped that after doing the background research you can buy the stock at a lower price. Ideally the stock should be held in a tax deferred account and should not consist of less than 20% of your holdings. Personally, we prefer holding only 2-3 stocks at a time.

Sell recommendations are intended to deal with the short term reality of the market. The tracking of the Sell recommendations are the worst case scenario if you happen to have bought a stock at the time the Investment Observation was made (please avoid making this mistake.) We aim for mediocrity in our returns, therefore we are happy with 9-12% annual gains. However, since codifying this approach to investing in 2005, we have had annual returns of 20% and above every year since.

It is always recommended that when selling a stock, one should not place stop orders, limit orders or orders after hours. This leaves the seller in the position of being vulnerable to the whims of the market makers. Instead, place your sell orders only as a market order during market hours. Some would complain that a market order during market hours might leave some profits on the table. However, we would rather leave some money on the table rather than have it taken away from us by the trades that are placed by institutions and market makers.

-Touc.

Nasdaq 100 Watch List

Below are the Nasdaq 100 companies that are within 20% of the 52-week low. This list is strictly for the purpose of researching whether or not the companies have viable business models or are about to go out of business. These companies are deemed highly speculative unless otherwise noted. -Touc
Symbol Name Price P/E EPS (ttm) Yield P/B % Yr Low
First Solar
113.30
15.10
7.50
N/A
3.96
12.29%
Electronic Arts
16.28
N/A
-4.06
N/A
2.05
14.33%
Apollo Group
60.59
14.58
4.16
N/A
6.67
14.78%
Genzyme Corp
54.26
30.94
1.75
N/A
1.89
15.23%
Activision Blizzard
10.16
41.47
0.25
N/A
1.15
17.19%
Gilead Sci
48.27
18.67
2.59
N/A
7.59
18.83%
Stericycle, Inc.
52.91
27.05
1.96
N/A
5.81
19.27%
Ryanair
25.98
N/A
-
N/A
N/A
19.34%
QUALCOMM
39.19
41.17
0.95
1.70%
3.33
20.07%

Dividend Achiever Watch List

At the end of the week, my watch list contains 22 companies compared to 21 companies from the previous week. Here are the companies on my watch list as of January 29, 2010.

Symbol Name Price % Yr Low P/E EPS Div/Shr Yield Payout Ratio
THFF First Financial Corp 27.60 4.03% 15.08 1.83 0.90 3.26% 49%
XOM EXXON MOBIL CP 64.43 4.15% 15.01 4.29 1.68 2.61% 39%
SHEN Shenandoah Telecom 17.20 6.83% 27.74 0.62 0.32 1.86% 52%
WTR AQUA AMERICA INC 16.59 7.80% 21.83 0.76 0.58 3.50% 76%
CWT CALIFORNIA WATER. 36.32 8.45% 18.16 2.00 1.18 3.25% 59%
SRCE 1st Source Corporation 15.25 10.19% 19.30 0.79 0.60 3.93% 76%
NTRS Northern Trust Corp. 50.52 10.35% 15.84 3.19 1.12 2.22% 35%
WGL WGL HOLDINGS INC 31.73 10.98% 13.28 2.39 1.47 4.63% 62%
AWR AMER ST WATER 33.22 11.63% 20.51 1.62 1.04 3.13% 64%
WEYS Weyco Group, Inc. 22.56 12.18% 22.56 1.00 0.60 2.66% 60%
MON* MONSANTO CO. 75.88 13.99% 27.29 2.78 1.06 1.40% 38%
NWN NORTHWEST NAT GAS 43.37 15.01% 15.01 2.89 1.66 3.83% 57%
WMT WAL MART STORES 53.43 15.52% 15.49 3.45 1.09 2.04% 32%
RBCAA Republic Bancorp, Inc. 16.61 15.59% 8.22 2.02 0.53 3.19% 26%
SYBT S.Y. Bancorp, Inc. 21.19 15.86% 15.70 1.35 0.68 3.21% 50%
UGI U G I CP 24.51 15.94% 10.39 2.36 0.80 3.26% 34%
FPL F P L GROUP INC 48.76 17.55% 11.81 4.13 1.89 3.88% 46%
MLM MARTIN MARIETTA 79.18 17.74% 30.11 2.63 1.60 2.02% 61%
T AT&T INC. 25.36 18.28% 12.59 2.02 1.68 6.62% 83%
PBI PITNEY BOWES INC 20.92 18.73% 10.84 1.93 1.44 6.88% 75%
BCR BARD C R INC 82.89 20.23% 16.60 4.99 0.68 0.82% 14%
HSY THE HERSHEY CO. 36.43 20.35% 21.29 1.71 1.19 3.27% 70%
22 Companies

*Although Monsanto (MON) isn't a Dividend Achiever, we feel that it has a good potential of becoming one.
New addition to this list worth noting is Martin Marietta Materials (MLM)

Side note: we are beginning to see earnings normalize as earning season progresses. The changes are noticeable in the S&P 500 where P/E went from 70 to 45 to 31.  I wonder if the addition of Berkeshire Hathaway (class B) to the index has anything to do with it. What's more important is the dividend yield which we, NLO, believed to be the best gauge for market valuation. The Dow is yielding 2.7% and the S&P 500 is yielding 2.16%. Burlington Northern Santa Fe (BNI) used to pay out $1.60 in dividend as part of the S&P 500. Berkshire Hathaway doesn't pay any dividend.

- Art

For Traders or Investors Alike: 3 Steps to Investment Success

The secret to stock market investing is that there is no secret. First, you need to find stocks that represent quality companies. Quality companies are those that can compensate you for the period between the time that you buy and the time that you sell. While there are many companies that pay a dividend there are only a few that have been able to increase their dividend through good times and bad. Our focus on Dividend Achievers allows us to concentrate on quality regardless of stock market gyrations.
In our focus on dividends, we have found that the use of company numbers can be manipulated while the dividend payment is either paid or not paid. Of all the financial fraud that has ever existed in the corporate world, I have never known of a revision or recall of dividend payments. The dividend history is the only measure that doesn't lie.
Second, in order to buy low and sell high, an investor needs to focus only on those quality companies that have reached a new one year low in their price. This does not mean that the stock should be bought at the new low. Instead, the investor should determine the viability of the organization as a going concern. Fundamental analysis is one approach that can be used to determine if other investors will realize that the company of interest is undervalued or underpriced. However, fundamental analysis alone should not be the measure to justify our purchase of any stock.
Third, the measure that should be used to determine if a stock should be bought is the amount that the investor is willing to lose given the worst case scenario. We always assume that We’re going to lose at least half of whatever we've invested. This way, we’re mentally prepared for the unexpected. In the best case scenario the stock goes nowhere, in which case we’re very satisfied collecting the dividend. If the stock goes up then we’re pleasantly surprised. If the stock goes down then we’re ready to do one of two things, sell or make the purchase of the second half of our investment cash. We usually hold no more than 5 stocks at a time and try to be 100% invested at all times. Also, we attempt to exceed a return greater than what could be obtained with "guaranteed" returns like treasuries, CDs and money market accounts.
The concepts that we have just outlined are backstop measures. This means that we have given ourselves a wide margin for error before we have committed the full amount of investable funds. This wide margin of error has turned out to be a considerable margin of safety at the same time based on my personal experiences of healthy gains during 2008. This method of investing has kept our money growing during periods that we didn't expect it to. Our success with this approach has been very much to our satisfaction.
I hope you are able to examine the premise of the over-simplified breakdown of our Dividend Achievers investment strategy. Hopefully you can benefit from some, if not all, of what we have learned. -Touc
  • Quality can be found in dividends, a history of increased dividends don't lie
  • Fundamental analysis is used to anticipate other investors reaction, not for the purpose of determining when to buy a stock
  • Since we're no Warren Buffett, we seek a wide margin for error not a wide margin of safety
  • More background on our investment strategy can be found at "About This Site."

Investment Observation: ExxonMobil (XOM) at $65.90

The next and most anticipated investment observation is ExxonMobil (XOM). XOM has been on our new low watch list since October 30, 2009. According to Mergent’s, XOM has increased its dividend 26 years in a row. XOM is described by Yahoo!Quotes.com as “Exxon Mobil Corporation engages in the exploration, production, transportation, and sale of crude oil and natural gas.”
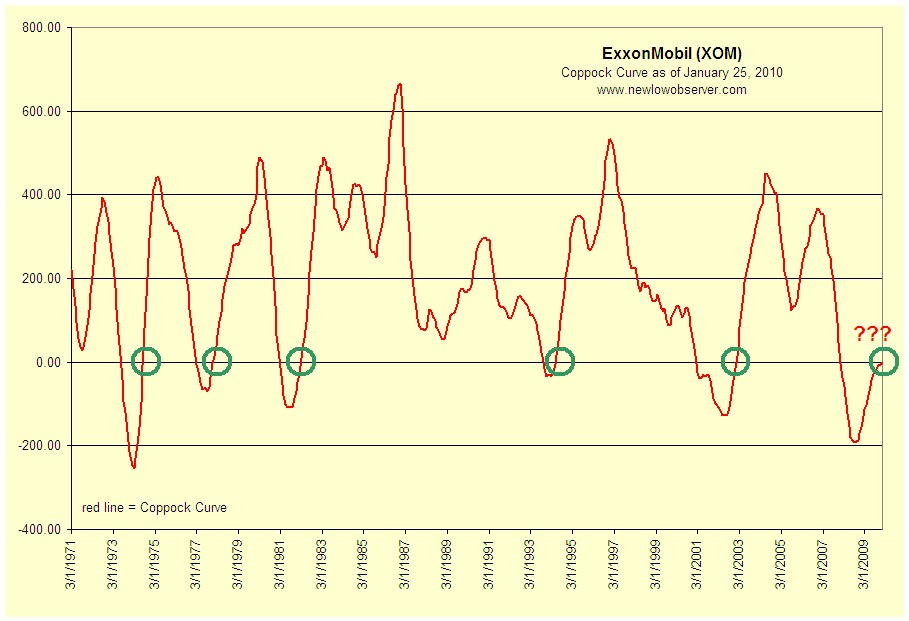
The biggest item regarding this company is the fact that the Coppock Curve is signaling, or is about to signal, an all clear for the purchase of XOM stock. In the chart below, you can see the unique buy signal that is given whenever the stock goes into negative territory and then turns upward. Not until the signal crosses from negative to positive does it indicate the best opportunity to buy XOM.
On the following five occasions, XOM turned decidedly higher:
  • September 1974 up 207% in 2 years
  • January 1978 up 194% in 2 years 10 months
  • March 1982 up 491% in 11 years 1 month
  • June 1994 up 333% in 6 years 6 months
  • February 2003 up 279% in 4 years 8 months
On average, it took 5 years and 3 months to reach the peak in the stock price before a major decline. The worst price decline immediately after the Coppock Curve buy signal was 11% in 1982.
According to Value Line dated June 27, 1997, XOM normally traded at a mean price of 10 times cash flow. In the most recent Value Line dated December 11, 2009, XOM is expected to trade at 8 times cash flow. XOM had a cash flow of $11.58 per share in 2008 and an estimated cash flow of $6.50 for all of 2009. Using the lower cash flow estimate for 2009, XOM is expected to be fairly valued at $52 per share. This is despite the fact that Value Line has a higher cash flow per share for 2010 of $8.45 per share.
Working in favor of XOM is the fact that the company has decreased the number of shares outstanding from 6.9 billion in 1999 down to 4.75 billion at the end of 2009. XOM has gone down a separate path of other companies that borrow in order to lower the number of shares outstanding. Debt remains a small part of XOM’s balance sheet.
One of the most significant elements of the downside risk to this company is the fact that, to this point, we’re in secular bear market. This means that the market could turn down at a moments notice. Therefore, I will use the Dow Theory downside targets based on the price increase from the low of $33.23 in February 2003 to the high of $95.05 accomplished October 2007. The Dow Theory downside targets are:
  • $64.14 (fair value)
  • $53.83
  • $33.23
It remains to be seen how much XOM continues to fall. However, based on the prior Coppock Curve indications, XOM is expected to remain unchanged or fall for another three to six months by about 11% to 18%. However, if you’re willing to buck the trend of the overall market, this stock will make for a great 3 to 6 year holding. Get your research in before the upcoming dividend payment and good luck.

If we were to invest in stocks the way that Charles H. Dow would then we would buy half of the intended amount now and purchase the second half if the price declines. For example, let's say that you wanted to invest $13,180 in this company. What you would do is buy $6,590 worth of stock now (approximately 100 shares) and hold the stock if the price goes up. If the stock goes down then you would invest the remaining $6,590 at the next level that you felt was ideal. This approach works well regardless of the market that you're in as long as you set aside the amount that you intend to invest before making the first purchase. Also, after making the first investment never invest the second half somewhere else.
The purpose of my research recommendations is to point out quality Dividend Achievers that have reached a new 52-week low. From this point begins the research to verify the quality of the stock for both short and long-term investing. These recommendations are within the context of the 3rd year of an 18-year secular bear market. A bear market that I expect to trade in a range between 16,000 and 5,000.

-Touc

Market Commentary

A lot of selling occurred in the market over the past several days. The beginning of earnings season often brings volatility to the market. Sometime for the good and sometime for the bad. I'm not quite sure what will happen but it doesn't hurt for market participants to be a little more cautious.

For the first time since June 2009, the Dow broke below its 50 day moving average for two consecutive days. The support at 10,300 was shattered at the close today so look for 10,100 to be the next level. It's worrisome that the index is far from the 150 day moving average of 9,700 range. What's more interesting and rather worrisome is the fact that the Industrial now closed below the halfway or 50% principal of 10,355 (please refer to Dow Theory posting on 1/10/2010). There are both bull and bear cases to be had.

The Transports broke the 4,050 today and gave us a weak signal going into the weekend.. Because of the Transports prior attempted to break 4,050 level 3 times last year, we are now in the danger zone.

Individually, companies have reported magnificent results. You would think that beating the street estimates would bring shares up but instead the opposite has occurred. Take a look at Intel which reported amazing results last Thursday. Earnings beat the street by 33% ($0.40 vs $0.30). Revenue guidance also came ahead of consensus. Intel shares were trading around $21.50 but now trading around $20.80. IBM is another name that beat the street but shares fell. This could be just tech related headlines. I begin to wonder if some of these names are fully valued.
Despite the negative forces in the market, a name that performed rather well was the one we prompted you to, Supervalu (SVU) which rose 7.6% over this past 5 days compared to the Dow and S&P 500 which lost 5%.

I recalled at the beginning of the week, Jim Cramer was very bullish on the market because Scott Brown won an election in MA. Citing CNBC, "Cramer says a win for Brown in MA could send stocks much higher." If this was the case, how can the Dow lose 435 points?

- Art

Dow Theory

According to Dow Theory the following are the downside targets for the Dow Industrials:
  • 9,324.82 (33% retracement)
  • 8,603.64 (50%)
  • 7,882.44 (66%)
  • 6,440.06 (100%)
The downside targets for the Dow Tranports are:
  • 3,576.92 (33% retracement)
  • 3,213.19 (50%)
  • 2,849.45 (66%)
  • 2,121.98 (100%)
Dow Theory indicates that a retracement of 33% to 66% is consistent with a "normal" correction of the previous upside action. Falling below the 50% retracement would be a market decline with a negative bias while staying above the 50% level would be a positive bias for the market overall.
Dow Theory would work fine if it wasn't for the real world interjecting facts and data from time to time. One issue that is of paramount concern is if the Dow Jones Transportation Index falls below the low set on November 2, 2009. As you look at the chart below, you can see that the Transports have traced out a pattern of lower lows that started on October 2, 2009. If we get much lower than 3,350 on the Transports we could consider this an unofficial, cyclical bear market.

Now that the markets have turned we have a solid perspective to work from. Now may be the time to run the numbers on the companies on our watch lists so that you're ready for when the market makes either a turn to the upside or gives the next bull market indication. -Touc

Nasdaq 100 Watch List

Below are the Nasdaq 100 companies that are within 20% of the 52-week low. This list is strictly for the purpose of researching whether or not the companies have viable business models or are about to go out of business. These companies are deemed highly speculative unless otherwise noted. -Touc
Symbol Company Name Trade P/E EPS (ttm) Yield P/B Pct from Yr Low

FSLR

First Solar

112.39

14.98

7.50

N/A

4.12

11.39%

GILD

Gilead Sci.

46.08

17.82

2.59

N/A

7.31

13.44%

GENZ

Genzyme

54.38

31.00

1.75

N/A

1.90

15.48%

APOL

Apollo Grp

61.19

14.72

4.16

N/A

6.50

15.91%

ERTS

E A

16.77

N/A

-4.06

N/A

2.13

17.77%

ATVI

Activision

10.365

42.31

0.245

N/A

1.19

19.55%

Games People Play…with Statistics

In an article titled "'Avatar' could blow 'Titanic' out of the water on weekend" the Marketwatch.com stretches the imagination of revenue generated by the movie Avatar as compared to the "other" highest grossing movie Titanic.  So far, Avatar has grossed $1.7 billion as contrasted with Titanic's $1.84 billion. 
The oddity is the fact that Titanic was produced in 1998 and although inflation has been very low in the years since, the inflation adjusted value of the $1.84 billion is now $2.4 billion.  MarketWatch.com as part of the Wall Street Journal, now owned by News Corp., should exhibit better quality in their financial journalism. The fact that MarketWatch.com doesn't mention inflation at all only furthers the misinformation that is widely diseminated by the media.  Anyone who may be uninitiated about the nuances of inflation will take fantasy as fact. 
On our site, in the righthand column, you can find two inflation calculators in our "Guaranteed" Rates section.  The first calculator is from the Bureau of Labor Statistics that starts in 1913 ( in an ironic twist the starting year almost implies that inflation began when the Federal Reserve was created.  Of course, we know this isn't true but it seem odd to begin the data in 1913.)  The second calculator goes as far back as 1800 and is based on the CPI figures from the Historical Statistics of the United States.
A good resource for discerning inflated or skewed statistics can be found in the appropriately titled book, "How to Lie with Statistics." -Touc.

Dividend Achiever Watch List

At the end of the week, my watch list contains 21 companies compared to 22 companies from the previous week. Here are the companies on my watch list as of January 22, 2010.

Symbol Name Price % Yr Low P/E EPS Div/Shr Yield Payout Ratio
SHEN Shenandoah Telecom 17.06 5.96% 27.52 0.62 0.32 1.88% 52%
XOM EXXON MOBIL CP 66.10 6.85% 15.40 4.29 1.68 2.54% 39%
THFF First Financial Corp. 28.71 8.22% 15.69 1.83 0.90 3.13% 49%
CWT CALIFORNIA WATER 36.47 8.90% 18.24 2.00 1.18 3.24% 59%
WTR AQUA AMERICA INC 17.14 11.37% 22.55 0.76 0.58 3.38% 76%
SRCE 1st Source Corporation 15.46 11.71% 13.93 1.11 0.64 4.14% 58%
WEYS Weyco Group, Inc. 22.58 12.28% 22.58 1.00 0.60 2.66% 60%
WGL WGL HOLDINGS INC 32.13 12.38% 13.44 2.39 1.47 4.58% 62%
AWR AMER ST WATER 33.52 12.63% 20.69 1.62 1.04 3.10% 64%
NTRS Northern Trust Corp. 52.07 13.74% 13.74 3.79 1.12 2.15% 30%
SYBT S.Y. Bancorp, Inc. 20.87 14.11% 15.46 1.35 0.68 3.26% 50%
WMT WAL MART STORES 52.94 14.46% 15.33 3.45 1.09 2.06% 32%
BCR BARD C R INC 79.44 15.23% 15.92 4.99 0.68 0.86% 14%
FPL F P L GROUP INC 48.14 16.06% 11.66 4.13 1.89 3.93% 46%
NWN NORTHWEST NAT GAS 43.85 16.28% 15.17 2.89 1.66 3.79% 57%
MON* MONSANTO COMPANY 77.89 17.00% 28.04 2.78 1.06 1.36% 38%
UGI U G I CP 25.00 18.26% 10.59 2.36 0.80 3.20% 34%
T AT&T INC. 25.39 18.42% 12.57 2.02 1.68 6.62% 83%
RBCAA Republic Bancorp, Inc. 17.12 19.14% 8.48 2.02 0.53 3.10% 26%
FDO FAMILY DOLLAR STORES 30.36 19.81% 14.19 2.14 0.54 1.78% 25%
HSY THE HERSHEY CO. 36.28 19.85% 21.22 1.71 1.19 3.28% 70%
21 Companies

*Although Monsanto (MON) isn't a Dividend Achiever, we feel that it has a good potential of becoming one.

- Art

Upcoming Ex-Dividend Dates for Dividend Achiever Watch List

Below are the approximate ex-dividend dates for companies that appeared on our Dividend Achiever watchlist dated January 15, 2010. If you happen to be researching these companies for potential investment it would be advisable to consider the ex-dividend date prior to possible purchases. Owning the shares of the company that you're interested in before the ex-dividend date entitles you to the upcoming dividend payment. Owning the shares after the ex-dividend date means that you would have to wait at least three months before receipt of the next payment.
Please verify the ex-dividend date and payout ratio before committing funds to these stocks. Additionally, do not base your next long or short term purchase on the dividend payment or yield. Instead, get as much research in as you possibly can before the ex-dividend date "just in case." Be advised that our Investment Observation of SVU has run up 18.81% in 15 days and will not appear on our watch list until it falls within 20% of the most recent 52-week low. -Touc
Name Symbol % from Yr Low Approx. Ex-Dividend Date
1st Source Corporation
10.19%
2010-01-30
EXXON MOBIL CP
7.82%
2010-02-06
CALIFORNIA WATER SVC
9.53%
2010-01-31
Weyco Group, Inc.
10.99%
2010-02-13
AQUA AMERICA INC
12.80%
2010-02-10
AMER ST WATER
13.17%
2010-02-05
NORTHWEST NAT GAS
16.73%
2010-01-27
SUPERVALU INC
25.47%
2010-02-26
THE HERSHEY COMPANY
19.56%
2010-02-20