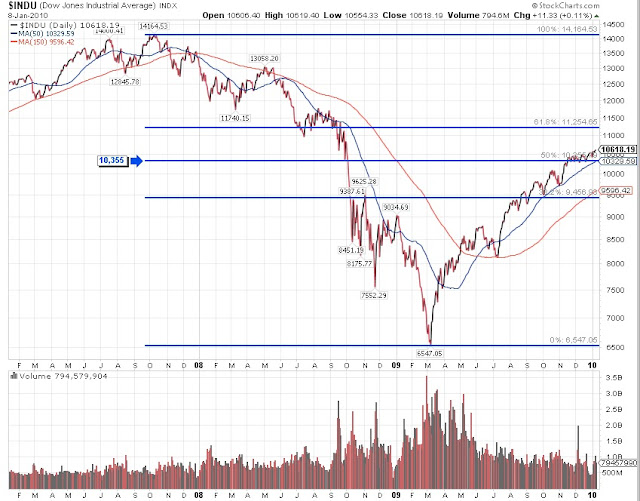
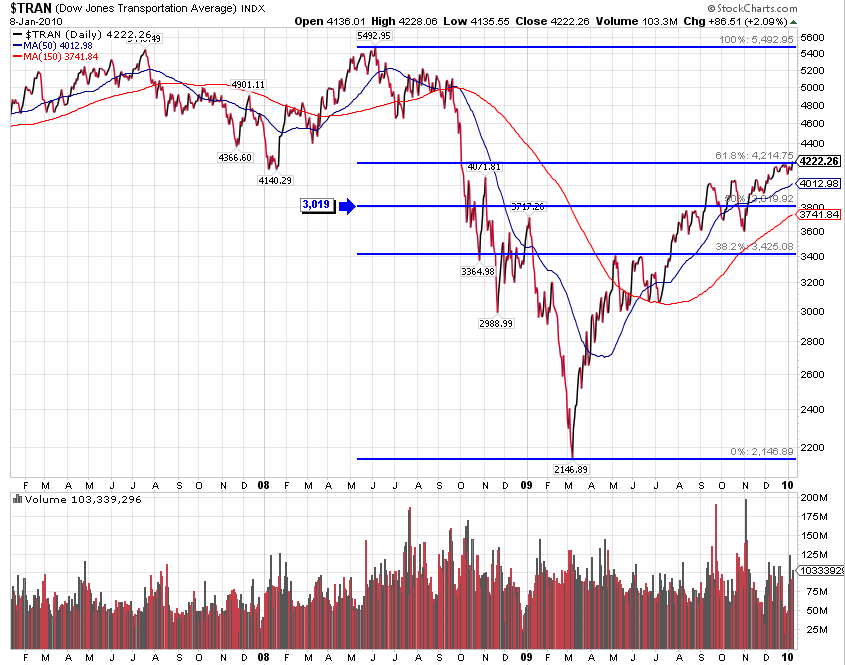
The purpose of this article is to demonstrate how Dow Theory approaches the question of the fair value of a stock. Most investors often hear of an analyst giving a fair value for a stock. Seldom is there ever a full description of the meaning of fair value or how exactly fair value is arrived at. Even when there is a description of how fair value is arrived at most investors have a hard time understanding what exactly it means if a stock they own goes from undervalued or overvalued to fair value.
Another name for fair value is intrinsic value. One source that we would derive our definition of intrinsic value is in Security Analysis by Graham and Dodd. According to a 1962 edition of Security Analysis:
“A general definition of intrinsic value would be ‘that value which is justified by the facts, e.g., assets, earnings, dividends, definite prospects, including the factor of management.’ The primary objective in using the adjective ‘intrinsic’ is to emphasize the distinction between value and current market price, but not to invest this ‘value’ with an aura of permanence. In truth, the computed intrinsic size is likely to change at least from year to year, as the various factors governing that value are modified. But in most cases intrinsic value changes less rapidly and drastically than market price and the investor usually has an opportunity to profit from any wide discrepancy between the current price and the intrinsic value as determined at the same time.
“The most important single factor determining a stock’s value is now held to be the indicated average future earning power, i.e., the estimated average earnings for a future span of years. Intrinsic value would then be found by first forecasting this earning power and then multiplying that prediction by an appropriate ‘capitalization factor.’”
Graham and Dodd. Security Analysis. McGraw-Hill. New York. 1962. Page 28.
The challenge with the definition of intrinsic value is the “facts” as described by Graham and Dodd. First, the valuing of assets could be done above or below their true worth. Second, earnings could be managed or manipulated in a fashion that is inconsistent with the company’s true health. Third, a company’s prospects are subject to vagaries in the market and therefore are not definite. Fourth, depending on the compensation method used for the company’s management, those in charge may act in a fashion that is counter to the continued growth of the company. The only certainty is the payment of dividends that have already taken place. In my experience observing stocks, I have seen the change in management, earnings, prospects and assets but never the change in ex post dividend payments.
Even within the definition of intrinsic value, Graham and Dodd submit to the fact that we cannot expect current conditions to exist into perpetuity. Additionally, the idea of forecasting into the future, “over a span of years,” a company’s earning potential seems to be more hopeful than anything else. The fair value of the company can decline with little more reason than a significant decline in stock price.
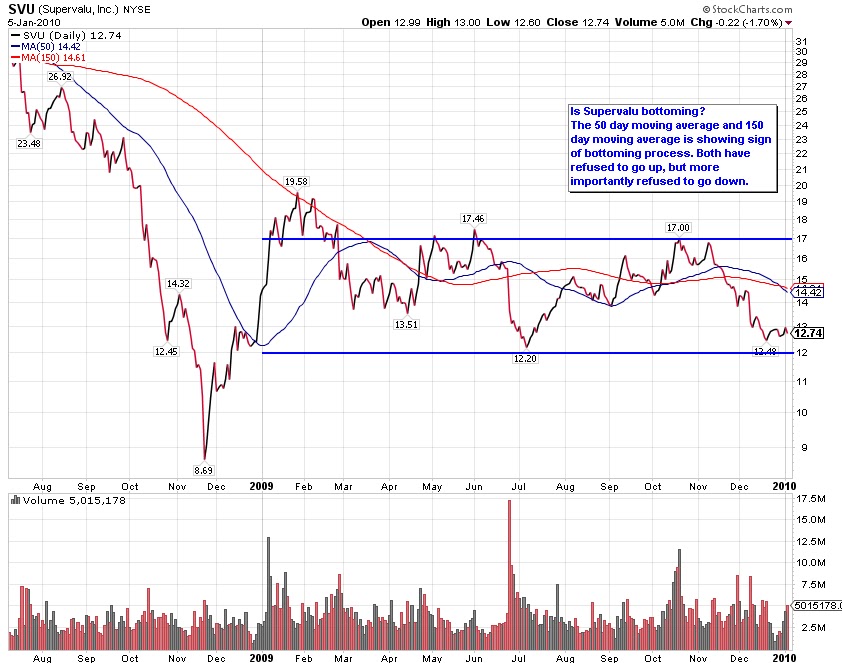
The spurious nature of intrinsic value can be demonstrated in what is known as an impairment charge. Recently there have been two Dividend Achievers that have had impairment charges which have significantly reduced the fair value of the company. In one instance, Supervalu (SVU) noted in their
Form 10-Q filing that the “retail food operating loss for the third-quarter and year-to-date ended November 29, 2008 reflects the preliminary estimate of goodwill and asset impairment charges of $3,250,000 related to the write-down of goodwill and other intangible assets required by Statement of Financial Accounting Standards (SFAS) number 142.” What this means is that because the stock price fell so much in such a short period of time, the company was forced to adjust their fair value lower due to SFAS rule number 142.
In another example, Nacco Industries (NC) stated in their
4th quarter earnings call that, “during the quarter, the company wrote off the goodwill on its books. Because the company stock price at year end was significantly below the company’s books by tangible assets and its book value of equity, accounting rules effectively required the company taking non-cash write-off of goodwill and certain other intangible assets totaling $436 million or 431.6 million net of taxes of $4.1 million the company recorded those pretax charges as follows…” Again, this is an example of accounting rules (SFAS rule No. 142) determining the change in the value of the stock’s fair value.
Although these were “legitimate” changes to the fair value of the companies, one cannot overlook the fact that much of the fair value can be based on interpretation. Also, the timing of the changes can occur at times that are not consistent with the decline in earnings or future prospects. In the two prior examples these declines in fair value were based on the declines in stock price due to the market panic from 2007 to 2009.
Most fundamental analysis of stocks has been done based on the Graham and Dodd method which was codified in 1934 after the stock market crash from 1929 to 1933. Before 1929, there were other methods for determining a company’s fair value. One method that I have studied extensively is the Dow Theory method. Most followers of Dow Theory might not realize it but the “50% Principle,” as coined by George E. Schaefer but elaborated in great detail by Charles H. Dow, is the method for arriving at a stock’s “fair value.”
From a Dow Theory perspective, a company’s fair value is as simple to determine as the prior period of increase or decline in the stock price. However, understanding the nuances will allow for better interpretation of the meaning of fair value according to Dow Theory.
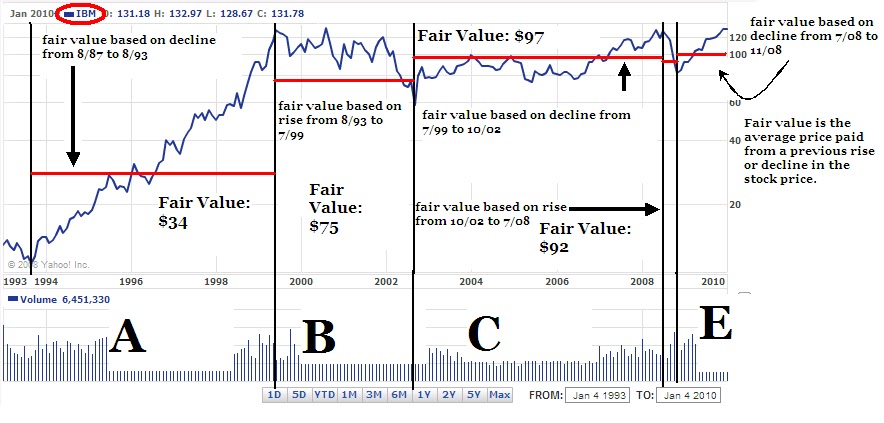
According to Dow Theory, fair value is arrived at based on one half the previous increase in the stock’s price or one half the previous decrease in the stock price. In the
example above, I have selected IBM to show how fair value works according to Dow Theory.
In section A, I have indicated that the rise in 1993 to the peak in 1999 had an established fair value based on the prior decline from 1987 to 1993 (red line.) The prior declining period set fair value for IBM at $34. When IBM went from $10 up to $34 the company’s stock was considered at fair value. Any further increase in price was considered overvalued. Theoretically, any investor who bought the stock below $34 should accept that any further increase in price is icing on the cake.
Because the stock rose from $10 to $140 in the period from 1993 to 1999, a new fair value was established at $75. Section B carried the fair valuation of $75 indicating that anyone who bought the stock below $75 was getting a bargain.
In section C, I have indicated that the decline from 1999 to the trough in 2002 established a new fair value for the following increase at $97. In section C, from the 2002 low to the 2008 high, the fair value became $92. In section D, after the decline from July 2008 to November 2008 the new fair value became $100 in section E.
Each time a stock completes a major decline or increase, a new fair valuation can be established. For the cautious investor, the fair value for the next increase is derived from the previous decline and the increase that preceded the previous decline. This establishes a range that an investor would determine where a stock is fairly valued. A real-time fair value can be determined based on the most recent price trend however, an investor has to accept that, without a turn in the price (confirmation), the position is at significant risk.
Below is an attempt to demonstrate how the process works.
In July 2008, an analyst issued a strong buy report on Lowe’s (LOW) when the stock was trading at $18.90. At the time, the analyst indicated Lowe’s had a fair valuation of $32.27 using an assortment of Graham and Dodd methods. However, if using the Dow Theory method for determining fair valuation, an investor would have arrived at a fair value of $26.92.
Old high of $34.93 set on 2/20/07
[($34.93-$18.90)/2]+$18.90=$26.92
Subsequent to the report that was issued at $18.90, LOW closed at $27.36 on September 8, 2008 and then traded down from that point until it rested at the $13 level in March of 2009. Using the Dow Theory method for fair valuation, an investor would have sold the stock on the approach to $26.92 and then waited to see what would have developed from there. My personal modification to this method is to move on to a different stock altogether.
Unfortunately, a person who followed the analyst recommendation of expecting the stock to go to $32.27, or fair valuation, would have held on regardless of the stock never getting to $32 and instead declining back to $18.90 and below.
Now with LOW at $13, the new fair value, according to Dow Theory, based on the old high of $34.93, is $23.97. Well, from the $13 level, LOW traded up to $24.17 and has since reversed to the downside at the current price of $23.13. Again, the investor following the Dow Theory method would have sold the stock as it approached the $23.97 level.
Anyone who had based their purchase of LOW on July 2008 using the analyst’s future fair value of $32 would have not seen the price come close to predicted fair value.
While not infallible, the Dow Theory method addresses the most primary elements seen by all investors, the price movement. Although background in Graham and Dodd never hurt anyone, fundamentals are, at times, a distraction from what the most uninitiated gambler can see without having to crack open a single investment report. Additionally, an equal number of investors and speculators are on either side of the fair value range. This gives incentive to either buy, hold or sell the stock based on crossing the fair value plane.
Some would ascribe the Dow Theory 50% principle to the use of Fibonacci counts however, R.N. Elliot’s popularization of the application of Fibonacci’s to stock prices didn’t catch on until long after the establishment of Dow Theory. The use of Dow’s Theory in determining fair value gives investors the opportunity to see exactly how much the market discounts everything. It is clear that buying and selling a stock in such a short period of time is considered diametrically opposed to the Graham and Dodd method. However, it would benefit all who wish to obtain a reasonable approximation of fair value to consider the Dow Theory approach. -Touc
- Moves to the downside project fair values for the upside. Moves to the upside project fair value for the downside.

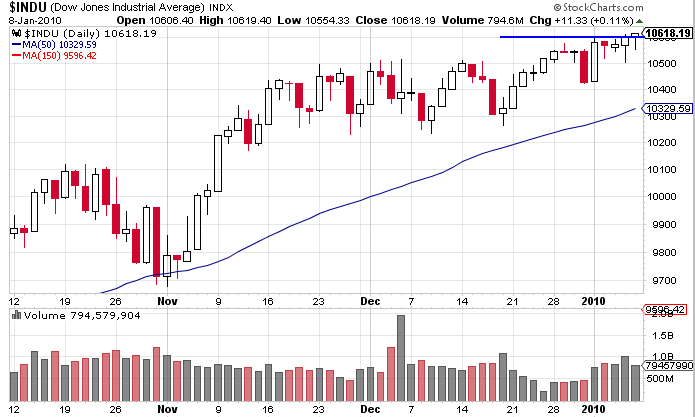
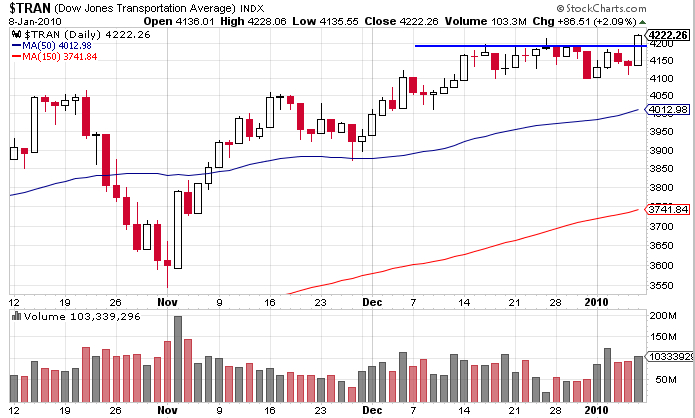
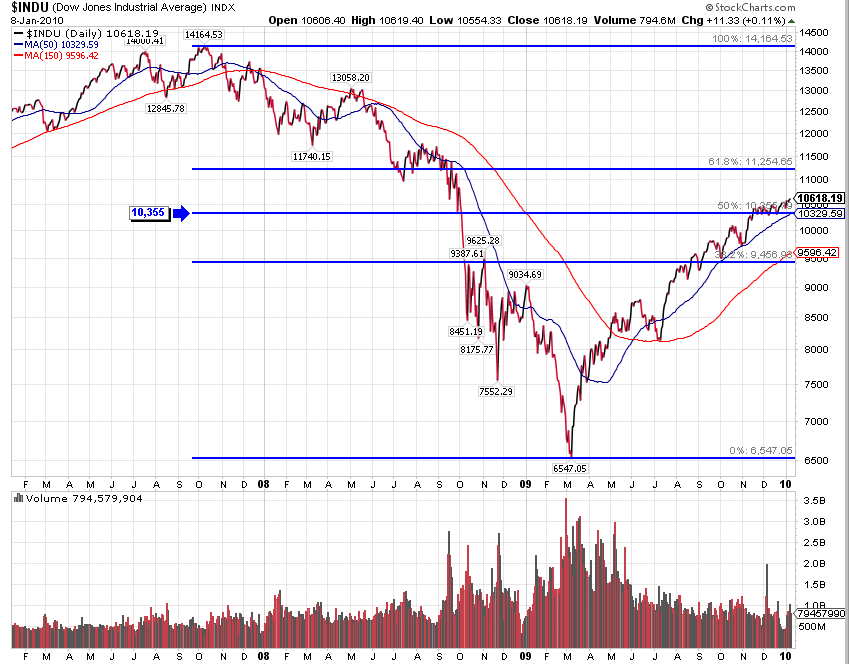
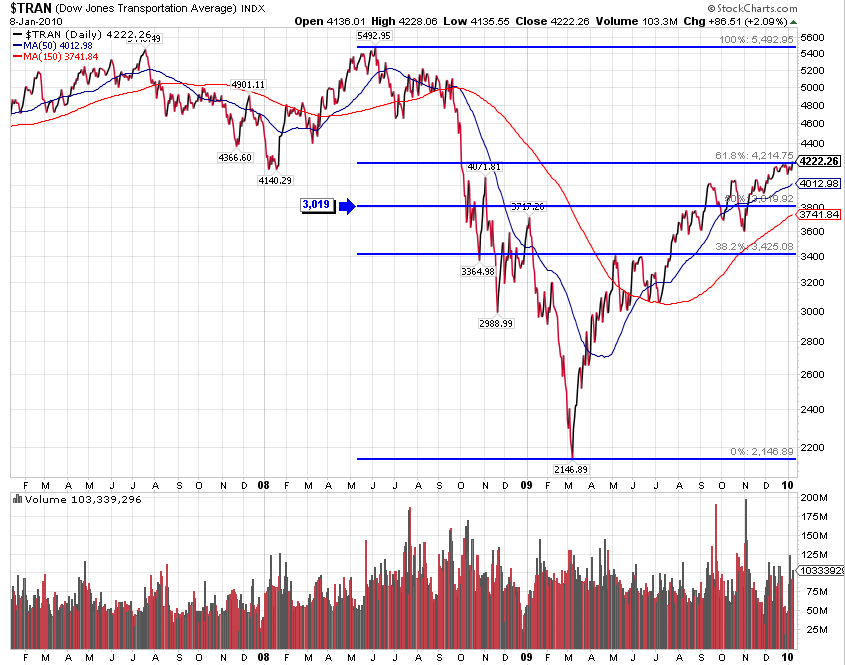
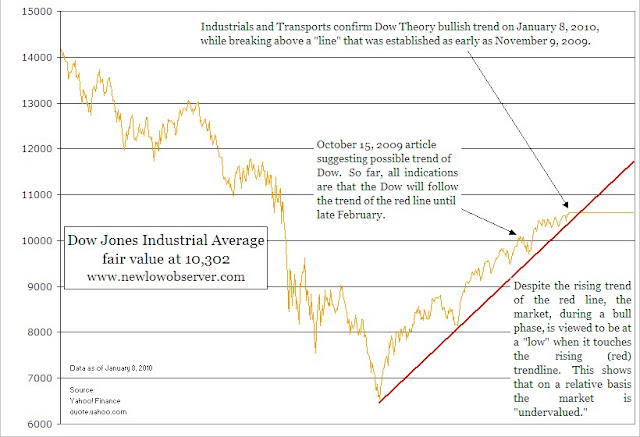
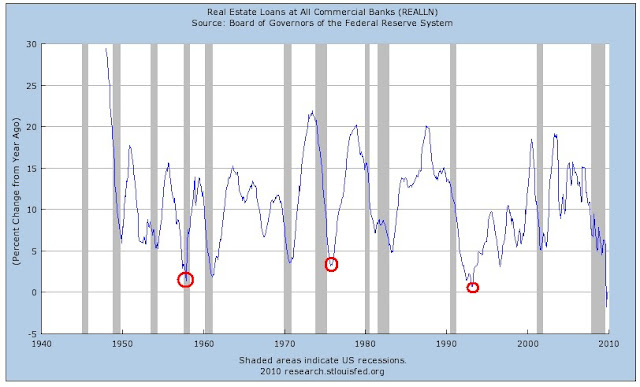 If we haven't hit bottom yet it means that within the year 2010 we will have to go below the previous low prices of 2009. Such an occurrence would be a complete disaster for the financial markets. I am hopeful that the real estate market doesn't further devolve. However, the concern does rest in the back of my mind.