Nasdaq 100 Watch List: April 15, 2011

Below are the Nasdaq 100 companies that are within 21% of the 52-week low. This list is strictly for the purpose of researching whether or not the companies have viable business models. Although theses companies are very risky, they provide significant opportunity to outperform the market in the coming year.
Symbol Name Price P/E EPS Yield P/B % from Low
CSCO Cisco 17.03 12.88 1.32 1.40% 2.08 0.35%
URBN Urban Outfitters 30.64 19.15 1.6 0 3.65 5.55%
TEVA Teva Pharma 50.01 13.65 3.66 1.70% 2.04 6.43%
AMGN Amgen 55.51 11.59 4.79 0 2.13 10.45%
MSFT Microsoft 25.37 10.83 2.34 2.50% 4.41 11.61%
INTC Intel Corp 19.75 9.83 2.01 3.70% 2.18 12.22%
ATVI Activision 11.23 34.03 0.33 1.50% 1.3 12.41%
SPLS Staples 19.98 16.51 1.21 2.00% 2.08 14.50%
MRVL Marvell Tech 15.97 11.92 1.34 0 1.87 15.14%
INFY Infosys 63.21 24.98 2.53 0.70% 7.32 18.64%
CELG Celgene 56.98 30.31 1.88 0 4.43 18.66%
APOL Apollo Group, Inc. 40.1 15.1 2.66 0 4.3 18.81%
AKAM Akamai 38.09 42.13 0.9 0 3.2 18.92%
QGEN Qiagen N.V. 20.37 33.95 0.6 0 1.88 20.82%


Watch List Performance Review

In our review of the Nasdaq 100 Watch List from April 18, 2010, we found that only one company, Genzyme (GENZ), actually outperformed the Nasdaq 100 index.  The remaining 4 companies on the watch list averaged a loss of -0.56%.  When Genzyme (GENZ) is included with the performance of the stocks from last year, the group averaged a gain of 7.98%.

Symbol Name 2010 2011 % Change
GENZ Genzyme 53.64 76.25 42.15%
SYMC Symantec 16.68 18.52 11.03%
RYAAY Ryanair 29.23 29.3 0.24%
ATVI Activision 11.79 11.23 -4.75%
GILD Gilead 45.7 41.7 -8.75%
- - - Average 7.98%
NDX Nasdaq 100 2012.84 2307.58 14.64%

Please revisit New Low Observer for edits and revisions to this post. Email us.

Projecting Downside Targets for Gold and Silver Stocks

In our prior work on the topic of gold and silver, we indicated that the precious metals market had entered into a secular bull market. Our confidence in that thesis was based on the works of Edward Dewey and Edwin Dakins 1947 book titled Cycle: The Science of Prediction. In that book, Dewey and Dakins illustrated the cycles for inflation which indicated that a peak in inflation would occur in 1979 and a trough of inflation would occur around 2006. While the 1979 peak was accurate the 2006 bottom was off by a few years. However, we feel confident that being off by a few years within the context of a 50-year cycle allows for some margin of error.


As investors, the NLO team is primarily concerned with the downside risk and major downside targets. For the gold and silver market, we will use the Philadelphia Gold and Silver Stock Index (XAU) to determine where the next low might occur.


To project the downside target for the XAU, we will use speed resistance lines as pioneered by Edson Gould. William X. Scheinman wrote a piece in Barron’s titled “600 on the Dow” on February 9, 1970 that outlined exactly how Gould’s resistance lines work.


The forecast by Scheinman of a closing low for the Dow at 600 was off by 2.57% when the index closed at 584.56 on October 4, 1974. [As a sidebar, Dow Theory gave a bull market indication in January 1975 that would have investors fully invested.] Although being off by such a small amount, Scheinman also said that the low would occur approximately a year from the date that the article was written. We believe that the tactical error on the part of Scheinman was to expect that the decline would be based strictly on a set time frame rather than based on the level of the resistance line. The chart below is the original piece that was generate by Scheinman from 1970.


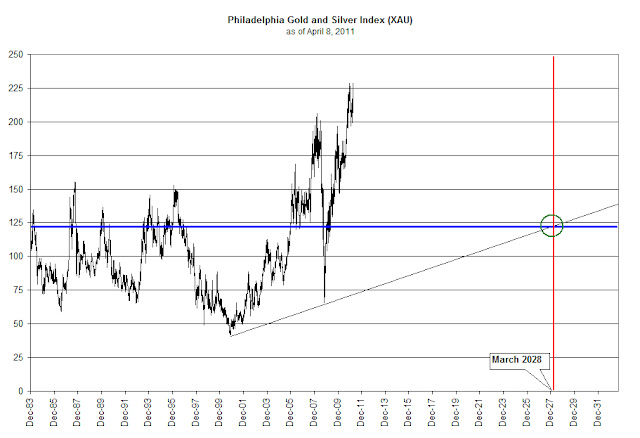
In our chart of the Gold and Silver Stock Index, we have drawn the XAU on a daily basis from 1983 to the present. As described by Scheinman, the counter-trend movement should revert to the speed resistance line or two-thirds of the established high. As an example, the previous peak of the XAU on March 14, 2008 was at the 206.37 level. 206.37 divided by 3 is 68.79. The reversal from the 2008 decline was 65.72 on the XAU. This was within 4.5% of the speed resistance level.


Based on the most recent high of 228.95 the downside target for the XAU index is 76.32. We recommend that whenever the XAU index falls at or below the speed resistance line drawn on the chart, between now and just before 2028, as part of the secular rising trend in interest rates/inflation, we would expect that the stocks in the index are underpriced. Confirmation of fair values should be determined for possible speculative positions at these times.


Note: A variation on this method is to divide the high by three then adding the first major low after the start of the bull market, in this case the October 27,2008 low for the XAU. An example of the usefulness of this technical approach to projecting downside targets can be found by dividing the 2007 top in the Dow Jones Industrial Average (14,164) by three and adding the 1987 low (1738.74). This provided a speed resistance line of 6460.07 which was within 2% of the actual March 9, 2009 low. The blue horizontal line, in our chart of the XAU above, represents the expected downside target when adding the October 2008 low to the speed resistance line.
Please revisit New Low Observer for edits and revisions to this post. Email us.

Investment Observation: Simmons First National Corp (SFNC) at $26.65

For better or worse, we expect that regional financial crises will emerge as the dominant investment theme going forward. After having devastated our economy on a national basis, with the use of derivatives and residential real estate, the time has come for the old-fashion regional boom and busts of old.
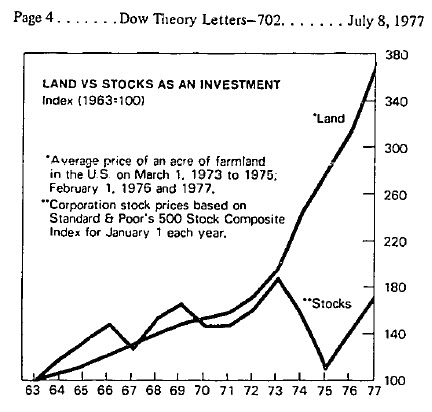
With the secular trend towards inflation, as reflected in the rise in gold, silver and all other commodities, we should expect that farmland in the U.S. will ultimately take a parabolic trajectory. The gradual rise in prices of farmland by large investors will attract retail buyers. Unlike large investors, retail buyers of farmland will need to borrower heavily to participate in the speculation. Unfortunately, it will be because of the retail buyers that the boom will go to extremes. The chart below demonstrates the last farmland boom during a secular bull market in commodities.
Source: Richard Russell's Dow Theory Letters, http://www.dowtheoryletters.com/
On the way to a speculative surge and inevitable bust of the farmland boom, financial institutions will likely have to play a more significant role in financing it. To that end, we present a former Dividend Achiever that is currently on our Dividend watchlist, Simmons First National Corp (SFNC). Simmons First National is likely to become one of the many lending institutions that will play a role in financing the coming boom in commodities. From farmland to farm equipment, SFNC will definitely be in the mix. Unlike the banking institutions that will eventually arrive at the party, as an Arkansas bank, Simmons First National is already situated to play a contributing role.
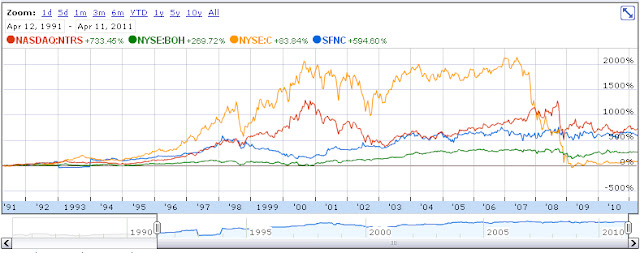
Simmons has all the qualitative elements that a true value investor would want like falling only 20% in the period from 2007 to 2009 as compared to other regional banks as a group which fell over 70% as indicated by Standard & Poor’s Quantitative Stock Report dated April 8, 2011. SFNC has managed to keep the dividend at the same level since 2008 which is no small feat. Book value has increased 6.5% over the last 5 years.
Value Line Investment Survey dated March 11, 2011 indicates that SFNC has a high predictability in their earnings which have gained 3% in the last 5 years and while the last year of earnings have declined –9%. Investors should not confuse falling earnings with no earnings at all. Over emphasis of a companies declining earnings is often what creates value in the price of a stock for those unable to make this distinction.
Because SFNC has traded in a range between $20 and $30 since 2004, there is an implied element of value that has accrued in the shares. If nothing else, the management of SFNC has managed to dodge the banking crisis bullet and is now poised to participate in the coming boom in farmland as part of the bull market in commodities.

Please revisit New Low Observer for edits and revisions to this post. Email us.

NLO Dividend Watch List

The market was relatively flat this week. We are (cautiously) bullish going into next week after the Dow Theory re-confirmation of the cyclical bull market. Read more on that here.
Our watch list this week contains 20 companies that are within 11% of their 52-week low.

April 8, 2011 Watch List

Symbol Name Price % Yr Low P/E EPS (ttm) Dividend Yield Payout Ratio
TGT Target Corp. 49.53 2.70% 12.38 4.00 1.00 2.02% 25%
SJW SJW Corp. 22.94 3.10% 17.65 1.30 0.69 3.01% 53%
SYY Sysco Corp. 28.07 3.46% 14.47 1.94 1.04 3.71% 54%
HCBK Hudson City Bancorp, Inc. 9.87 3.79% 9.06 1.09 0.60 6.08% 55%
WABC Westamerica BanCorp.  50.73 4.17% 15.80 3.21 1.44 2.84% 45%
BMI Badger Meter, Inc. 37.98 4.23% 19.88 1.91 0.56 1.47% 29%
JNJ Johnson & Johnson   59.46 4.57% 12.44 4.78 2.16 3.63% 45%
MCY Mercury General Corp. 39.44 5.77% 14.19 2.78 2.40 6.09% 86%
WEYS Weyco Group, Inc.  24.02 7.76% 20.18 1.19 0.64 2.66% 54%
CHFC Chemical Financial Corp.  20.27 7.88% 23.03 0.88 0.80 3.95% 91%
HGIC Harleysville Group Inc.  32.70 7.89% 13.51 2.42 1.44 4.40% 60%
NWN Northwest Natural Gas Co. 45.44 8.45% 16.64 2.73 1.74 3.83% 64%
PPL PP&L Corporation 25.87 8.93% 11.98 2.16 1.40 5.41% 65%
PEP PepsiCo Inc. 65.73 8.97% 16.77 3.92 1.92 2.92% 49%
MRK Merck & Co., Inc 33.67 9.67% 120.25 0.28 1.52 4.51% 543%
KMB Kimberly-Clark Corp. 65.43 9.84% 14.70 4.45 2.80 4.28% 63%
WMT Wal-Mart Stores, Inc. 52.54 9.99% 11.78 4.46 1.46 2.78% 33%
BOH Bank of Hawaii Corp. 47.28 10.11% 12.44 3.80 1.80 3.81% 47%
CWT California Water Service 37.30 10.32% 20.61 1.81 1.23 3.30% 68%
SFNC Simmons First National Corp.  26.75 10.63% 12.44 2.15 0.76 2.84% 35%
20 Companies


Watch List Summary

On the top of our list this week is Target (TGT).  Again, according IQTrend this stock offers tremendous upside potential gauging by the relative dividend yield. Historically, shares are undervalue at 1% yield. With the stock trading at 2% yield, it has the potential to double, all else being equal.
If you are concern about inflation and looking for an investment as a derivative of that thesis, take a look at Sysco (SYY). Not much has changed since we wrote about it in 2008 (article here). Quick highlight is that SYY is an inflation hedge. Short-term, their ability to pass on costs to customer is limited but eventually those cost get passed on.
Notable to this list is the financial sector. There are about 5 companies, that's a quarter of this list. Including insurance companies and you get 7. Something to explore as a sign of a low in the industry.
Another sector is utilities. There are 4 companies on this list.
No longer on our list is Abbott Lab (ABT). Which rose 2.25% this week and closed above $50. The last time Abbott traded above that level was November 2010.

Top Five Performance Review

In our ongoing review of the NLO Dividend Watch List, we have taken the top five stocks on our list from April 9, 2010 and have checked their performance one year later. The top five companies on that list can be seen in the table below.

Symbol Name 2010 Price 2011 Price % change
MON Monsanto Co. 68.85 66.22 -3.82%
DNB Dun & Bradstreet Corp. 74.49 80.73 8.38%
XOM Exxon Mobil Corp.   68.76 85.95 25.00%
TMP Tompkins Financial Corp. 37.55 41.31 10.01%
FPL FPL Group, Inc. 49.71 56.00 12.65%


Average 10.44%


DJI Dow Jones Industrial 10,997.35 12,380.05 12.57%
SPX S&P 500 1,194.37 1,328.17 11.20%

The average performance of our top five stocks almost matched the market's performance. Please note that these figure exclude dividends and are based purely on price appreciation. Monsanto (MON) weighted down our watch list after reporting their quarterly earning on Wednesday.

Disclaimer:
On our current list, we excluded companies that have no earnings. Stocks that appear on our watch lists are not recommendations to buy. Instead, they are the starting point for doing your research and determining the best company to buy. Ideally, a stock that is purchased from this list is done after a considerable decline in the price and extensive due diligence. We suggest that readers use the March 2009 low (or the companies' most distressed level in the last 2 years) as the downside projection for investing. Our view is to embrace the worse case scenario prior to investing. A minimum of 50% decline or the November 2008 to March 2009 low, whichever is lower, would fit that description. It is important to place these companies on your own watch list so that when the opportunity arises, you can purchase them with a greater margin of safety. It is our expectation that, at the most, only 1/3 of the companies that are part of our list will outperform the market over a one-year period.

Please revisit New Low Observer for edits and revisions to this post. Email us.

Richard Russell’s Miscue

On the Dow Theory Letters (http://www.dowtheoryletters.com/) site yesterday, there was an interesting admission by Richard Russell. Russell said:
“I mistakenly took the vicious decline of 2007 to 2009 as a turn in the tide and a bear market.”
This comes as a shock since most market veterans would say that when almost every market, foreign and domestic, declines by 30% or more then it would be sufficient to label it as a bear market. When the gold stock index (XAU) declines 62% along with almost all other commodity indexes then a reasonable person, lacking any other term for it, would call that a bear market.
Instead of being a bear market, according to Russell, the decline from 2007 to 2009 was simply a “…correction in an ongoing bull market.” As I attempted to process this thought, I only wonder what Russell would re-characterize the stock market decline in Japan (from the 38,000 to 8,000 level) as. Dow theorists like Hamilton, Rhea and many others are very clear on what constitutes a bear market. Russell’s assertion that 2007 to 2009 was simply a “correction” was in complete contradiction to his prescient call of an eminent bear market in Barron’s in November 2007. Nor does Russell’s latest missive add credibility to his prior claims that the rise in the market from the 2003 low was a bear market rally.
To top off Richard Russell’s wild claim that a year and a half decline of over 40% in global equity price was only a “correction” is the fact that he omitted any reference to Dow Theory having any role in his sudden realization that he was wrong about his belief that we were only in a correction rather than a bear market. Russell credited his not so secret Primary Trend Indicator, Lowry’s Selling Pressure Index and Lowry’s Buying Power Index. Apparently, Dow Theory plays a small or non-existent role in a publication that is titled The Dow Theory Letters.
By inference, not crediting Dow Theory for his change in thinking suggests that Dow Theory doesn’t work. However, the NLO team has been adamant that up to this point, Dow Theory has indicated that we’re in a bull market and that a bear market has not been signaled since the July 23, 2009 bull market indication. This is in stark contrast to Russell’s back and forth calls of a bull and bear market as early as January 2009.
So what is Russell’s remedy for his error in judgment for the last 2 years? In today’s note (April 6, 2011) Russell says, “If this market is going to turn primary bearish, I would want to see an orthodox Dow Theory bear signal.” Wait a minute, as the market was rising Russell arbitrarily misapplied his version of Dow Theory and now he thinks that he’ll turn bearish when he receives “…an orthodox Dow Theory bear signal.”
As an attempt to salvage some sort of credibility Russell says, “In the meantime, all is not lost. Gold is at new highs as are the gold ETFs, and silver is at a 31-year high.” This comes after Russell said on March 1, 2011 that if the Dow Industrials fall below 11,800 then investors should sell all stocks “including gold stocks." Well, on March 16, 2011, the Dow fell to 11,600 leaving anyone who believed Russell’s commentary on March 1, 2011 in the lurch.
The NLO team is disappointed since Richard Russell has been the primary inspiration for our work in Dow Theory and critically analyzing financial markets. In addition, we’d rather have Russell retire as a legend with a legacy that will continue to inspire. However, Russell’s latest work comes off as sloppy and requires significant willingness to view his work as entertainment, at best.

 
Please revisit New Low Observer for edits and revisions to this post. Email us.

Dow Theory: Cyclical Bull Market Confirmed

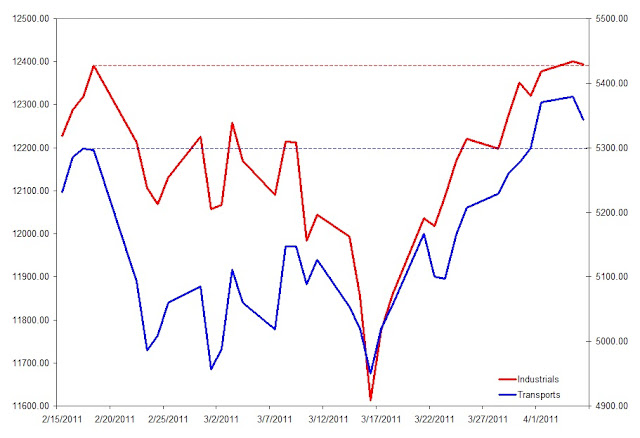
On April 4, 2011, we were provided with a Dow Theory confirmation of the cyclical bull market, within a secular bear market, when the Dow Jones Industrial Average exceeded the prior peak of 12,391.25 set on February 18, 2011.
As has been the case throughout this bull market run, the Transportation Average has taken the lead on the way up. This most recent move by the Industrial Average only confirms what the Dow Jones Transportation Average managed to accomplish on March 31, 2011 by closing at 5,299.89. At least for the next month and a half, the economy is expected to continue to grow. What we see from the Transports on the way up we may also see on the way down.

What do the new short-term highs mean for the market overall? It appears to indicate that the Dow Industrials will continue to stagger towards the old high that was established October 9, 2007 at 14,164. For us, a possible leading indicator for the market (even before the Transports) is the price of gold and silver. If precious metals can continue to rise then the Dow has a more favorable chance of rising. However, if precious metals are falling then, in this stage of the interest rate cycle, the general market will have little chance of going up.

According to Dow Theory, all technical indications in the stock market should translate into the economy. Dow Theory was never intended to predict the stock market. Instead, Dow Theory was intended to determine if the prospects for the economy were favorable or not, using the stock market as a leading indicator. The best example of this is in Robert Rhea’s easy to read book, The Dow Theory Applied to Business and Banking.

 
Please revisit New Low Observer for edits and revisions to this post. Email us.

Speculation Observation: Teva Pharmaceutical Industries (TEVA) at $50.27

A reader indicates that Teva Pharmaceutical Industries (TEVA) is a great stock although there is some confusion as to why the company is trading at such a low price. We took a look at Teva and came up with the following thoughts.
According to Value Line dated January 14, 2011, Teva has paid a dividend since 2000. The average dividend yield when the stock price peaked has been 0.69% and the average dividend yield at the low price has been 1.06%. Based on the close of trading on April 4, 2011, Teva has a dividend yield of 1.74%.
In order for the stock to trade at the historical normal low price/high yield; Teva should trade at $82.07. If Teva were to eventually trade back at the historical high price/low yield, then the stock potentially could rise to $126.
We’re going to take the conservative route and assume that Teva’s new low yield/high price is at the 1.06% yield level. This suggests that the upside target for the stock is 64%. We arrive at this conclusion assuming that all is lost for Teva to ever go back to the 10-year dividend yield range between 0.69% and 1.06%.
An additional consideration is the growth rate of the dividend, which has averaged 26% in the last 5 years. Looking ahead, we considered the most conservative approach to estimating what the stock would be if Teva were to increase the dividend by only 10%. At the historical low price/high yield (1.06%), Teva would be worth $86.79 the same time next year. Any amount below $86 and Teva would be extremely undervalued, all things being equal, or about to go out of business (it’s possible).
As with the historical dividend yield range, the price to book ratios (P/B) are correspondingly out of alignment. In the last 10-year, Teva’s P/B ratio at the highs has averaged 4.41x. At the low in the stock price, the P/B ratio has normally traded at 2.65x. With Teva trading at 2.05x book, the price could easily rise by 30% to $65 just to achieve the prior low price to book ratio range.
For the NLO team, the downside risk is much more important than the upside prospects. According to Dow Theory, Teva has the following downside targets:
  • $47.06 (fair value based on 7/2006 low)
  • $41.30
  • $29.77
Charles H. Dow indicated that the fair value of a stock is the average price that is paid by investors. The fair value is the point at which an investor, as opposed to speculators, will consider buying or selling a stock. The fair value that we’ve arrived is based on the low of July 2006. If Teva were to decline below $47.06, the prospects for $29.77 become almost inevitable. Our concern is that the macro conditions favor a market decline, which would put additional downside pressure on Teva.  As Teva declines below fair value we will provide an updated estimate of fair value upon request.

Please revisit New Low Observer for edits and revisions to this post. Email us.

Nasdaq 100 Watch List

Below are the Nasdaq 100 companies that are within 26% of the 52-week low. This list is strictly for the purpose of researching whether or not the companies have viable business models. Although theses companies are very risky, they provide significant opportunity to outperform the market in the coming year.

Symbol Name Trade P/E EPS Yield P/B % from Low
CSCO Cisco Systems $17.04 12.89 $1.32 1.40% 2.08 0.41%
URBN Urban Outfitters $30.35 18.97 $1.60 0 3.48 4.55%
AMGN Amgen Inc. $53.08 11.08 $4.79 0 2.08 5.61%
TEVA Teva Pharma. $50.54 13.79 $3.66 1.80% 2.05 7.55%
ATVI Activision Blizzard $11.01 33.36 $0.33 1.50% 1.27 10.21%
INTC Intel Corporation $19.72 9.81 $2.01 3.60% 2.25 12.05%
MSFT Microsoft Corp. $25.48 10.87 $2.34 2.50% 4.4 12.10%
MRVL Marvell Tech. $15.93 11.89 $1.34 0 1.84 14.85%
SPLS Staples $20.06 16.58 $1.21 2.00% 2.02 14.96%
CELG Celgene Corp. $57.30 30.48 $1.88 0 4.53 19.33%
AKAM Akamai $37.60 41.59 $0.90 0 3.26 19.59%
QGEN Qiagen N.V. $20.31 33.85 $0.60 0 1.89 20.46%
EXPE Expedia, Inc. $22.26 15.25 $1.46 1.30% 2.32 21.64%
APOL Apollo Group $41.41 11.36 $3.65 0 4.17 22.70%
MAT Mattel, Inc. $25.26 13.6 $1.86 3.70% 3.31 25.42%

Nasdaq 100 Summary

On our last  Nasdaq 100 watch list, Cephalon (CEPH) was within 6% of the 52-week low.  This week, Cephalon was presented with an offer that seemed exceptional.  Valeant (VRX) announced that it was willing to offer a buyout of Cephalon at $73.  The market reaction to this was to push Cephalon above the offer price to $75.  At the same time, Valeant's stock price has jumped more than 15% indicating that the market feels that Cephalon could use a shake-up.  Our individual recommendation of Cephalon was issued on February 15, 2011 and can be found here. 
Also on our watch list from February 20, 2011, Celgene (CELG) has quietly crept 7% higher from where it once was.  According to Value Line dated January 14, 2011, Celegene has no debt, minimal increase of shares outstanding in the last three years, return on equity and return on capital are both in the high teens and book value that has grown over 11x since 2003.
Another company that we're watching closely is Amgen (AMGN).  The price of Amgen has vacillated in a narrowing range since 2008.   At the same time, Amgen has seen its shares outstanding decrease by 27.7% since 2002.  Amgen has very compelling financials which belies the lackluster performance in the stock price.

Nasdaq 100 Performance Review

Symbol Name 3/26/2010 3/26/2011 % change
GILD Gilead Sciences $45.34 $42.08 -7.19%
GENZ Genzyme Corp. $53.00 $75.94 43.28%
APOL Apollo Group $61.28 $43.51 -29.00%
QCOM Qualcomm $41.10 $52.75 28.35%
FSLR First Solar $116.50 $150.44 29.13%
SRCL Stericycle, Inc. $54.50 $88.82 62.97%
- Average - - 21.26%
NDX Nasdaq 100 1952.63 2326.26 19.13%
Our watch list from March 26, 2010 (found here) performed well considering that Apollo Group (APOL) has continued to fall due to closer scrutiny of Apollo's business practices.  Gilead Sciences (GILD) managed to decline -30% before coming full circle with a 1-year loss of "only" -7%.  The average gain for the whole group was 21.26% which was slightly ahead of the Nasdaq 100 index by 2.13%.
Please revisit New Low Observer for edits and revisions to this post. Email us.

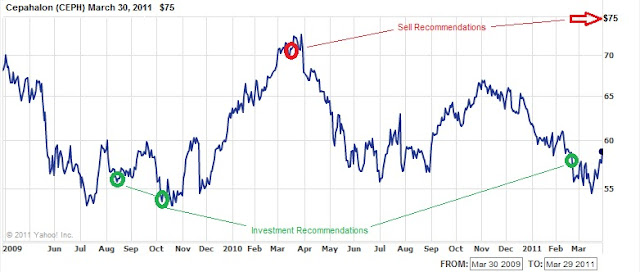
Sell Cephalon (CEPH) at the Market

Our premise that exceptional values starts with quality companies trading near a 52-week low has been proven again. Just like our calls on Beckman Coulter (BEC), Wesco Financial (WSC), Genzyme (GENZ) and many others, our articles on Cephalon (CEPH) have shown that quality cannot be ignored.
In a series of articles starting in August of 2009, we recommended considering the purchase of CEPH at $56.61. Subsequently, in March 2010, we recommended selling CEPH at around the $71 price range, which was two dollars short of the high at $73. Finally, on February 11, 2011, we recommended that followers of this site reconsider CEPH at $58.99. Soon after our recommendation, CEPH declined to the most recent low of $57. A month and a half later, Cephalon (CEPH) is getting a hostile bid from Valeant Pharmaceuticals (VRX) for approximately $73 a share.
Although our cursory examination of the offer by VRX seems generous, we believe that CEPH probably should, and could, be worth closer to $115 rather than $73. Regardless of this concern, we believe that 23% in 46 days affords us the opportunity to recommend selling the stock at the current price. There are too many opportunities on our Nasdaq 100 and Dividend Watch Lists. Based on our last recommendation, the annualized return on this position would be close to 200% in a tax-deferred account.
Please revisit New Low Observer for edits and revisions to this post. Email us.

Stock List Review: InvestorPoet’s 8 Core Stocks

This is a one-year performance recap of the stocks mentioned in an article published on March 29, 2010 generated by InvestorPoet of Poetic Portfolios blog.
Company Symbol March 29, 2010 March 28, 2011 % change
Costco Wholesale COST $59.36 $71.26 20.05%
AT&T T $24.91 $29.36 17.86%
ADP ADP $43.15 $50.35 16.69%
Markel MKL $372.70 $405.12 8.70%
Pepsico PEP $64.57 $64.34 -0.36%
Proctor & Gamble PG $61.82 $60.66 -1.88%
Johnson & Johnson JNJ $62.52 $59.24 -5.25%
Intel INTC $21.65 $20.34 -6.05%
Average - - - 6.22%
Dow Industrial Average - 10895.86 12197.88 11.95%
S&P 500 - 1173.22 1310.19 11.67%
The average total return for this portfolio over the last year was 6.22% while the median was 4.17%. Only three of the stocks exceeded the return of the major indexes while the remainder of stocks registered modest gains or slight losses over the last year.
*All 2010 stock prices are adjusted to reflect dividends and splits. Date range is March 29, 2010 to March 28, 2011. 
Please revisit New Low Observer for edits and revisions to this post. Email us.

Stock List Review: Chuck Carnevale’s Undervalued Blue Chips

This is a 1-year performance recap of the stocks mentioned in an article published on March 26, 2010 generated by Chuck Carnevale of EDMP Inc.
Symbol Name 3/26/2010 3/18/2011 % change Yield at rec'd
MKC McCormick 36.67 49.61 35.29% 2.70%
ADP ADP 42.86 50.37 17.52% 3.00%
CLX Clorox Co. 62.47 69.48 11.22% 3.10%
SYY Sysco Corp. 28.18 27.86 -1.14% 3.50%
PG Procter & Gamble 61.78 60.88 -1.46% 2.80%
PEP Pepsico, Inc. 64.61 63.98 -0.98% 2.70%
ABT Abbott Labs 51.07 48.03 -5.95% 3.00%
HCBK Hudson City Bancorp 13.31 9.87 -25.85% 4.30%
Average 3.58% 3.14%

The average total return for this portfolio was 3.58% while the median was –1.06%. Only two of the stocks managed to exceed the market performance. The remaining 6 stocks averaged –4.02% over the last year. Although this list comprised mainly of Dividend Achievers, stocks that have increased their dividend every year for the last 10 years, the performance was well below that of the Dow Industrials and S&P 500 Index which averaged over 12.62% and 12.63%, respectively. 
McCormick & Company (MKC) and Automatic Data Processing (ADP) handily exceed the returns of the Dow Industrials and Standard and Poor’s Index with 35.29% and 17.52% returns, respectively. The other current and former Dividend Achievers were all in the negative by narrow margins except Hudson City Bancorp (HCBK). The small losses over the last year justifies retaining long-term positions in the Dividend Achievers as long as the earnings support growth and consistency of the dividends.

It is noted that at the time of the recommendation of these stocks, they were at or near their respective 52-week highs. This is a critical element, recommending stocks at the high, that we strive to avoid. Our most recent list of Dividend Achievers with the one year performance can be found here. 

*All 2010 prices are adjusted to reflect dividends and splits.


Please revisit New Low Observer for edits and revisions to this post. Email us.

Stock List Review: Dividends4Life’s Avoiding the Cash Trap

This is a 1-year performance recap of the stocks mentioned in an article published on March 26, 2010 generated by Dividends4Life of Dividends Value.
Symbol Name 2010 Adj. Price* 2011 Price % change Yield at rec'd
RAVN Raven Industries 28.16 58.65 108.27% 2.89%
HIFS Hingham Savings 32.34 51.00 57.70% 2.83%
COP ConocoPhillips 49.11 80.24 63.39% 4.22%
WSM Williams-Sonoma 26.18 39.45 50.69% 1.88%
SBUX Starbucks 24.16 36.90 52.73% 1.58%
CSBK Clifton Savings 9.15 11.94 30.49% 2.50%
VLGEA Village Super Market 26.52 29.14 9.88% 3.61%
RTN Raytheon Co 55.56 50.80 -8.57% 2.62%
Average 45.57% 2.77%
Dow Industrials 10850.36 12220.59 12.63%
S&P 500 1166.59 1313.8 12.62%
The average total return for this portfolio over the last year was 45.57% while the median was 50.69%. Only two of the eight stocks underperformed the market. The remaining six stocks averaged a whopping 60% gain in the last year.
Raven Industries (RAVN), which has increased its dividend every year for 25 years and sports an exceptionally low dividend yield last year, outranked the gains of every stock on the list by almost double with a total return exceeding 108%. The average yield of all the stocks on the list was 2.77%.

*All 2010 prices are adjusted to reflect dividends and splits


Please revisit New Low Observer for edits and revisions to this post. Email us.

NLO Dividend Watch List

The market rallied strong and finish the week on a positive note. We can't help but feel bullish going into next week after the S&P 500 worked its way passed the 1,304.28 mark prior to March 11 (when the earthquake struck Japan). We will have to wait and see if the market can continue its upward momentum and give us another Dow Theory re-confirmation of the cyclical bull market within a secular bear market.

March 25, 2011 Watch List

Our watch list this week contains 28 companies that are within 11% of their 52-week low.

Symbol Name Price % Yr Low P/E EPS (ttm) Dividend Yield Payout Ratio
SJW SJW Corp. 22.65 1.80% 17.42 1.30 0.69 3.05% 53%
SYY Sysco Corp. 27.86 2.69% 14.36 1.94 1.04 3.73% 54%
WABC Westamerica BanCorp.  50.13 2.94% 15.62 3.21 1.44 2.87% 45%
PPL PP&L Corporation 24.57 3.45% 11.38 2.16 1.40 5.70% 65%
TGT Target Corp. 49.95 3.57% 12.49 4.00 1.00 2.00% 25%
JNJ Johnson & Johnson   58.98 3.73% 12.34 4.78 2.16 3.66% 45%
HCBK Hudson City Bancorp, Inc. 9.87 3.79% 9.06 1.09 0.60 6.08% 55%
MCY Mercury General Corp. 38.83 4.13% 13.97 2.78 2.40 6.18% 86%
CHFC Chemical Financial Corp.  19.62 4.42% 22.30 0.88 0.80 4.08% 91%
PEP PepsiCo Inc. 63.98 6.07% 16.32 3.92 1.92 3.00% 49%
MRK Merck & Co., Inc 32.57 6.09% 116.32 0.28 1.52 4.67% 543%
CWT California Water Service 36.1 6.77% 19.94 1.81 1.23 3.41% 68%
HGIC Harleysville Group Inc.  32.37 6.80% 13.38 2.42 1.44 4.45% 60%
TRH Transatlantic Holdings, Inc. 47.41 7.55% 7.66 6.19 0.84 1.77% 14%
LLY Eli Lilly & Co. 34.48 7.68% 7.53 4.58 1.96 5.68% 43%
ABT Abbott Laboratories 48.03 7.71% 16.23 2.96 1.92 4.00% 65%
BMI Badger Meter, Inc. 39.65 8.81% 20.76 1.91 0.56 1.41% 29%
PRK Park National Corp. 64.37 8.92% 14.27 4.51 3.76 5.84% 83%
KMB Kimberly-Clark Corp. 65.1 9.28% 14.63 4.45 2.80 4.30% 63%
AWR American States Water Co. 34.16 9.35% 19.30 1.77 1.04 3.04% 59%
WMT Wal-Mart Stores, Inc. 52.35 9.59% 11.74 4.46 1.46 2.79% 33%
CL Colgate-Palmolive Co. 80.15 9.61% 18.60 4.31 2.32 2.89% 54%
AVP Avon Products, Inc. 27.43 9.72% 19.73 1.39 0.92 3.35% 66%
VLY Valley National BanCorp.  13.55 9.89% 16.73 0.81 0.72 5.31% 89%
NWN Northwest Natural Gas Co. 46.07 9.95% 16.88 2.73 1.74 3.78% 64%
BOH Bank of Hawaii Corp. 47.25 10.04% 12.43 3.80 1.80 3.81% 47%
WEYS Weyco Group, Inc.  24.59 10.32% 21.38 1.15 0.64 2.60% 56%
RLI RLI Corp. 56.39 10.87% 9.40 6.00 1.16 2.06% 19%
28 Companies


Watch List Summary

On the top of our list this week is San Jose, CA-based water utility SJW Corp. (SJW). The stock has been under pressure this week. The current yield of 6% is attractive but with nearly $30B of debt and only $650M of cash on hand, it may not be worth the risk/reward.
Target (TGT) is another name with tremendous upside potential gauging by the relative dividend yield establish by IQTrend. Historically, shares are undervalue at 1% yield. With the stock trading nearly 2%, it has the potential to double, all else being equal.
Another name we'd like to highlight is Abbott Lab (ABT). We go back to our 2009 analysis of the company and find some interesting qualitative changes. The stock was trading at 3.4% yield and roughly $47. Today, with a price of $48, ABT would yield 4%. We see that the stock offers more value at $48 than at $47.

Top Five Performance Review

In our ongoing review of the NLO Dividend Watch List, we have taken the top five stocks on our list from March 26, 2010 and have checked their performance one year later. The top five companies on that list can be seen in the table below.
Symbol Name 2010 Price 2011 Price % change
XOM Exxon Mobil Corp.   66.54 83.62 25.67%
FPL* FPL Group, Inc. 47.81 54.10 13.16%
MON Monsanto Co. 71.10 70.76 -0.48%
TMP Tompkins Financial Corp. 37.75 41.34 9.51%
BRO Brown & Brown, Inc. 17.81 25.09 40.88%


Average 17.75%


DJI Dow Jones Industrial 10,850.36 12,220.59 12.63%
SPX S&P 500 1,166.59 1,313.80 12.62%

*FPL is now NEE

The performance of our top five stocks topped the overall market by 5%. Thanks to two key performer, Exxon (XOM) and Brown & Brown (BRO).

Disclaimer

On our current list, we excluded companies that have no earnings. Stocks that appear on our watch lists are not recommendations to buy. Instead, they are the starting point for doing your research and determining the best company to buy. Ideally, a stock that is purchased from this list is done after a considerable decline in the price and extensive due diligence. We suggest that readers use the March 2009 low (or the companies' most distressed level in the last 2 years) as the downside projection for investing. Our view is to embrace the worse case scenario prior to investing. A minimum of 50% decline or the November 2008 to March 2009 low, whichever is lower, would fit that description. It is important to place these companies on your own watch list so that when the opportunity arises, you can purchase them with a greater margin of safety. It is our expectation that, at the most, only 1/3 of the companies that are part of our list will outperform the market over a one-year period.

Please revisit New Low Observer for edits and revisions to this post. Email us.

Stock List Review: Kurt Wulff’s McDep.com

This is a 1-year performance recap based on the most popular stock lists that appeared on SeekingAlpha.com. On March 21, 2010, the most popular stock list was generated by Kurt Wulff of McDep Associates. Kurt's list was titled "6 Cheap Oil Opportunities."

Symbol Name 3/19/2010 3/18/2011 % Change
XOM Exxon Mobil Corp. $65.36 $80.85 23.70%
COSWF.PK Canadian Oil Sands $28.55 $31.58 10.61%
TOT Total S.A. $53.91 $57.58 6.81%
CVX Chevron Corp. $72.43 $102.80 41.93%
PTR PetroChina Co. $112.48 $133.63 18.80%
COP ConocoPhillips Co. $50.40 $75.35 49.50%
Average 25.23%
Median 21.25%
Dow Industrials 10,741.98 11,858.52 10.39%
S&P 500 1,159.90 1,279.21 10.29%
Amex Oil Index 1,075.26 1,310.54 21.88%

Based on the total return performance of the list, the average gain was 25.23% while the median return was 21.25%. Kurt's stock list, on an average and median basis, significantly outperformed the Dow Jones Industrial Average and the S&P 500 index.  Additionally, Kurt's average return exceeded the Amex Oil Index (XOI) by 3.35%.

Please revisit New Low Observer for edits and revisions to this post. Email us.

Stock List Review: Dividends4Life’s "Future Yield"

This is a 1-year performance recap based on the most popular stock list that appeared on SeekingAlpha.com.  On March 19, 2010, the most popular stock list was generated by Dividends4Life of Dividends Value in an article titled "9 Dividend Stocks Building Future Yield." 

Company Symbol 3/19/2010 3/18/2011 Gain/Loss
Birner Dental bdms $16.24 $19.62 20.81%
Warwick Valley Telephone wwvy $13.29 $14.90 12.11%
Lennox lii $42.84 $50.97 18.98%
PepsiCo pep $64.58 $63.24 -2.07%
Astro-Med alot $7.35 $7.69 4.63%
Mead Johnson mjn $50.33 $55.90 11.07%
Guess? Inc. ges $44.23 $38.27 -13.48%
Air Products apd $72.59 $88.00 21.23%
Prospect Capital psec $10.94 $11.87 8.50%
Average 9.09%
Median 11.07%
Dow Industrials 10,741.98 11,858.52 10.39%
S&P 500 1,159.90 1,279.20 10.29%
Based on the total return performance of the list, the average gain was 9.09% while the median return was 11.07%.  Although the stock list's average return didn't exceed the performance of the Dow Jones Industrial Aveage or the S&P 500 of the same period, the median return implies that this list offered reasonable opportunity to exceed the market return if the buyer used discretion when purchasing the stocks.

Because this is only a one year review, we believe that there may be no relationship to the short-term outcome versus the long-term expectations.  Remember, past performance is no guarantee of future failure.

Please revisit New Low Observer for edits and revisions to this post. Email us.