Dow Theory Update

On May 19, 2012, we said that the bear market rally had ended (found here).  In our view, we believed that the Dow Jones Jones Industrial Average would not exceed the high of 13,279.32 set on May 1, 2012.  The most recent run of the Dow Industrials is causing us to wonder if our assessment was correct.

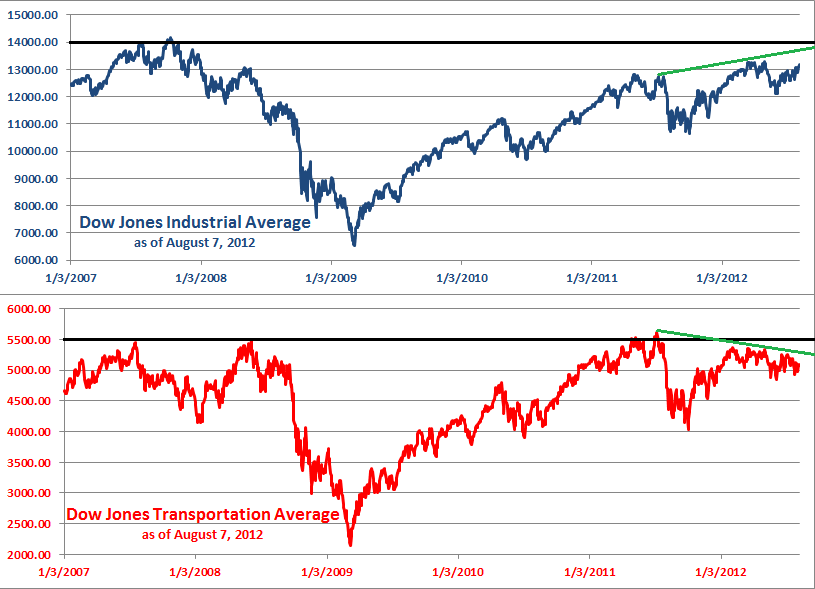
Despite our concern that the Dow Industrials will increase above 13,279.32, we do need to point out  two technical non-confirmations of the market that have been established so far.  First is the secular (long-term) level of the market.  Ordinarily, the secular (long-term) trend of the market would be bullish when and if both the Industrials and Transports rise above their respective 2007 to 2012 peaks.

As can be seen in the chart below, the horizontal black lines shows that the Transportation Index managed to rise above the prior high of 2007/2008.  At the same time, the Dow Jones Industrial Average did not come as close to the prior highs.  This lack of confirmation suggests that we are still in a secular (long-term) bear market.

image

At the same time, on a cyclical basis (short-term), as indicated by the green lines above, the Dow Jones Industrial Average and Transportation Average have gone their separate ways.  The Dow Jones Industrial Average trending higher while the Dow Jones Transportation Average has trended lower.

So far, all indications are that we’re in a cyclical and secular bear market.  Since our bear market indication of August 2, 2011 (found here), we have not received any indication to the contrary.  However, if we’re completely wrong about the bearish direction of the market, a Dow Theory bull market indication on a cyclical basis (short-term) would occur if the Dow Industrials and Transports were to increase above 13,279.32 and 5,627.85, respectively.  Additionally, a bull market indication on a secular basis (long-term) would occur when the Dow Industrials and Transports exceed their respective highs in the period from 2007 to 2012.

Despite our concern for the bear market that we are in, we continue to pursue the policy of accumulating stocks that appear reasonably undervalued which is in accordance with Charles H. Dow’s emphasis on values at a reasonable prices. Our most recent purchases of Carbo Ceramics (CRR) and Expeditors International of Washington (EXPD) brings our partnership portfolio to 57.78% in stocks and 42.22% in cash.

Priceline.com (PCLN) Downside Targets

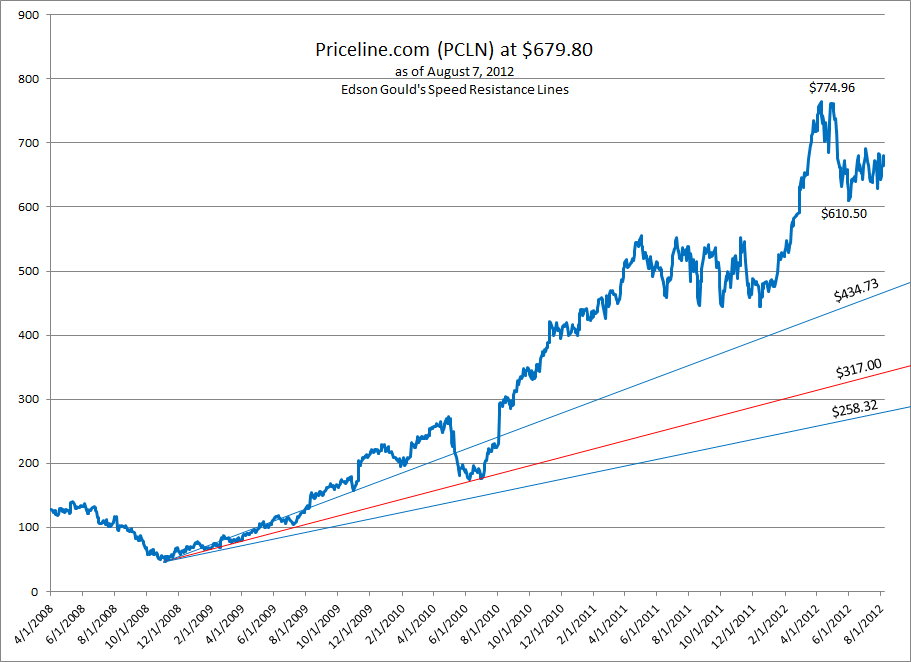
In after-hours trading, Priceline.com (PCLN) has decline below the June 1, 2012 support level of $610.50.  By declining below such a level, it appears that we can project downside targets using Edson Gould’s Speed Resistance Lines.

image

Our current assessment of Priceline.com is far different from our examination of Gould’s Speed Resistance Lines on November 10, 2011 (found here).  As the price of PCLN has increased so does the downside targets. 

Over the next several months, we’ll be able to see if Priceline.com declines to the conservative target of $434.73 and then to the $317 level.  Our extreme downside target of $258.32 appears as an outlier event at this point but will be reconsidered if PCLN declines to $317.

Nasdaq 100 Watch List: August 6, 2012

Below are the Nasdaq 100 companies that are within 11% of their respective 52-week lows. Stocks that appear on our watch lists are not recommendations to buy. Instead, they are the starting point for doing your research and determining the best company to buy. Ideally, a stock that is purchased from this list is done after a considerable decline in the price and rigorous due diligence.

Symbol Name Price P/E EPS Price/Book % from low
EXPD Expeditors Int'l of Washington 36.04 20.83 1.73 3.66 3.47%
DELL Dell Inc. 11.8 6.74 1.75 2.2 3.60%
LRCX Lam Research Corporation 34.62 25.64 1.35 0.9 4.15%
CHRW CH Robinson Worldwide Inc. 53.63 19.72 2.72 6.79 5.55%
APOL Apollo Group Inc. 27.24 6.52 4.18 3.34 5.70%
INFY Infosys Ltd. 40.67 13.3 3.06 3.78 7.22%
NFLX Netflix, Inc. 56.79 32.3 1.76 4.35 7.54%
MRVL Marvell Technology Group Ltd. 11.12 11.91 0.93 1.3 8.28%
WYNN Wynn Resorts Ltd. 97.8 19.16 5.1 43.32 8.53%
CTRP Ctrip.com International Ltd. 13.47 14.93 0.9 1.7 8.98%
SPLS Staples, Inc. 13.08 9.39 1.39 1.26 9.55%
ATVI Activision Blizzard, Inc. 11.42 16.27 0.7 1.17 9.81%
RIMM Research In Motion Limited 7.26 - -0.1 0.38 10.67%

Watch List Summary

Standing out on our Nasdaq 100 Watch List is Lam Research (LRCX).  According the Yahoo!Finance, Lam Research is a company that “…designs, manufactures, markets, refurbishes, and services semiconductor processing equipments used in the fabrication of integrated circuits. The company offers etch products that remove portions of various films from the wafer in the creation of semiconductor devices.”

Starting with the fundamentals, Value Line Investment Survey indicates that LRCX has grow the book value from $5.20 in 2003 to the current level of $19.99 as of 2011.  Value Line suggests that LRCX has a fair value of 12x cash flow.  Based on the Value Line estimated cash flow of $2.60 for 2012, LRCX should be fairly valued at $31.20.  Value Line estimates that 2013 cash flow will be $4.55 resulting in a $54.60.  Additionally, shares outstanding have declined from 141 million shares to the estimated level of 119 million shares.

One issue that must be considered is the fact that in 2011, long-term debt skyrocketed 40 times the 2010 level.  This may have occurred at a time that borrowing costs are at their lowest point which ordinarily is a smart financial move.  However, we’d recommend considering the debt position as a potential negative before investing in LRCX.

Lam Research holds the largest market share of etchers (54% in 2011).  In our view their process technology is greater than its competitors, Applied Materials (AMAT) and Tokyo Electron.  Some of their top customers are Intel (INTC), Samsung, and TSMC (TSM).

According to Dow Theory, LRCX has the following downside targets:

  • $29.52
  • $24.59
  • $19.66
  • $14.73

Those interested in LRCX should consider buying the stock at $19.66 and below.

Watch List Performance Review

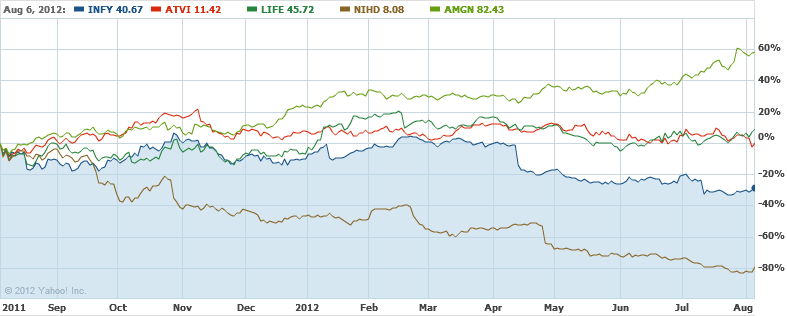
In our ongoing review of the Nasdaq 100 Watch List, we have taken the top five stocks on our list from August 12, 2011 and have checked their performance one year later. The top five companies on that list can be seen in the table below.

Symbol
Name 8/12/2011 8/6/2012 % change
INFY Infosys Limited 53.78 40.67 -24.38%
ATVI Activision Blizzard, Inc 10.71 11.42 6.63%
LIFE Life Technologies 38.42 45.72 19.00%
NIHD NII Holdings, Inc. 36.9 8.08 -78.10%
AMGN Amgen Inc. 50 82.43 64.86%
-2.40%
NDX Nasdaq 100 2182.05 2694.09 23.47%

image

The top five on our Watch List from last year were crushed when compared to the performance of the Nasdaq 100 Index.  Three stocks on our watch list (ATVI, LIFE, AMGN) were able to achieve 10% or greater within a one year timeframe.

Transaction Alert: Bought CRR and EXPD at the Market

  • We have taken a 5% position in Carbo Ceramics (CRR) at the average price of $65.02.
  • We have taken a 5% position in Expeditors International (EXPD) at the average price of $36.28.

Carbo Ceramics (CRR) has been mentioned by us on several occasions.  CRR first appeared on our February 10, 2012 U.S. Dividend Watch List (found here) and was trading at $85.94.  An Altimeter was run on CRR which indicated that the stock would be undervalued at $62.40 (found here).  However, as CRR has experienced a dividend increase of 12.5% since our May 28, 2012 Altimeter, the stock is now considered undervalued at $70.  While we do expect approximately 20% downside risk from the current price, we are comfortable with adding to our position when such a decline takes place.

Expeditors International of Washington (EXPD) is a stock that we have a history with.  We initially bought EXPD on September 9, 2011 in all of our accounts.  When the stock achieved an +11% gain we sold the principal in our tax deferred accounts while our taxable partnership account held on to the shares.  We are now buying an equal number of shares that were originally bought in the partnership account.  Additionally, we are adding to our existing shares of EXPD (profit portion) in the tax deferred accounts.

U.S. Dividend Watch List: August 3, 2012

Below are the 24 companies on our U.S. Dividend Watch List that are within 11% of their respective 52-week lows. Stocks that appear on our watch lists are not recommendations to buy. Instead, they are the starting point for doing your research and determining the best company to buy. Ideally, a stock that is purchased from this list is done after a considerable decline in the price and rigorous due diligence.

Symbol Name Price % Yr Low P/E EPS (ttm) Dividend Yield Payout Ratio
CRR Carbo Ceramics, Inc. 64.69 2.68% 11.33 5.71 1.08 1.67% 19%
EXPD Expeditors International 36.10 3.65% 20.87 1.73 0.56 1.55% 32%
CAH Cardinal Health, Inc.  39.24 4.56% 13.30 2.95 0.95 2.42% 32%
MATW Matthews International  29.16 4.59% 13.32 2.19 0.36 1.23% 16%
HRC Hill-Rom Holdings, Inc. 25.90 4.90% 11.16 2.32 0.50 1.93% 22%
UNM Unum Group 19.18 4.92% 25.92 0.74 0.52 2.71% 70%
JCI Johnson Controls Inc  24.59 5.22% 9.80 2.51 0.72 2.93% 29%
ERIE Erie Indemnity Company  65.93 5.29% 22.27 2.96 2.21 3.35% 75%
CHRW C.H. Robinson Worldwide  53.60 5.49% 19.71 2.72 1.32 2.46% 49%
HHS Harte-Hanks, Inc. 6.52 5.84% 9.59 0.68 0.34 5.21% 50%
IBKC IBERIABANK Corp.  45.37 6.73% 20.53 2.21 1.36 3.00% 62%
BDX Becton, Dickinson 74.35 6.84% 13.54 5.49 1.80 2.42% 33%
ADM Archer Daniels Midland 25.54 7.81% 13.88 1.84 0.70 2.74% 38%
ANAT American National Insurance 70.94 7.96% 9.98 7.11 3.08 4.34% 43%
HRL Hormel Foods Corp. 28.00 8.23% 16.09 1.74 0.60 2.14% 34%
OMI Owens & Minor, Inc. 28.04 8.39% 15.24 1.84 0.88 3.14% 48%
MCY Mercury General Corp. 36.65 8.40% 13.99 2.62 2.44 6.66% 93%
MCD McDonald's Corp.  89.59 9.24% 16.84 5.32 2.80 3.13% 53%
ABM ABM Industries, Inc. 18.90 9.31% 15.12 1.25 0.58 3.07% 46%
MGRC McGrath RentCorp.  23.68 9.58% 12.08 1.96 0.94 3.97% 48%
PBI Pitney Bowes Inc  13.86 9.65% 4.05 3.42 1.50 10.82% 44%
COP ConocoPhillips 55.71 10.06% 6.51 8.56 2.64 4.74% 31%
STBA S&T BanCorp., Inc.  16.81 10.52% 14.25 1.18 0.60 3.57% 51%
CAG ConAgra Foods, Inc. 24.57 10.68% 21.94 1.12 0.96 3.91% 86%
24 Companies

Watch List Review

Carbo Ceramics (CRR) continues to trade down and has broken the $70 mark.  On the technical level, shares remain in bearish territory.  After the company reported the Q2 earnings, share took a dive.  Despite not meeting analysts’ expectation, the company revenue and earnings rose 19% and 7% respectively.  In addition, the board approved a 13% increase in the dividend.  Here’s the summary of some of the price targets and analyst ratings on Carbo Ceramics.

  • Dahlman Rose – maintain Buy rating, lower price target from $99 to $84.
  • BMO Capital – maintain Outperform, lower price target from $130 to $100.
  • Howard Weil – cut target price from $108 to $83.
  • Tudor Pickering – lower rating from buy to accumulate.
  • Morgan Stanley – lower rating to Underweight, lower price target to $55.

Expeditors (EXPD) shares are trading in tandem with the Dow Jones Transportation Index.  Goldman Sachs initiates coverage on Expeditors with a Sell rating on the stock with price target of $35.  Goldman said, “In our view, Expeditors is a well run business in a highly fragmented and competitive industry, but trade growth is slowing cyclically and we expect this to negatively impact the company’s top line growth resulting in earnings to disappointment.  We do not believe this is discounted at current valuations.”  Here’s the summary of some of the research firm coverage.

Cardinal Health (CAH), the maker of medical equipment and supplies, is under pressure after Q4 revenue and earnings came in below analyst expectations. EPS was $0.68 vs $0.72 estimate; revenue was $26.76B vs the $27.27B estimate.  Credit Suisse maintains an outperform rating but lowered their target price slightly from $53 to $50.  JP Morgan also maintained their overweight rating but lowered the price target from $48 to $47.  We will dive more into the stock later in the week.

Top Five Performance Review

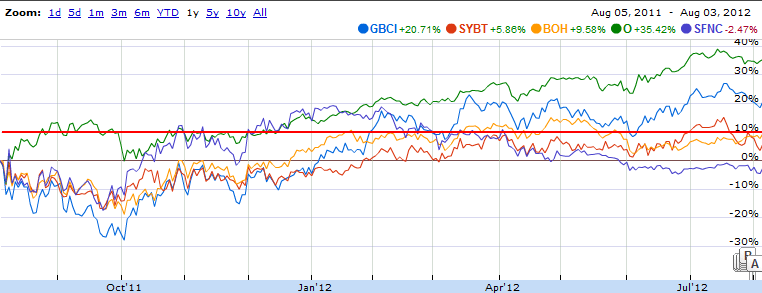
In our ongoing review of the NLO Dividend Watch List, we have taken the top five stocks on our list from August 6,  2011 and have check their performance one year later. The top five companies on that list can be seen in the table below.

Symbol Name 2011 Price 2012 Price % change
GBCI Glacier BanCorp., Inc.  12.41 15.21 22.56%
SYBT S.Y. BanCorp., Inc.  21.47 22.96 6.94%
BOH Bank of Hawaii Corp. 43.04 47.25 9.78%
O Realty Income Corp. 30.01 41.41 37.99%
SFNC Simmons First National Corp.  23.47 23.30 -0.72%
Average 15.31%
DJI Dow Jones Industrial 11,444.61 13,096.17 14.43%
SPX S&P 500 1,199.38 1,391.00 15.98%

NLO_2012.8.3

Our top five performance was in-line with the market.  All five companies managed to reach the 10% mark within one year.

Coppock Curve: July 2012

The Coppock Curve is one of the technical indicators that we focus on for long-term buying signals. The Coppock Curve is only useful as a BUY indicator when the chart goes from positive territory to the negative territory and then starts to turn decidedly upwards. As previously indicated, the Coppock Curve does not provide SELL signals in any way.

Once the signal starts to turn up, investors should consider buying stocks at the beginning of the month after the indicator turns upward. Our last "buy" indication came at the end of April 2009. Anyone who purchased the Dow Jones Industrial ETF (DIA) on the first trading day of May 2009, they would have gained +59% in the process.

After July 2012, the Coppock Curve remains far from the negative zone. This suggests that, overall, the market is not considered a "buy."

More about the Coppock Curve.

Gold Stock Indicator: The Big Picture

Article Summary

  • Start accumulating gold stocks now
  • select gold stocks from those in the XAU Index
  • at minimum, investors must allow for 25% downside risk before reinvesting more funds

Our Take

On November 2, 2011, we posted an article which highlighted the fact that gold stocks routinely underperform the price of gold (found here). Also in that article, we introduced our Gold Stock Indicator to show that the timing of when to buy gold stocks was more important than the fact that prices and valuations appear to be low.

To demonstrate the significance of our indicator, we’d like to contrast it to the widely used Gold/XAU ratio. According to noted market commentator and fund manager John Hussman:

“…since 1974, the Gold/XAU ratio has been greater than 5.0 about 15% of the time. When the ratio has been this high, the XAU has followed with annualized gains of 89.6%, on average.” (Hussman, John. “Gold/XAU Ratio Signals Buy for Gold Stocks”. Seeking Alpha. March 13, 2007.)

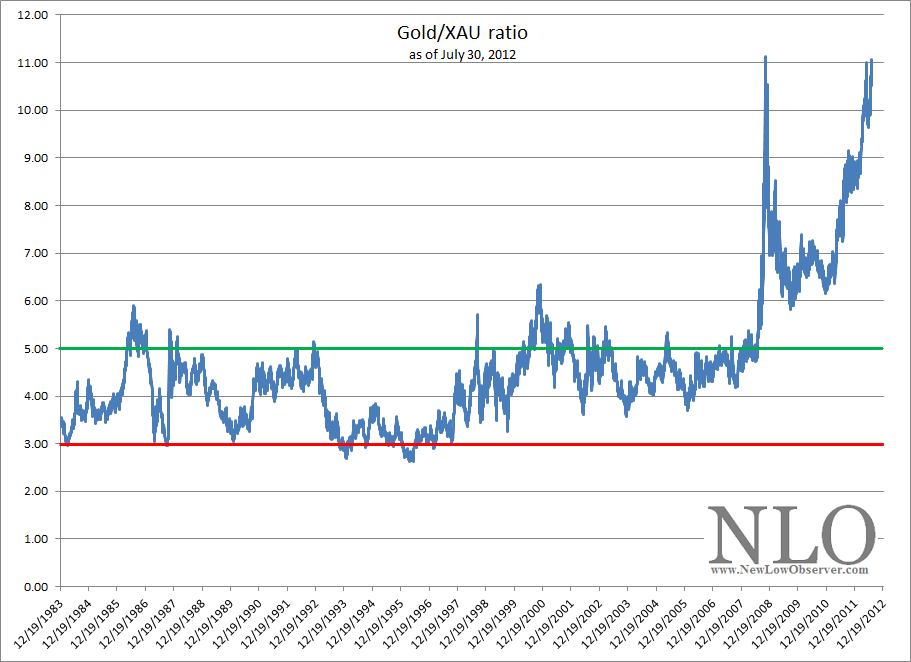
Below is a chart of the Gold/XAU ratio since December 12, 1983:

image

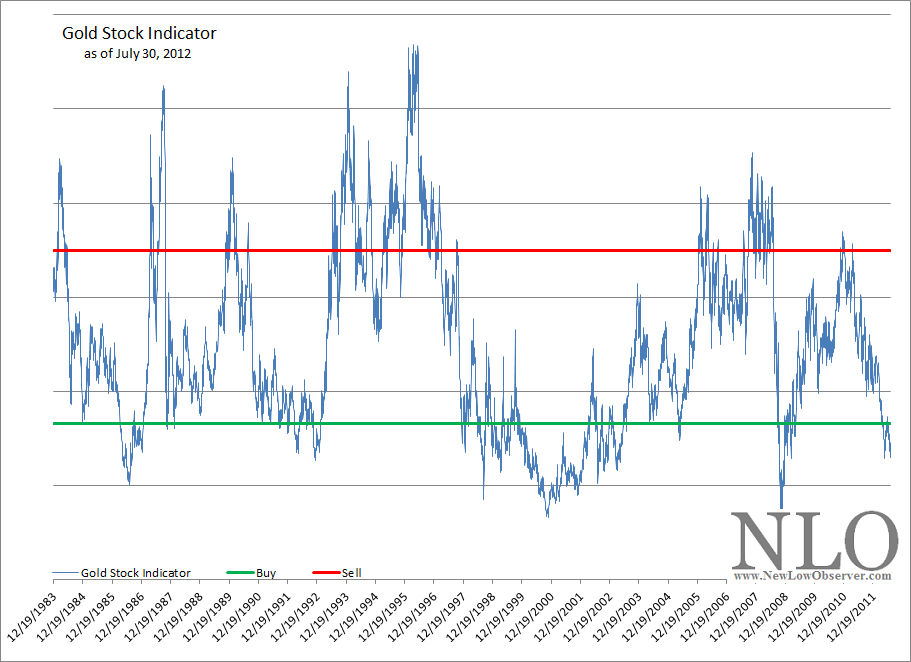
Unfortunately, as gold has transitioned to a secular bull market cycle, the Gold/XAU ratio since 1999 has not provided a consistent signal of when to buy and sell gold stocks. In fact, on July 15, 2008, the Gold/XAU ratio indicated that gold stocks should be bought even as the XAU Index was about to fall an additional –66%.

Also popular among gold investors is the inverse chart of the same ratio known as the XAU/Gold ratio or gold stock/gold ratio. Many variations of these ratios are carelessly used by market commentators with the hope to prove that gold stocks should be acquired. So far, the Gold/XAU ratio has incorrectly indicated that gold stocks are a “buy” for the past 998 trading days in a row. Few who make reference to these ratios are willing to show the full history of these gold and gold stock ratios. In all cases, the ratio is the same and since July 15, 2008 has failed to steer gold stock investors away from significant loses in gold stocks.

In stark contrast, our Gold Stock Indicator had been able to consistently identify long-term opportunities of when to buy and sell gold stocks. Below is the most updated version of our Gold Stock Indicator:

image

At the current level, our indicator suggests that gold stocks should be accumulated. The last time that gold stocks were at the exact same level, gold and gold stocks posted the following returns:

Year(s) Gold XAU
1986-1987 22.35% 84.11%
1987-1989 -4.81% 52.87%
1992-1993 11.03% 66.44%
1997-2006 83.00% 113.54%
2008-2010 64.14% 99.95%
Average gain/loss 35.14% 83.38%

While we recommend accumulating gold stocks at this time, it is important to understand and accept the possible downside risks. Below is the percentage loss that was experienced after each indication to buy gold stocks and before any gains were realized:

1986 -16.57%
1992 -5.92%
1997 -34.54%
2008 -40.81%
Average Decline -24.46%

The 1987-1989 period was excluded from our downside risk data simply because it did not have any loss before moving to the sell indication. If we included the decline after the 1987 buy signal the average loss would have been –19.57% for all five buy signals since 1983. However, we’d like to opt for the more conservative figure of –24.46% to keep our expectation more realistic.

Those who wish to participate in the eventual run up in gold stocks should consider those that are a part of the XAU index. The members of the XAU index are ranked below based on the percentage from the 52-week low:

Symbol Name price P/E EPS Yield Price/Book % from Low % of Index
NEM Newmont Mining Corp. $45.06 97.31 0.46 3.1 1.72 5.12% 10.90%
BVN Buenaventura SA $36.89 11.17 3.31 2.1 2.88 5.45% 4.60%
ABX Barrick Gold Corporation $33.17 8.11 4.1 2.5 1.34 7.26% 16.00%
GFI Gold Fields Ltd. $13.09 9.72 1.34 4.6 1.66 11.70% 4.70%
AU AngloGold Ashanti Ltd. $34.55 894.90 0.04 1.2 240.61 12.61% 6.60%
PAAS Pan American Silver Corp. $15.18 5.19 2.93 1 0.82 12.68% 0.70%
GG Goldcorp Inc. $36.70 22.94 1.6 1.5 1.36 16.30% 14.50%
HMY Harmony Gold Mining Co. Ltd. $10.07 14.30 0.71 1 1.08 17.00% 2.20%
FCX Freeport-McMoRan $34.01 10.19 3.33 3.7 1.95 17.63% 15.70%
KGC Kinross Gold Corporation $8.59 0.00 -1.96 1.9 0.78 20.60% 3.40%
AUY Yamana Gold, Inc. $15.17 19.86 0.76 1.4 1.49 23.00% 5.60%
SLW Silver Wheaton Corp. $28.27 17.48 1.62 1.3 3.59 23.45% 4.80%
GOLD Randgold Resources Ltd. $91.18 19.84 4.6 0.4 3.68 25.11% 4.10%
SSRI Silver Standard Resources Inc. $13.07 15.24 0.86 0 1.06 30.02% 0.50%
RGLD Royal Gold, Inc. $76.63 46.43 1.65 0.8 2.57 34.40% 2.20%
AEM Agnico-Eagle Mines Ltd. $44.16 0.00 -3.3 1.9 2.31 40.80% 3.60%

In theory, the stocks that have the largest weighting in the index contribute the most movement either up or down. However, this may not result in the largest percentage gains that are possible as compared to other stocks in the XAU index. We prefer those stocks that are nearest the low, so we’d opt for NEM, ABX and GG ahead of FCX, BVN and GFI.

Gold stocks that are a part of the XAU index have the benefit of institutional support and the risk of individual implosions. Also, as we’ve explained in our article titled “Why Gold Stocks Will Decline More Than the Markets,” gold stocks are tied strongly to the performance of the general stock market. This was graphically demonstrated in 2008 when gold stocks declined –68% in the period from March 14th to October 27th. Many claim that 2008 was an aberration, our analysis of gold stocks from the 1924 to the present clearly indicates that 2008 was not a fluke. Keep in mind that a –68% decline in the stock index means that individual stocks within the index likely fell much lower, on a percentage basis.

Investors should take their time in acquiring gold stocks as there is some downside risk. However, if 10%-15% of the portfolio is set aside for such investing, there are good opportunities if the purchases are done in stages.

Dow Theory: 1910-1913

image

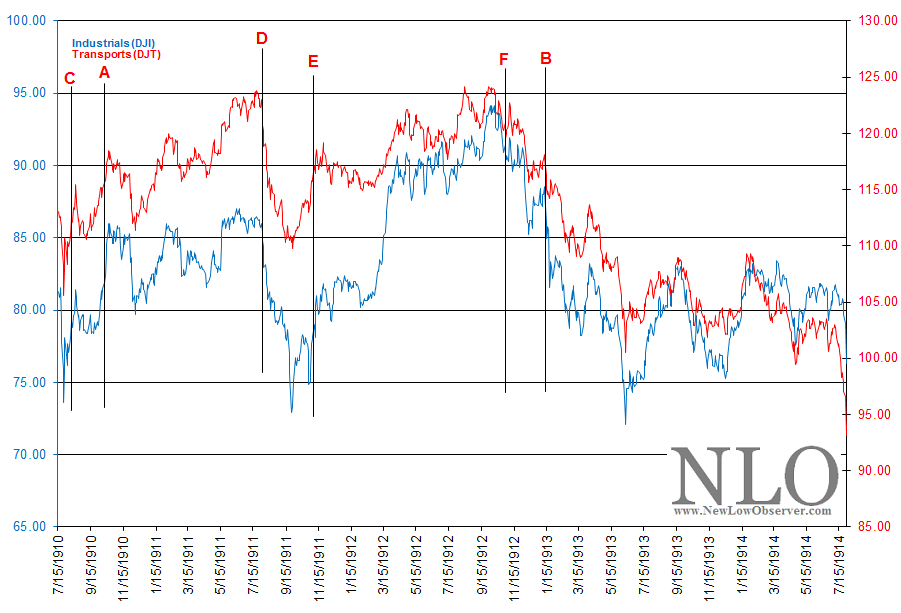
Bull market indication (A): According to the Edwards and Magee book Technical Analysis of Stock Trends, the Dow Theory bull market began on October 10, 1910 when the Dow Industrials and Transports exceeded the August 17, 1910 resistance levels of 81.41 and 115.47, respectively.  The NLO team believes that the bull market began at point (C) when the Dow Jones Industrial Average and Transportation Average exceeded the July 22, 1910 resistance levels of 77.78 and 110.51, respectively.  From the point (C) of the bull signal to the respective market tops, the DJI gained +10.61% and the DJT gained +11.98%.

We also believe that after a bear market signal was issued at point (D) on August 2, 1911, a new bull market indication was issued at point (E), on November 6, 1911, when the Dow Jones Industrial Average closed at 79, above the previous resistance level of 78.34 established on October 16,1911.  The Transportation Index had already gone above the previous resistance level of 114.13 set on October 20, 1911 by closing at 114.46 on October 31, 1911. From the point (E) of the bull signal to the respective market tops, the DJI gained +19.13% and the DJT gained +6.01%.

Bear market indication (B): According to Edwards and Magee, the bear market began on January 14, 1913.  At the time, the Dow Jones Industrial Average was at 84.96 while the Transportation Average was at 115.01. Edwards and McGee never indicated that in between October 10, 1910 and January 14, 1913 there are any other bull and bear signals according to Dow Theory.

However, in our view, as we mentioned above, we believe that a bear market indication was given on August 2, 1911 point (D) when the DJI and DJT were at 84.80 and 120.71, respectively.   The Industrials and Transports fell -13.98% and -9.03% from the August 2, 1911 levels.

After getting a second bull market indication at point (E), a second bear market indication was triggered on November 4, 1912 point (F) when the Dow Jones Industrial Average declined below 90.38 on September 11, 1912.  The Transportation Average had already given the bearish indication on October 25, 1912 by falling below 120.44.  From point (F) to the June 11, 1913 low, the Dow Jones Industrial Average declined –20.21% while the Dow Jones Transportation Average declined –16.55%.

Canadian Dividend Watch List: July 25, 2012

This is a list of Canadian dividend stocks that currently, or in the past, had a history of consecutive dividend increases. For those wishing to find the most complete fundamental information on these companies, we recommend visiting one of Canada’s leading financial websites, the Financial Post (found here). However, Yahoo!Finance probably has the better long-term charts and historical dividend data.

Symbol Name Price P/E EPS Yield Price/Book % from low
IAG.TO Industrial Alliance Insurance and Financial Services 20.74 18.52 1.13 4.60% 0.81 0.92%
PWF.TO Power Financial Corporation 24.2 9.49 2.53 5.80% 1.47 2.46%
IGM.TO IGM Financial Inc. 39.28 11.39 3.45 5.60% 2.26 2.91%
SJR-B.TO Shaw Communications, Inc. 19.58 13.05 1.52 5.00% 2.5 3.43%
TCL-A.TO Transcontinental Inc. 9.42 0 -1.48 6.20% 0.74 3.86%
CCA.TO Cogeco Cable Inc. 35.99 7.06 5.05 2.80% 1.64 4.47%
FFH.TO Fairfax Financial Holdings 376.57 33.21 0 2.70% 0 4.60%
EMP-A.TO Empire Company Limited 55.97 11.22 4.99 1.70% 1.13 4.71%
AGF-B.TO AGF Management Limited 11.29 11.88 1.02 9.60% 0.91 4.73%
GS.TO Gluskin Sheff + Associates, Inc. 13.9 10.22 1.27 4.70% 5.38 5.54%
POW.TO Power Corporation of Canada 22.21 9.1 2.42 5.20% 1.12 6.27%
BNS.TO The Bank Of Nova Scotia 50.61 11.25 4.51 4.30% 1.91 6.46%
CWB.TO Canadian Western Bank 25.78 11.36 2.19 2.50% 1.74 7.42%
CNQ.TO Canadian Natural Resources Limited 27.5 9.96 2.75 1.50% 1.3 7.51%
TRI.TO Thomson Reuters Corporation 28.34 0 -1.61 4.60% 1.42 8.58%
GWO.TO Great-West Lifeco Inc. 20.84 9.6 2.15 5.90% 1.64 8.83%

Watch List Summary

On our list this week is Industrial Alliance Insurance and Financial Services, Inc. (IAG.TO).  Yahoo!Finance indicates that IAG is a provider of  “…life and health insurance company, engages in the provision of various insurance products, savings and retirement plans, and other financial products and services in the United States and Canada.”

According to Dow Theory, IAG has the following downside targets:

  • $20.04
  • $16.90
  • $13.75

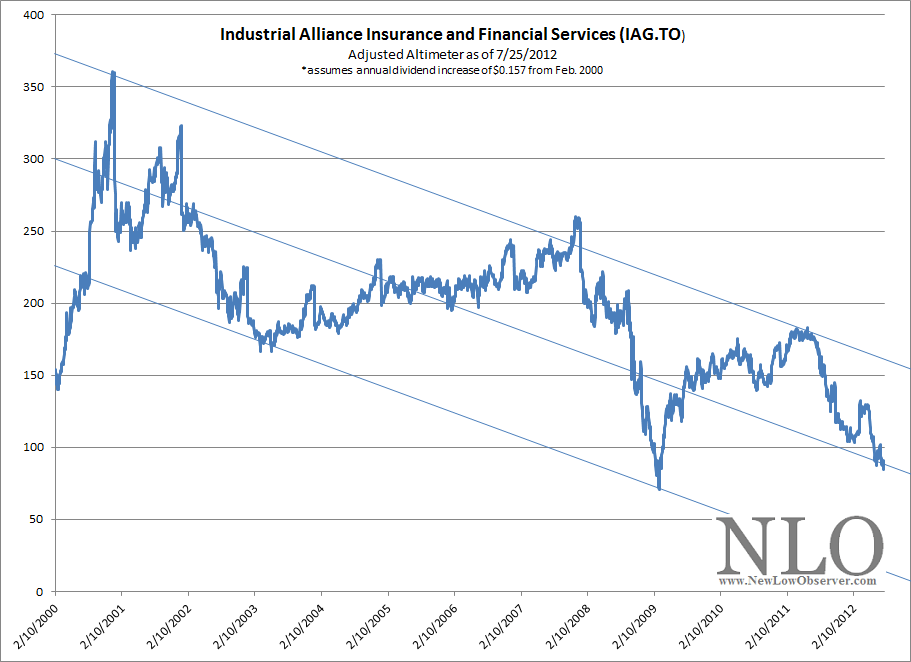
We also ran Edson Gould’s Altimeter on IAG and found that the dividend of the last few years distorted the indicator.  To adequately adjust for the distortions, we provided IAG with an annual dividend increase of $0.0157 from February 2000 to the present annual dividend of $0.98.  Using this adjustment provided us with the following downside targets:

  • $17.15
  • $12.25
  • $7.35

image

Our view is that $16.90 and below are appropriate levels to start acquiring IAG.  Even at the current price, the dividend of 4.60% allows for a slight downside cushion provided it is understood that the stock must be held for 1 year.

NUGT: A “buy” signal eminent

For those willing to speculate with a portion of their funds based on the movement of gold stocks, the Direxion Daily Gold Miners Bull 3X Shares (NUGT) is about to signal a short & long-term buy indication.  We believe this indication will be registered be when NUGT declines below $7.60.  The $7.60 figure seems approximate, however, may change based on market conditions.  Your best confirmation of what we think is an appropriate level to buy NUGT should be based on our Transaction Alert.

image

As we’ve indicated before, we believe that a decline of –30% or more would not be unexpected for NUGT before achieving the average gain of +20% from the initial “buy” signal.  Our strategy for this next indication is to set aside 1/3 of the amount for the initial signal to buy.  If NUGT declines by an additional -15% then we’d buy more shares of NUGT with the remaining 2/3 of available funds set aside.  An example of how this would play out with $3,000 set aside for this speculation from May 3, 2012 for a 20% rise above the initial “buy” signal is as follows:

  • buy $1,000 (1/3) at $11.06 sell and at 20% gain ($13.27)
  • buy $2,000 (2/3) at $9.40 or below then sell at $13.27
  • the average cost would be $9.90
  • a total gain of +34% would be possible if sold at $13.27, or 20% above the initial entry price.

Our purchase of the Direxion Daily Gold Miners Bull 3X Shares (NUGT) is strictly a speculation which we will sell soon after it has achieved our target amount.  Direxion’s DUST and NUGT ETFs are strictly for speculators (short-term) and should not be entered into for investment (long-term) purposes.

U.S. Dividend Watch List: July 20, 2012

Below are the 13 companies on our U.S. Dividend Watch List that are within 11% of their respective 52-week lows. Stocks that appear on our watch lists are not recommendations to buy. Instead, they are the starting point for doing your research and determining the best company to buy. Ideally, a stock that is purchased from this list is done after a considerable decline in the price and rigorous due diligence.

Symbol Name Price % Yr Low P/E EPS (ttm) Dividend Yield Payout Ratio
MATW Matthews International Corp.  28.96 2.15% 12.12 2.39 0.36 1.24% 15%
EXPD Expeditors International  37.05 2.43% 21.42 1.73 0.56 1.51% 32%
CHRW C.H. Robinson Worldwide  56.96 2.91% 21.25 2.68 1.32 2.32% 49%
UNM Unum Group 18.95 3.16% 24.93 0.76 0.52 2.74% 68%
FNFG First Niagara Financial Group  7.555 3.35% 12.59 0.6 0.32 4.24% 53%
JCI Johnson Controls Inc  25.28 4.08% 10.45 2.42 0.72 2.85% 30%
BDX Becton, Dickinson and Co. 74.79 7.47% 13.62 5.49 1.80 2.41% 33%
ANAT American National Insurance 71.09 8.19% 10.00 7.11 3.08 4.33% 43%
AMAT Applied Materials Inc. 10.51 8.35% 10.41 1.01 0.37 3.52% 37%
CAG ConAgra Foods, Inc. 24.13 8.69% 21.54 1.12 0.96 3.98% 86%
HRL Hormel Foods Corp. 28.3 9.39% 16.26 1.74 0.60 2.12% 34%
ABM ABM Industries, Inc. 18.99 9.83% 15.19 1.25 0.58 3.05% 46%
COP ConocoPhillips 55.99 10.61% 6.11 9.16 2.64 4.72% 29%
13 Companies              

Matthews International (MATW) reported earning that fell short of analysts’ expectation by $0.08 or roughly 10%.  In addition to the weak earning, they company guided next year’s earning in the range of $2.34 to $2.40, shy of the consensus expectation of $2.54.  As a result, the stock fell 8.4% on Friday and closed just 2.15% above the 52-week low.  Technical level of $28.50 will be an important level for the stock to hold.  Valueline estimated that the stock typically trades around 13x cash flow.  Currently, it is trading at 8.5x cash flow which tells us the stock is heavily undervalued.  Although dividend yield of 1.24% isn’t anything to brag about, it is extremely safe when the company pays out 15% of their earning.

Johnson Controls (JCI) took a hit this week as the company also reported earning that wasn’t at par with the street.  Analysts got to work right away and revised their price target for the stock. Deutsche Bank downgraded its rating on Johnson Controls from buy to hold, and lowered its price target from $35 (from April) to $32 (26% above current price).  Jefferies & Company reiterated its hold rating but lowered its price target from $28 to $26 (below current price).  UBS kept their rating at neutral and lowered the price target from $28 to $27.  Overall, the street appears to have mixed bag of opinion which range from $26 to $35.  Our proprietary model suggests a fair value of $31, a buy at $24, and a possible downside to $17 being the ultimate bargain bin.

We wanted to highlight the amazing performance of Walgreen (WAG) which rose 13% for the week after coming to term with Express Script.  Anyone lucky enough to scoop up the stock below $30 would have locked in a dividend yield of 3.6%!

Top Five Performance Review

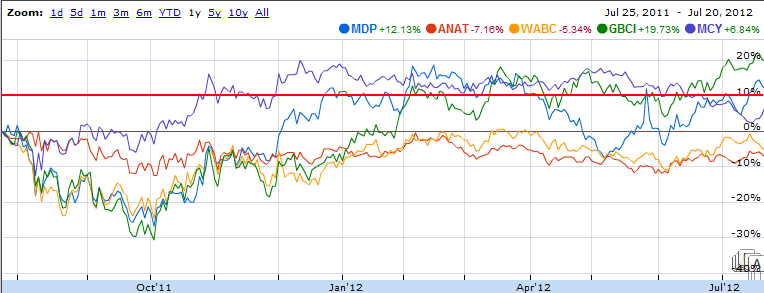
In our ongoing review of the NLO Dividend Watch List, we have taken the top five stocks on our list from July 22,  2011 and have check their performance one year later. The top five companies on that list can be seen in the table below.

Symbol Name 2011 Price 2012 Price % change
MDP Meredith Corp. 29.36 32.92 12.13%
ANAT American National Insurance 76.58 71.09 -7.17%
WABC Westamerica BanCorp.  48.57 45.97 -5.35%
MCY Mercury General Corp. 38.70 41.35 6.85%
GBCI Glacier BanCorp., Inc.  13.12 15.71 19.74%
      Average 5.24%
         
DJI Dow Jones Industrial 12,681.16 12,822.57 1.12%
SPX S&P 500 1,345.02 1,362.66 1.31%

NLO_2012.7.20

Our top five stocks outperformed the market by 4%.  Three out of five companies had a +10% gains within one year.

Transaction Alert: Bought XEC at the Market

On July 17, 2012, we have bought Cimarex (XEC) at the market.

On June 8, 2012 (found here), we outlined our rational for buying XEC based on having good management and a consistent dividend policy.  Based on the Altimeter, XEC is considered worth purchasing at $72 and below.  At the current price of $56, XEC would have to increase +28% just to get back to the $72 level.

At the quarterly dividend rate of $0.12, we believe that XEC should be sold at a price of $123 or above. This will increase or decrease with the dividend policy.  Based on the previous Altimeter buy indications, investors should expect to hold XEC for 2 to 3 years before the next sell signal.

*NOTE: In our earlier transaction alert for UNM (found here), we indicated that we would allocate 10% of our portfolio to the stock.  Instead, we have reduced the allocation by half, to 5%, and bought XEC with the other 5%.  This allows us to take advantage of two opportunities which we fully expect to add to as the price declines.

Transaction Alert: Buying UNM at the market

On July 17, 2012, we will buy Unum Group (UNM) at the market.

On July 16, 2012, it was announced that Unum Group (UNM) is going to increase the quarterly dividend by +23.5%, from $0.10 to $0.13 (found here).  The increased dividend is payable to shareholders who hold the stock on or before July 26th. This increase of the quarterly dividend has brought UNM below the Altimeter level that would indicate that the stock should be bought.

On June 18, 2012, we pointed out the reasons why we like the dividend policy of UNM (found here).  Also, the Altimeter readings for UNM based on the new dividend indicates that, at the current price, the stock is relatively undervalued.

Those wishing to follow our strategy of buying UNM should understand that the stock is expected to decline from current levels.  This explains why we're only putting 10% of our portfolio into the stock at the present time.  Our goal is to accumulate more shares as the price declines.

At the quarterly dividend rate of $0.13, we believe that UNM should be sold at a price of $40.95 or above. This will increase or decrease with the dividend policy.  Based on the previous Altimeter buy indications, investors should expect to hold UNM for 3 to 6 years before the next sell signal.

U.S. Dividend Watch List: July 13, 2012

Below are the 15 companies on our U.S. Dividend Watch List that are within 11% of their respective 52-week lows. Stocks that appear on our watch lists are not recommendations to buy. Instead, they are the starting point for doing your research and determining the best company to buy. Ideally, a stock that is purchased from this list is done after a considerable decline in the price and rigorous due diligence.

Symbol Name Price % Yr Low P/E EPS (ttm) Dividend Yield Payout Ratio
FNFG First Niagara Financial Group  7.61 4.04% 12.68 0.6 0.32 4.20% 53%
EXPD Expeditors International 37.67 4.15% 21.77 1.73 0.56 1.49% 32%
ABM ABM Industries, Inc. 18.19 5.21% 14.55 1.25 0.58 3.19% 46%
UNM Unum Group 19.42 5.72% 25.55 0.76 0.42 2.16% 55%
BDX Becton, Dickinson and Co. 74.42 6.94% 13.56 5.49 1.80 2.42% 33%
WAG Walgreen Co. 30.58 7.19% 10.51 2.91 1.10 3.60% 38%
AMAT Applied Materials Inc. 10.48 8.04% 10.38 1.01 0.36 3.44% 36%
PBI Pitney Bowes Inc  13.9 8.51% 4.06 3.42 1.50 10.79% 44%
COP ConocoPhillips 54.98 8.61% 6.00 9.16 2.64 4.80% 29%
CRR Carbo Ceramics, Inc. 77.8 8.72% 13.82 5.63 0.96 1.23% 17%
CHRW C.H. Robinson Worldwide  60.3 8.94% 22.50 2.68 1.32 2.19% 49%
UTX United Technologies Corp. 73.59 10.05% 15.49 4.75 2.14 2.91% 45%
ANAT American National Insurance 72.34 10.09% 10.17 7.11 3.08 4.26% 43%
APD Air Products & Chemicals 79.84 10.49% 14.39 5.55 2.56 3.21% 46%
BMS Bemis Co Inc 30.15 10.80% 17.95 1.68 1.00 3.32% 60%
15 Companies

New additions to our master database and appearing on our dividend list this week is Applied Materials (AMAT). SEMICON West was held in San Francisco this last week which set the stage for earnings release by companies in the semiconductor industry. Many semiconductor companies are going into the second half of the year more cautious than last year. Chip companies typically start ramping up for the Holiday season at about this time, however, the macro view is uncertain. This leads many companies to push back on their orders. Such push back causes the earnings to be very cyclical for equipment makers such as Applied Materials. Strong balance sheets as well as high dividend yields provide a good opportunity to do research on these firms. Readers may remember that we owned AMAT last year and have taken profits. Another entry point is near and we are getting bullish on AMAT.

A New York based bank, First Niagara Financial (FNFG), topped our list this week after falling -2% during the week.  While the yield of 4.18% and payout ratio of 53% appears to be a sure thing, a quick glance at the balance sheet tells a different story.  The company has $430M in cash and $11B in total debt.  If the economy continued to falter and the market falls further, the bank would likely have to raise capital.  The valuation appears attractive but anyone attempting to purchase the stock should view this as a speculation.

Walgreen (WAG) closed above $30 for the first time in weeks.  We have written commentary on Walgreen on June 21st and nothing material has changed s0 we urge readers to visit that post for our bullish view on the stock.

Top Five Performance Review

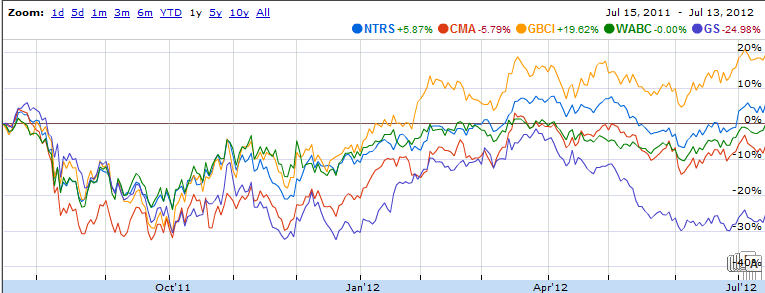
In our ongoing review of the NLO Dividend Watch List, we have taken the top five stocks on our list from July 8,  2011 and have check their performance one year later. The top five companies on that list can be seen in the table below.

Symbol Name 2011 Price 2012 Price % change
NTRS Northern Trust Corp.  44.29 47.05 6.23%
CMA Comerica, Inc. 32.59 30.69 -5.83%
GBCI Glacier BanCorp., Inc.  12.89 15.61 21.10%
GS Goldman Sachs Group, Inc.  130.16 97.43 -25.15%
WABC Westamerica BanCorp.  48 48.22 0.56%
Average -0.62%
DJI Dow Jones Industrial 12,479.73 12,777.09 2.38%
SPX S&P 500 1,316.14 1,356.78 3.09%

NLO_2012.7.13

Our top five stocks underperformed the market by roughly 2-3%.  Only Glacier BanCorp (GBCI) reached our goal of +10% gains within one year.

NUGT: Where to Now?

After posting our Gold Stock Indicator article on April 4th (found here) and suggesting that a low would be achieved between April 4th and June 7th, the actual low was hit on May 15th. This was well within the indicated date range that a major low would be achieved.

The run-up from the low was on April 15th and generated gains of +67%. Additionally, from when the short-term buy indication was first hit on May 3, 2012, the gain was +21%. We weren't savvy enough to get all of the gains from the indicated low, however, the Gold Stock Indicator appears to be hitting its marks with ease.

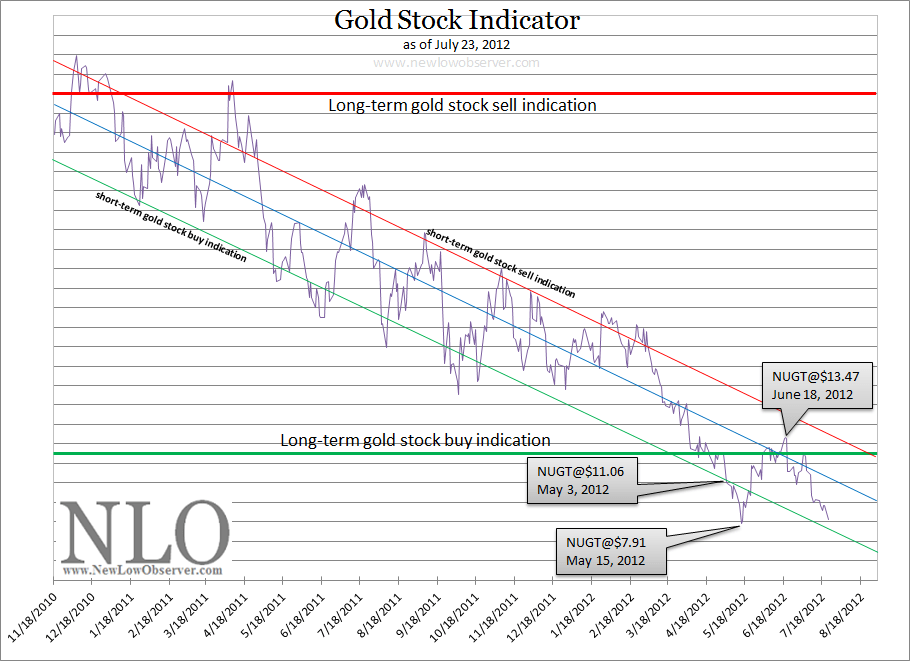
At the current pace, our Gold Stock Indicator has a tentative downside target for NUGT of $6.00 before it crosses simultaneously below both the long-term and short-term buy indications, as seen in the chart below. The estimated time-frame for this downside target is approximately 1 and 1/2 months from now.

image

We expect that the conservative gain of +21% should be expected from NUGT once it first crosses below the short-term buy indication line. Significant downside movement would still remain as was the case after the May 3rd crossing below the short-term buy indication. The amount of decline after the May 3rd indication was -28%, however, the subsequent gains of +21% was achieved in 35 calendar days while the bottom on May 15th achieved gains of 67% in exactly 30 calendar days.

As a caveat, in the same April 4th article, we indicated that “our worst case scenario for a bottom in gold stocks is the period between June 15, 2012 and August 21, 2012.”  Presently, it appears that we are on course to achieve such a worse case situation based on the reversal of the rising trend of the Gold Stock Indicator. Our definition of worse case means a gold price of $1,200 to $1,300 and a NUGT price of $4 or less.