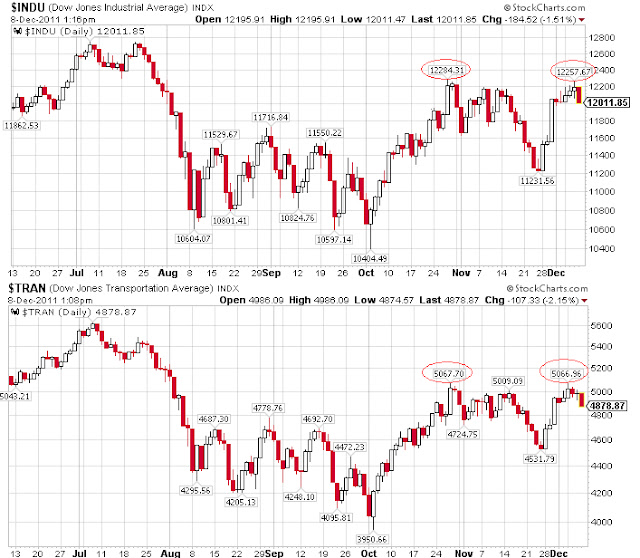
The S&P 500 exploded to the upside on Friday bringing the index into positive territory for the year. It has been a slightly different story for the blue chip Dow Jones Industrial Average, which is up 6% for the year.
There may be some bargains to be had in our list of 21 companies that are within 11% of the low.
December 23, 2011
| Symbol |
Name |
Price |
% Yr Low |
P/E |
EPS (ttm) |
Dividend |
Yield |
Payout Ratio |
| TR |
Tootsie Roll Industries Inc |
23.74 |
4.03% |
32.97 |
0.72 |
0.32 |
1.35% |
44% |
| BMO |
Bank of Montreal |
54.4 |
4.96% |
10.84 |
5.02 |
2.72 |
5.00% |
54% |
| JW-A |
John Wiley & Sons Inc |
43.99 |
5.01% |
15.44 |
2.85 |
0.80 |
1.82% |
28% |
| BCR |
CR Bard, Inc. |
85.12 |
5.35% |
21.88 |
3.89 |
0.76 |
0.89% |
20% |
| FRS |
Frisch's Restaurants, Inc |
19.5 |
5.75% |
22.16 |
0.88 |
0.64 |
3.28% |
73% |
| WST |
West Pharmaceutical |
37.55 |
5.77% |
20.75 |
1.81 |
0.72 |
1.92% |
40% |
| BDX |
Becton, Dickinson and Co. |
74.44 |
6.97% |
13.25 |
5.62 |
1.80 |
2.42% |
32% |
| EXPD |
Expeditors Intl.of Washington |
41.07 |
7.37% |
22.69 |
1.81 |
0.50 |
1.22% |
28% |
| LM |
Legg Mason, Inc. |
24.45 |
8.14% |
14.91 |
1.64 |
0.32 |
1.31% |
20% |
| AVP |
Avon Products, Inc. |
17.48 |
8.64% |
10.28 |
1.70 |
0.92 |
5.26% |
54% |
| OMI |
Owens & Minor, Inc. |
28.13 |
8.74% |
15.80 |
1.78 |
0.80 |
2.84% |
45% |
| MATW |
Matthews International Corp. |
31.07 |
8.75% |
12.63 |
2.46 |
0.36 |
1.16% |
15% |
| AROW |
Arrow Financial Corp. |
23.44 |
9.02% |
12.67 |
1.85 |
1.00 |
4.27% |
54% |
| CAH |
Cardinal Health, Inc. |
40.96 |
9.14% |
16.00 |
2.56 |
0.86 |
2.10% |
34% |
| SCHW |
Charles Schwab Corp. |
11.54 |
9.28% |
17.22 |
0.67 |
0.24 |
2.08% |
36% |
| T |
AT&T Inc |
29.87 |
9.82% |
15.16 |
1.97 |
1.76 |
5.89% |
89% |
| CLX |
Clorox Co. |
66.59 |
9.96% |
19.19 |
3.47 |
2.40 |
3.60% |
69% |
| BMS |
Bemis Co Inc |
29.94 |
10.03% |
15.05 |
1.99 |
0.96 |
3.21% |
48% |
| CWT |
California Water Service |
18.35 |
10.21% |
18.72 |
0.98 |
0.62 |
3.38% |
63% |
| ANAT |
American National Insurance |
72.75 |
10.71% |
11.30 |
6.44 |
3.08 |
4.23% |
48% |
| UTX |
United Technologies Corp. |
74.18 |
10.93% |
13.92 |
5.33 |
1.92 |
2.59% |
36% |
| 21 Companies |
|
|
|
|
|
|
|
Watch List Summary
Tootsie Roll (TR) leads our dividend list by being 4.03% above the one year low. The chart below shows that in the last 13 years, if TR were bought around the current level, a gain of 20% is achieved in the subsequent 18 months or less. According to Dow Theory, the minimum retracement of the current price decline from the high is to $26.40 or 11.20% above $23.74. The downside risk is fairly limited if viewed from the perspective of the 2009 low. At the current price, TR would need to fall -17.81% in order to accomplish the March 9, 2009 low. This is an ideal candidate to consider for a stock that has increased its dividend for 47 years in a row, a dividend payout ratio of less than 50% and an additional 3% stock dividend that has been paid since 1966 to go along with the 1.30% cash dividend.

The Punchline: Tootsie Roll (TR) can be purchased at the current level in large quantities relative to other positions in your portfolio. A second purchase could be done in an equal number of shares if the price declines to the 2009 low.
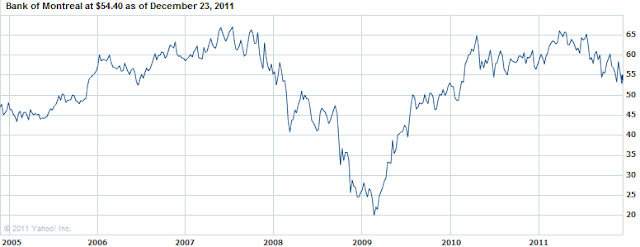
Bank of Montreal (BMO) has fallen –18.37% from the high of April 2011. The one-year low was at $51.83. According to Dow Theory, BMO has established downside targets, from the high, of $51.06, $35.48 and $19.90. It is interesting to note that BMO came close to the first downside target and has reversed. In the short term, we believe that $57.66 is the minimum upside target for the stock based on the established downtrend. However, if the price of BMO goes below the $51.06 level, we should expect a test of the $35.48 level.
The Punchline: If BMO is considered for purchase then it should broken into thirds. Although we favor strong Canadian banks of most U.S. banks, we recommend that any purchase of BMO be small relative to other stock holdings in your portfolio. No additional purchases should be made of the stock rises after the initial purchase.
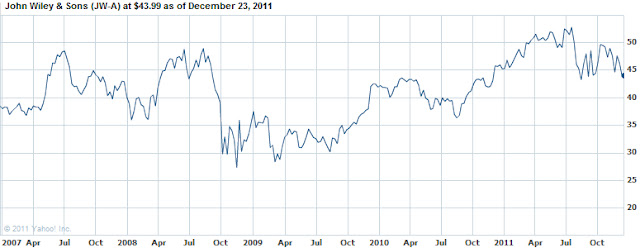
John Wiley and Sons (JW-A) is within striking distance of the 52-week low. According to Dow Theory, based on the low in 2008 to the most recent high, the first downside target is $43.94. However, with the stock currently at $43.99, there is the possibility that JW-A could fall to the second Dow Theory support level of $34.84.
The Punchline: John Wiley is a content provider/aggregator in a world seeking content. Although the stock might be challenged in the short-term, the longer-term picture may favor JW-A. However, we’re waiting for clarity on the $43.94 support level.
Sidenote: A company that is on our radar this week is Cardinal Health (CAH). After soaring to a high of $47 this year, the stock retreated as low as $37. The current yield of 2.1% implied that it is 31% undervalued (based on IQTrends [
http://www.iqtrends.com/] range of 1.6% yield). This is the first time CAH is on our watch list since our recommendation of the stock in June 2009 (
found here). The company spun off the CareFusion (CFN) division since our 2009 recommendation.
Top Five Performance Review
In our ongoing review of the NLO Dividend Watch List, we have taken the top five stocks on our list from December 23, 2010 (not published) and have check their performance one year later. The top five companies on that list can be seen in the table below.
| Symbol |
Name |
2010 Price |
2011 Price |
% change |
| CAG |
ConAgra Foods, Inc. |
22.40 |
26.6 |
18.75% |
| ABT |
Abbott Laboratories |
47.81 |
56.02 |
17.17% |
| SYY |
Sysco Corp. |
29.05 |
29.43 |
1.31% |
| CLX |
Clorox Co. |
63.81 |
66.59 |
4.36% |
| KMB |
Kimberly-Clark Corp. |
63.22 |
73.73 |
16.62% |
|
|
|
Average |
11.64% |
|
|
|
|
|
| DJI |
Dow Jones Industrial |
11,573.49 |
12,294.00 |
6.23% |
| SPX |
S&P 500 |
1,256.77 |
1,265.33 |
0.68% |
Our list from last year did extremely well. The top five beat the Dow by five percentage points, excluding dividends. Four of the top five stocks, except Kimberly Clark (KMB), reached the 10% mark within 6 months.
Disclaimer:
On our current list, we excluded companies that have no earnings. Stocks that appear on our watch lists are not recommendations to buy. Instead, they are the starting point for doing your research and determining the best company to buy. Ideally, a stock that is purchased from this list is done after a considerable decline in the price and extensive due diligence. We suggest that readers use the March 2009 low (or the companies' most distressed level in the last 2 years) as the downside projection for investing. Our view is to embrace the worse case scenario prior to investing. A minimum of 50% decline or the November 2008 to March 2009 low, whichever is lower, would fit that description. It is important to place these companies on your own watch list so that when the opportunity arises, you can purchase them with a greater margin of safety. It is our expectation that, at the most, only 1/3 of the companies that are part of our list will outperform the market over a one-year period.
Please consider donating to the New Low Observer. Thank you.


