Dogs of the TSX 60: October 2019

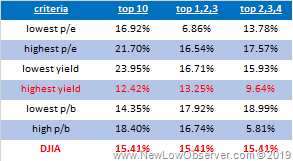
Below we list the performance of the various categories of the TSX 60 as compared to the Toronto Stock Exchange from January 1, 2019 to October 18, 2019.

image

The “Dogs” of the highest yielding category got crushed since our last posting on September 28, 2019.

Repo Dealer Failures 1982-1985

failed dealers

source: Peters, Ralph F. Don't Rush To Regulate Repo Market. New York Times. 14 Apr 1985. F2.

Brokerage Fees: 1982 v. 2019

1982

2019

image

U.S. Dividend Watch List: Top 5 by Ratios

Below is the performance of the top 5 stocks by fundamental ratios that we follow from our watch list dated October 12, 2018:

image

First and foremost is the contrast in performance from the low yield and the high yield stocks.  The low yield stocks gained +11.77% while the high yield stocks lost –23.35%, on average. This is counter to the claim that by investing in the high yielding stocks, investors will outperform the benchmark index. 

In the last year, the S&P 500 gained approximately +7.30% while the Dow Jones Industrial Average gained approximately +5.80%.

Below are the top five stocks by fundamental ratios for the U.S. Dividend Watch List dated October 11, 2019: Continue reading

U.S Dividend Watch List: October 11, 2019

Previous Year Performance Review

In our ongoing review of the NLO Dividend Watch List, we have taken the top five stocks on our list from October 12, 2018 and have checked the performance one year later. The top five companies on that list can be seen in the table below.

Symbol Name 2018 Price 2019 Price % change
MATW Matthews International Corp. 42.68 34.59 -19.0%
FUL HB Fuller Company 45.50 47.27 3.9%
NC NACCO Industries 30.26 65.00 114.8%
PPG PPG Industries 95.09 119.17 25.3%
WHG Westwood Holdings Group Inc. 45.02 28.14 -37.5%
      Average 17.5%
         
DJI Dow Jones Industrial 25,339.99 26,816.59 5.8%
SPX S&P 500 2,767.13 2,970.27 7.3%

The top five companies performed exceptionally well due to an amazing performance from NACCO Industries (NC) which more than doubled its value. NACCO became a pure play in the coal sector after they spun-off Hamilton Beach and Hyster-Yale so we felt that it was a risky proposition. Needless to say, high risk in this instance lead to high reward. Matthews International (MATW) didn't perform as well and lost nearly 20% in a year. Our team was a believer in the value proposition and remain long in this company. However, the large debt obligation is a concern.

U.S. Dividend Watch List: October 11, 2019

This has been a volatile October and we're only half way through. Below are companies on our watch list. Continue reading

Real Estate: October 2019

On December 9, 2010, in an article titled “Real Estate: The Verdict Is In”, we said the following:

“Based on the indicated sources above, we feel that real estate has a six to nine year stretch of rising prices or ‘trading’ in a range and decreased foreclosures.”

Real Estate Prices since December 2010:

image

Foreclosures since December 2010: 

image

As part of the commentary in 2010, the expectation of the 6-9 years of increasing prices is currently showing signs of fatigue as indicated in the year-over-year change of the S&P/Schiller National Home Price Index:

image

Nine years in and there is the increasing chance that the declining year-over-year rate of change since 2013 may be coming to an end.  Although we’d like to see the rate of increase get closer to zero we think that, more or less, the trend could moderate before exceeding the previous year-over-year highs of 2018.

Going back to that December 2010 article, we presented a chart of the Real Estate Loans, All Commercial Banks (REALLN) on a year-over-year basis.  Although December 2010 wasn’t the absolute low in the indicator, it wasn’t long before that level became a distant memory.

image

The points in the chart above, circled in red, are levels showing moderation in the rising trend.  Our belief is that these provide the respite that is needed and expected in a well functioning housing market.  The current moderation after the decline from the 2013 peak suggests that we’re at or near the end of the 9 year half cycle in the 18-year rising trend of real estate.

What did we just say?

We think another round of rising real estate prices is near.  While the indicator can fall further, we think that the current level has been consistent with the 18-year cycle as pointed out by Roy Wenzlick.  For this reason, we think that the next trend in real estate price will eclipse what has already been seen with year-over-year increases reaching double digit levels.  Ideally, this level of increase in real estate will occur after a 1991-like recession.

Rogers Communications 10-Year Targets

Below are the valuation targets for Rogers Communications (RCI-B.TO) over the next 10 years. Continue reading

Deadbeat File: General Motors

According to Propublica’s Bailout Tracker, General Motors received $50.7 billion as part of the Hank Paulson’s bailout of the auto industry.

image

Since the bailout, General Motors has failed to pay back $11.3 billion of the $50.7 billion.

Interest Rate Monitor: October 2019

On November 21, 2015, we said the following:

“While a Fed rate increase is what everyone is waiting for, history suggests that Fed policy  (government regulated) follows short-term Treasuries (market driven).”

We made the commentary because we saw that the 3-month Treasury rate was advancing higher.

Since that time, we’ve watched as the Federal Reserve Bank continues to followed the short-term market rates both up and down.  After the November 21, 2015 posting, we saw, in December 15, 2015, the Federal Reserve increase the Fed Funds Rate for the first time since June 29, 2006.  Again, the Fed Funds Rate increase followed the action of 3-month Treasury.

As with the rate increases in the 3-month Treasury followed by the Fed Funds Rate shortly thereafter, so too did we see the Fed Funds Rate decline after the 3-month Treasury reversed to the downside.  As we said in our April 23, 2019 posting:

“If the current run of stability in rates is anything like the period of 2015 to 2016, we should see a sharp drop in rates…”

image

The chart above highlights the point of our April 23, 2019 claim relative to the actual rate activity that has followed.  Most important is the fact that Fed Funds Rate policy did not take place until four months after the peak in the 3-month Treasury.  Even after the rate decreased in July 2019, it was clear that the Fed would have to catch up for lost ground which is reflected in the September 18, 2019 rate cut.

Below are the targets that we have set for the 3-month Treasury which will be reflected, in direction only, with the Fed Funds Rate. Continue reading

Commodity Index Review: October 2019

Below is a chart of the Bloomberg Commodity Index from 2011 to the present.  Since 2011, there has been only one other period that has come close to the current level in the market. Continue reading

YoY: Helmerich & Payne

Below is a chart of Helmerich & Payne (HP) from 1981 to 2019 reflecting the year-over-year (YoY) percentage change.

Continue reading

Hang Seng Index: October 2019

Below are the remaining downside targets for the Hang Seng Index when applying Dow Theory: Continue reading

Shanghai Composite: Upside Targets

Below are the upside resistance targets for the Shanghai Composite Index for both the short and long-term moves.

Short-Term Targets

Based on the price action since January 2019, the Shanghai Composite Index has conformed to the upside resistance targets ranging from 3,012.38 to 3,378.93.

image

The short-term upside resistance target determines market sentiment for achieving the 3,559.47.  So far, the market appears on course to achieve a re-test of the prior low at 2,464.36.  The theory of the re-test is known as a double top, or in this case a double bottom, as described by Charles H. Dow in 1901.

"Another method is what is called the theory of double tops. Records of trading show that in many cases when a stock reaches top it will have a moderate decline and then go back again to near the highest figures. If after such a move, the price again recedes, it is liable to decline some distance (Dow, Charles H. Wall Street Journal. July 20, 1901.)."

The expectation should be that after obtaining a new low or a new peak, the price will trend in the opposite direction and then re-test the prior extreme level.  In this case, it is the 2,464.36.  This makes the 3,012.38 upside resistance level a reasonable level for expectation on the way to the down from the current level as diagramed in the chart above.

Long-Term Targets

The most important factor to watch for is the long-term trend in the Shanghai Composite.  The chart below outlines the long-term prospects for the index. Continue reading

Dow Theory: October 4, 2019

In the chart below, we see two different stocks showing strongly bullish reversal patterns in the period from July 2017 to October 2019.

image

The line in red saw a bottom in September  2018 while the line in blue saw a bottom in July 2019.  Adding strength to the direction of these two stocks is the persistent inability of the stocks to decline below the yellow support lines. Especially encouraging is the blue line having the ability to bounce in September 2019 and move sharply higher since that time.

Except, the chart above isn’t a couple of stocks and the yellow lines aren’t bullish trends.  Instead, the red line is the Dow Jones Transportation Average and the blue line is the Dow Jones Industrial Average.  The chart is the inverse of the actual pattern and shows what the two indexes have done in the last couple of years.

image

If a stock market analyst is in agreement that the charts at the beginning of this post is showing a bullish reversal pattern then the same analyst should view the actual charts of the same two indexes as exhibiting bearish reversal patterns from the prior trend.

The bear market continues until the dashed red and blue lines are exceeded to the upside.  How do we know we are in a bear market?  The inability of the two market indexes to exceed the prior peaks is one indication.  The other indication is best stated by Charles H. Dow regarding the formation of a line:

Such a narrow fluctuation, to the experienced student of the averages, may be as significant as a sharp movement in either direction. (Rhea, Robert. The Dow Theory. Barron’s. 1932. page 82.).”

At present, a market that meanders sideways or down must earn the patient investor income. For now, there is some time (approximately 3-4 months; if successful) that will have to pass before the upside targets are defied.

Lancaster Colony 10-Year Targets

Below are the valuation targets for Lancaster Colony (LANC) over the next 10 years. Continue reading