
-
Topics
Archives
-
-
Recent Posts
-
-
-
-
Category Archives: Shanghai Composite Index
Hang Seng Index PMI
Posted in Hang Seng Index, PMI, Price Momentum, Shanghai Composite Index
Tagged members
Review: Shanghai Composite Index
Posted in FUTU, Hang Seng Index, PMI, Price Momentum, Shanghai Composite Index, TIGR
Tagged members
Hang Seng Price Momentum
On March 12, 2022, we said the following of the Hang Seng Index:
Shanghai Composite Index Price Momentum
Below is the Shanghai Composite Index from 1999 to 2023 applying the Price Momentum Indicator.
Edson Gould’s Shanghai Composite Upside Resistance Targets
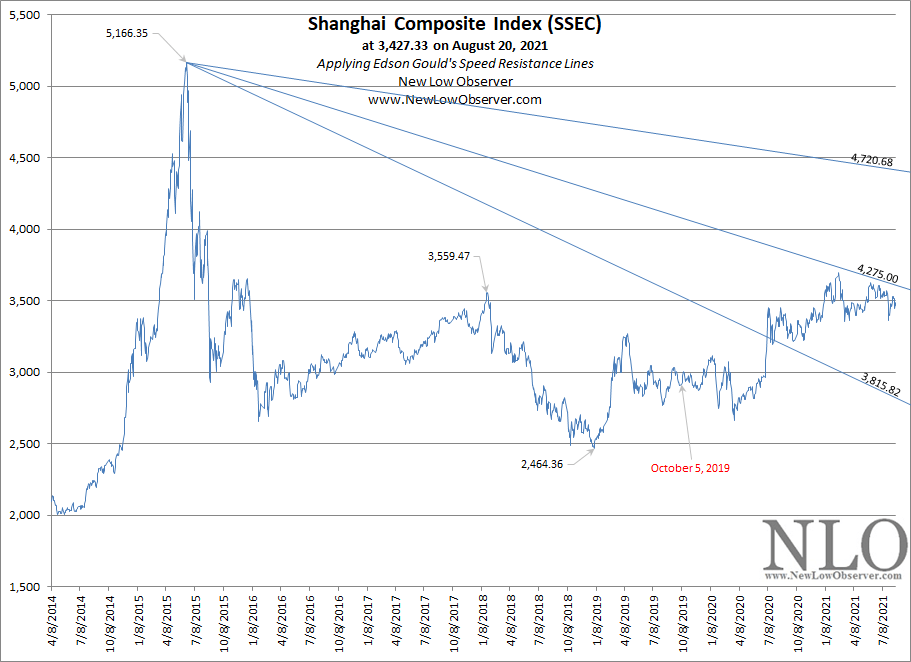
Below are the upside resistance targets based on the work of Edson Gould.
-
3,815.82 (conservative target)
-
4,275.00 (mid-range target)
-
4,720.68 (extreme target)
Our commentary from October 5, 2019 has remained accurate. At the time, we said:
“The more time passes the easier it gets to exceed the minimum upside resistance target of 3,815.82. The problem comes up when the market fails to breakout out on the upside in spite of the passage of time.”
The 3,815.82 target was achieved on what appeared to be strength. However, the 4,275 target has been met with resistance.
See Also:
Shanghai Composite: Upside Targets
Below are the upside resistance targets for the Shanghai Composite Index for both the short and long-term moves.
Short-Term Targets
Based on the price action since January 2019, the Shanghai Composite Index has conformed to the upside resistance targets ranging from 3,012.38 to 3,378.93.

The short-term upside resistance target determines market sentiment for achieving the 3,559.47. So far, the market appears on course to achieve a re-test of the prior low at 2,464.36. The theory of the re-test is known as a double top, or in this case a double bottom, as described by Charles H. Dow in 1901.
"Another method is what is called the theory of double tops. Records of trading show that in many cases when a stock reaches top it will have a moderate decline and then go back again to near the highest figures. If after such a move, the price again recedes, it is liable to decline some distance (Dow, Charles H. Wall Street Journal. July 20, 1901.)."
The expectation should be that after obtaining a new low or a new peak, the price will trend in the opposite direction and then re-test the prior extreme level. In this case, it is the 2,464.36. This makes the 3,012.38 upside resistance level a reasonable level for expectation on the way to the down from the current level as diagramed in the chart above.
Long-Term Targets
The most important factor to watch for is the long-term trend in the Shanghai Composite. The chart below outlines the long-term prospects for the index. Continue reading
Shanghai Composite: February 2019
On August 25, 2015, when the Shanghai Index was trading at 2,964.97, we said the following:
“Our breakdown of the potential reversal points are as follows:
-
2,450
-
2,100
-
1,722”
This was offered up after the Shanghai Composite Index had peaked at 5,166.35. So far, we have been unsuccessful with the 2,100 and 1,722 levels being achieved. Continue reading
Shanghai Composite: December 2018
The devolving situation in the markets makes it necessary to review the downside risk for the Shanghai Composite Index. Below is our newly revised downside targets with the upside resistance levels to watch for. Continue reading
Shanghai Index: Failures and Targets
Market Stimulus is Failing, Big Time
On August 25, 2015, we said the following:
“The actions of the Chinese government have not been constructive for a change in the declining trend of the market. The sooner restrictions intended to stop prices from falling are lifted the better the chance for Chinese stocks to fully recover.”
Since the very first clear intervention by the Chinese government on June 27, 2015, with a surprise interest rate cut, the Shanghai Composite Index has declined –40.77%. The total decline from the 5,166.35 peak on June 12, 2015 has been –48.09%.
That very first stimulus action of cutting interest rates and the laundry list of interventions (partial list here) since is now being compounded by company buyback of shares.

Since 2009, stock buybacks have generally increased over time. However, the year 2018 has seen a dramatic increase that has overshadowed all prior years of data as referenced from the September 12, 2018 Financial Sense article titled “Chinese Government Encourages Share Buybacks As Bear Market Deepens” by contributor Danielle Park.
The intervention is actually causing the process of recovery to take longer than it needs to by providing false hope for investors (large and small) that the turnaround is near. We’ve seen this all before in the Japanese Nikkei Index from 1990 to 2009 when it declined –81% (chart here).
Failure in Our Analysis
On September 26, 2016, we said the following of the Shanghai Composite Index:
“A simple flag or pennant formation seems easy to identify. Now it is time to see if the direction of the index will do a retest of the late January 2016 low.”
If viewed from the perspective of the pennant formation starting from late January 2016, our analysis was a failure, as seen in the chart below. Even if we were to extend and enlarge the pennant from the early January 2016 start date to December 15, 2017, the pennant would have been a failure.
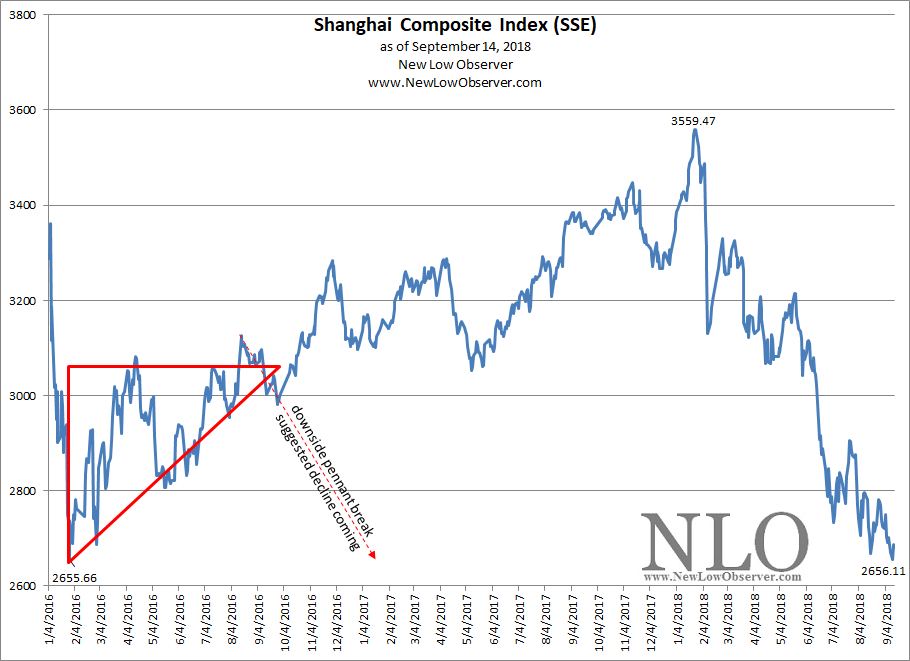
Based on the original analysis, the index was supposed to drop –13% to achieve a retest of the 2,655.66 low. Instead, the index increased +16.50% to 3,559.47 before starting the descent to 2,655.66. The idea of a retest of the prior low is based on Dow Theory and has been proven to be very consistent. However, as analysts, it requires time and patience to see the process through.
Below are the downside targets and the potential upside targets for the Shanghai Composite Index.
Posted in Shanghai Composite Index
Shanghai Composite: Like a Bouncing Ball?
After looking at the Shanghai Composite, we came away with the feeling that the performance of the index looked like the pattern of a bouncing ball. The pattern of a bouncing ball is best illustrated in the image below.

Of course, the mechanical forces of gravity don’t have much to do with the emotions of financial markets. However, in spite of ourselves, we couldn’t help but make the association when it didn’t otherwise fit. Take a look at the Shanghai Composite Index below and tell us there isn’t an uncanny resemblance.
Shanghai Index: Does Stimulus Work?
In past articles, we have pointed to the fact that government stimulus directed at the economy or the stock market has little effect (2016, 2014, 2011, 2009). So it is with little wonder that we look at the situation of the Shanghai Composite Index for indications of the effectiveness of direct stock market intervention by the Chinese government.
On June 27, 2015, after the Shanghai Index had declined more than –20%, the government stepped in to shore up the stock market with a surprise interest rate cut. That rate cut and many other actions that followed was cause for many analysts to carry on with the superstitious belief that government intervention could stop stock market declines and actually boost the market. Many analysts were openly recommending Chinese stocks since the government had openly declared a goal to stop the stock market decline.
The following is a list of known interventions that was presented by Quartz Media writers Heather Timmons and Lily Kuo published on July 28, 2015 in an article titled “A complete list of the Chinese government’s stock-market stimulus”:
-
June 27: A surprise 25 basis point interest rate cut and lowering of the reserves banks need to keep when they lend to companies.
-
June 29: Regulators say pension funds can invest 30% of their net assets (equivalent to more than $100 billion) in equities for the first time.
-
July 1: China’s securities regulator relaxes rules on margin financing, or trading stocks with borrowed money.
-
July 3: China’s central bank extends a 250 billion RMB ($40 billion), six-month loan to state owned banks to “encourage banks to increase support” to weak parts of the economy.
-
July 4: 21 brokerages, led by Citic Securities, say they will invest $19.3 billion in a new blue-chip fund to stabilize the market, and vow not to sell any of their own proprietary equity holdings.
-
July 5: 28 firms planning IPOs on the Shanghai and Shenzhen market say they will postpone them and start refunding investors’ capital.
-
July 5: China’s central bank says it will inject an undisclosed amount of capital into China Securities Finance Corp (CSF), a state-owned company that makes margin loans to brokers.
-
July 6: Executives from mutual funds pledge to support the markets with their own capital.
-
July 8: Regulators banned company shareholders with stakes of more than 5% from selling for the next six months. China’s central bank said it would further support the margin lending provider CSF through interbank lending, bond issuance, and collateral backed financing and re-lending. China’s securities regulator also said it would increase purchases of small-cap stocks.
-
July 9: China’s banking regulator, the CBRC, said banks can now loan money to companies using stock as collateral, and ease margin requirements for wealth management customers.
-
July 9: China Development Bank and the Export-Import Bank of China said they would not sell shares, and look to buy more stock.
-
July 27: Margin lending provider CSF will continue to buy stocks to stabilize the market, and China’s stock market regulator, the CSRC, will investigate “huge stock sell-offs,” the CSRC said.
Since the initiation of these government actions to prop up the stock market, the Shanghai Composite Index declined an additional –34.40% to the low of January 28, 2016 and three years later lingers at a loss of –18.40% based on the starting point of the market stimulus of June 27, 2015. In total, the Shanghai Index is down –35.98% from the peak on June 12, 2015.
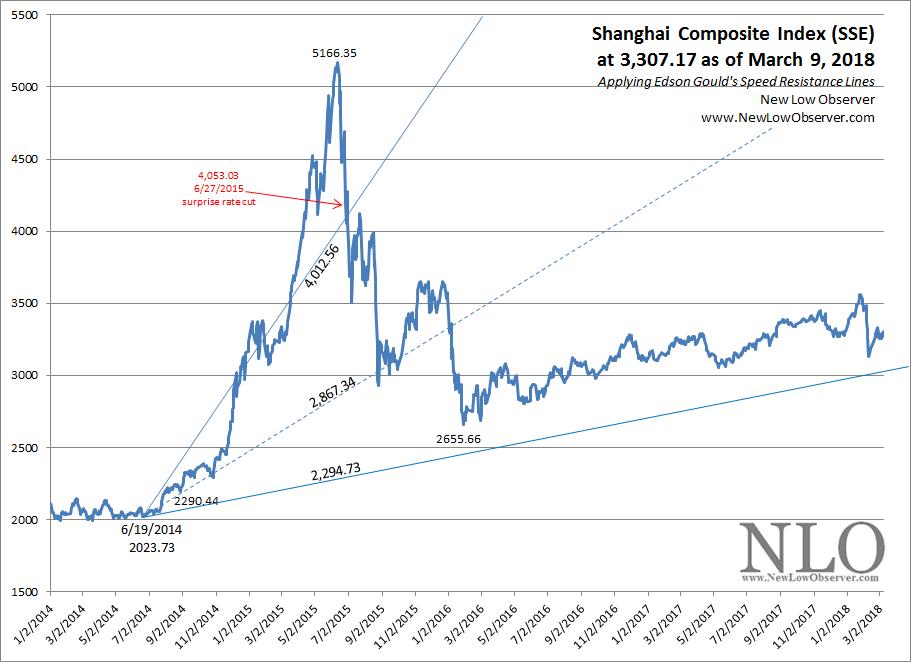
We cannot emphasis enough how government stimulus has marginal long-term impact on the direction of the stock market and the economy. Interestingly, buyers of Chinese ETFs at the current levels would be considered value investors as opposed to those buying in 2015 based on government promises to prop the market.
Posted in Shanghai Composite Index
Shanghai Index: On the Cusp?
A simple flag or pennant formation seems easy to identify. Now it is time to see if the direction of the index will do a retest of the late January 2016 low.

Posted in Shanghai Composite Index
Shanghai Composite Index: Traders, Start Your Engines!
For anyone following the Shanghai Composite Index, we appear to be on the cusp of a significant change in the Index. Below is what we believe to be a “flag” or “pennant” formation that is about to come to a conclusion. First, let’s address what a “flag” or “pennant” formation is from the most credible source on technical analysis.
“A Flag looks like a flag on the chart. That is, it does if it appears in an up trend; the picture is naturally turned upside down in a down trend. It might be described as a small, compact parallelogram of price fluctuations, or tilted rectangle, which slopes back moderately against the prevailing trend (Robert Edwards & John Magee. Technical Analysis of Stock Trends. International Technical Analysis Publishers, Boston. 1991 edition. page 202).”
Additionally, Edwards and Magee said the following of this consolidation pattern:
“These pretty little patterns of consolidation are justly regarded as among the most dependable of chart formations, both as to directional and measuring indications. They do fail occasionally but almost never without giving warning before the pattern itself is completed (Robert Edwards & John Magee. Technical Analysis of Stock Trends. International Technical Analysis Publishers, Boston. 1991 edition. page 211)."
Posted in Shanghai Composite Index
Shanghai Composite Index: Fighting the Tide and Losing
Stock markets have a way of doing their own thing. One of those “things” is fighting the forces of manipulation in the long run. Once such example is the Shanghai Composite Index. Last year it was claimed by many analysts that the Shanghai index would be propped because the government is too highly vested to allow a significant decline. On July 8, 2015, we said the following of the downside risks to the Shanghai Index:
“There is more downside risk if there continues to be restrictions on selling. SSE's next downside target is 2,867. Should see a bounce around that level.”
“Only two downside targets left 2,867 and 1,722. With all the rules killing liquidity, the greater the chance for falling to these levels.”
Since that time, the Shanghai Index declined to the anticipated 2,867 level then rebounded and then declined further. Below is the updated SRL for the Shanghai Composite Index and our recommendation for the upcoming targets.