Category Archives: Shanghai Composite Index

Shanghai Composite Index: Broken Breakers & Downside Targets

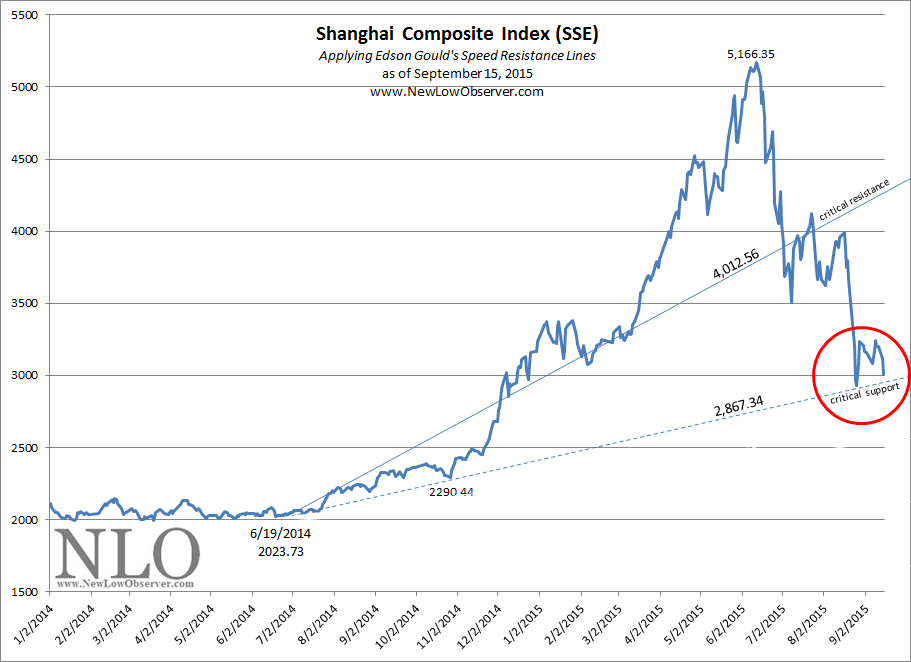
In our last posting of the Shanghai Composite Index on September 15, 2015, we applied Edson Gould’s Speed Resistance Line (SRL) in an attempt to see where the support levels are and downside risk.  At the time we posted the following chart.

image

We had asserted that a decline below the ascending 2,867.34 level would likely mean that there would be a good chance of the index falling to 2,294.73 and 1,722.12.

A Short Circuit in the Regulation

Since our September 2015 posting, it appeared that with government intervention, the stock market was on the road to recovery.  The institution of rules like no short selling, banning of corporations selling stock and government investment funds being required to buy Chinese stocks and limit down or circuit breakers were thought, by the Chinese government, to be a cure to the market decline.  However, such interventions, while well intended, usually treat the symptoms and not the actual problem.

The first obvious failure of the intervention policy has been none other than the circuit breakers as the start of 2016 has not been easy for the Shanghai Composite Index.  Already, trading has been suspended in two of four trading days with circuit breakers being triggered at intraday declines of –7%.  With half of the trading days halted in the new year, Chinese regulators have decided to suspend the use of circuit breakers until a better plan has been formulated.

The way that the circuit breakers were supposed to work was that they would halt trading for 15 minutes after a –5% decline in the Shanghai Composite Index and suspend trading for the remainder of the day after a decline of –7%.  These circuit breakers are modeled after those in place in other markets around the world.  For example, in the U.S., stock exchanges are halted when the market falls –7% and –13% and trading is suspended if the market declines –20%.

The failure occurred when Chinese market authorities and regulators created a narrower band of declines in a market that is less liquid than an exchange like the S&P 500.  If circuit breakers were to be put in place, they should have been at percentages that are much wider than that of the U.S., like halts at –10% and –20% and suspended trading at –30%.

There is a distinction between what the Chinese authorities are doing with circuit breakers as compared to what the U.S. regulators have in place.  The Chinese hope to stop a stock market decline with their narrow band for circuit breakers.  It seems that U.S. regulators want an “orderly” decline with their rules.  Stopping a massive decline in stocks is not possible while an “orderly” decline is a goal that has can be achieved, as demonstrated from October 2007 to March 2009.

Intervention of any sort is not ideal.  However, the perception of having control cannot be avoided by regulators no matter the country.  Since intervention is the rule, the best that Chinese regulators can hope for is to set the expectation that they’re only trying to accomplish an “orderly” decline with circuit breakers rather than stop a decline from happening.  Also, Chinese regulators should acknowledge that their market is young and illiquid relative to other markets.  This means that volatility rules and circuit breakers should reflect this fact.  Make the circuit breakers much wider than the most liquid and oldest markets.

Downside Targets

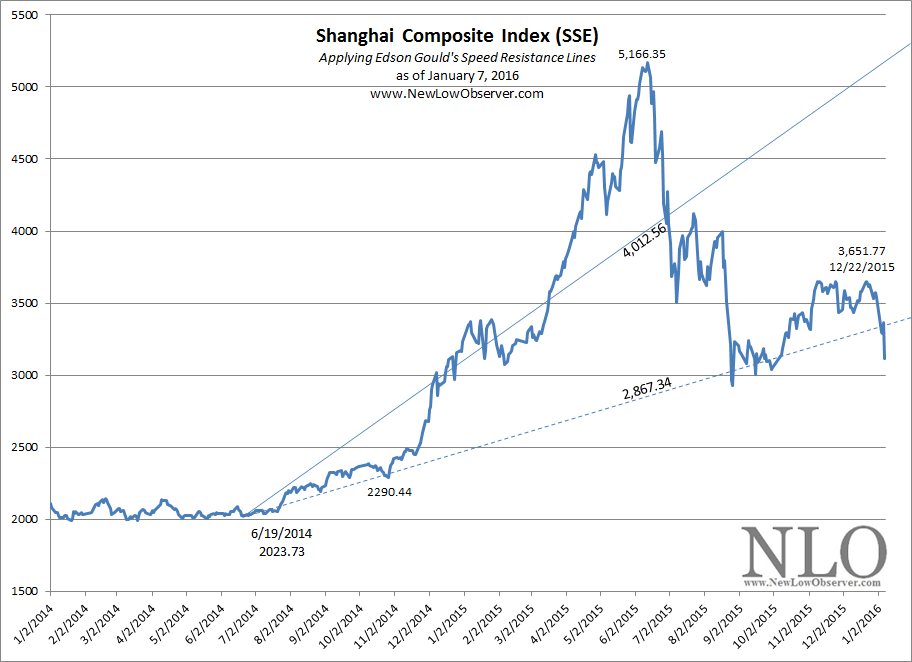
Based on the recent market activity since the December 22, 2015 peak, the support level of 2,867.34 has been broken on the downside.  This suggests that the next stop will be 2,867.34 while 2,294.73 is waiting in the wings.
image

A bounce between 2,867.34 and 2,292.73 should be expected before a continuation of the declining trend.  Any reversal to the upside should experience resistance at the ascending 2,867.34 level.  Historically, a decline to 1,437.70 is not out of the question.

See also:
Shanghai Composite Index: Testing Critical Support

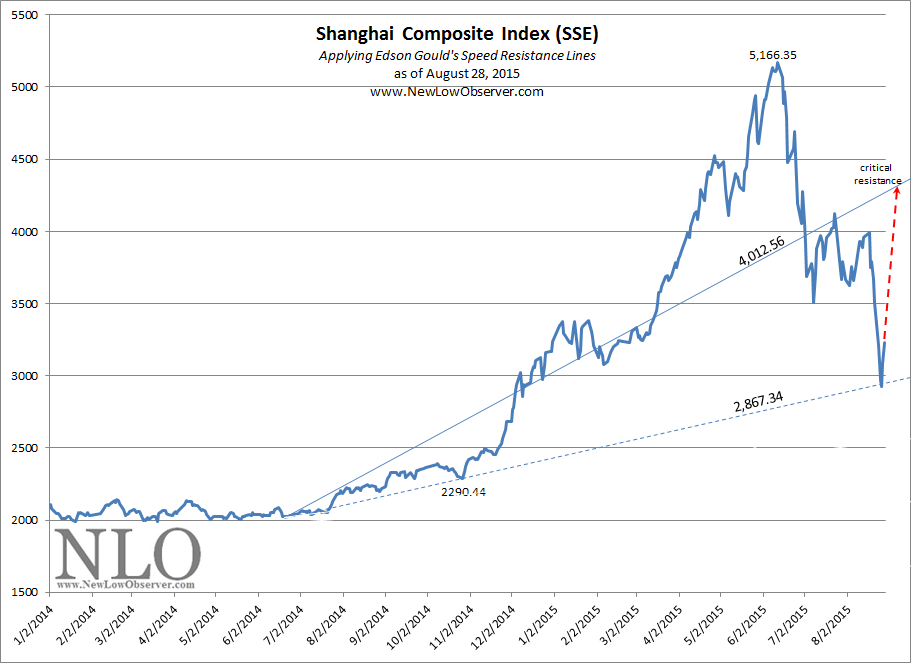
It could get bad if the Shanghai Composite Index cannot sustain the brief increase that it has experience since the August 26, 2015 low.

image

As we touched upon this topic on August 23, 2015, the next downside target could be a long way down from the current level at 1,722.12.  If the current support level of 2,867.34 cannot be maintained then the only downside supports levels are 2,294.73 and 1,722.12.

Shanghai Composite Index: Upside Target

On August 26, 2015, the Shanghai Composite Index traded as low as 2,850.71.  While the most recent rise may only be a bear market rally, we think that resistance to the rise might kick in around the 4,400 level.  Rising above 4,4oo would suggest that a run to the previous peak of 5,166.35 is not out of the question.  Keep in mind that a bull market in this index is not confirmed until the index exceeds the prior high, until that time the Shanghai Composite is in a bear market rally.

image

Shanghai Composite Index: Where To Now?

On August 23, 2015, we said the following:

“The next move in the price to the downside should confirm the downside move or indicate the ongoing battle between buyers and sellers.  The point indicated as the critical support will reveal the overall short-term direction of the index.  Although the move up or down is academic, it is the size of the move that will be most fascinating as we believe it will be massive.”

So far, the Shanghai Composite Index (SSE) has confirmed that the direction of the index is down, now it is only a matter of magnitude.  Already the Shanghai Composite Index has reached the mid-range downside target of 2,867.34.

image

A large bounce at this level is hoped for as a continuation of the declining trend could spark a genuine panic.  If an upside bounce were to occur at this level, the SSE would face resistance at the ascending conservative downside target of 4,012.56.   It would be a +48% rise to the 4,400 ascending conservative downside target from the close of August 25, 2015. 

The flip side of a reversal to the upside is a decline to the extreme downside target of 1,722.12.  Our breakdown of the potential reversal points are as follows:

  • 2,450
  • 2,100
  • 1,722

The actions of the Chinese government have not been constructive for a change in the declining trend of the market.  The sooner restrictions intended to stop prices from falling are lifted the better the chance for Chinese stocks to fully recover.  The more involved the government becomes in the stock market the more we believe that 1,722 on the SSE is likely to occur.

Shanghai Composite Index: Downside Targets

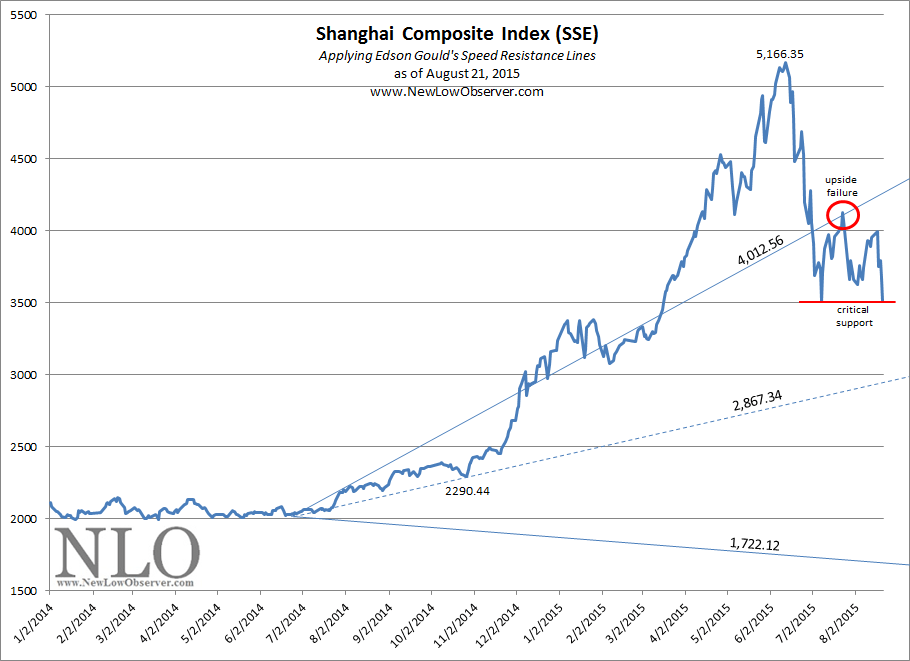
The index to watch in the coming week is the Shanghai Composite Index (SSE) as it represents the raw emotions of the stock market in China.  Below we have applied Edson Gould’s Speed Resistance Lines [SRL] to the SSE to determine the potential downside targets to watch for.

image

The SRL is ideally suited for a stock or index that has experienced a parabolic move to the upside.  When viewed from a historical perspective, the Shanghai Index meets the criteria of entering the entropy stage. 

Already the Shanghai Composite Index has declined below the conservative downside target of 4,012.56.  The July 23, 2015 upside failure coincided with the ascending conservative target.  This is the first true test of weakness in the upside move.  The next move in the price to the downside should confirm the downside move or indicate the ongoing battle between buyers and sellers.  The point indicated as the critical support will reveal the overall short-term direction of the index.  Although the move up or down is academic, it is the size of the move that will be most fascinating as we believe it will be massive.

Because the Shanghai Composite Index has a history of parabolic rises and subsequent crashes, our guess is that  declining to the 1,722.12 level should be expected.  In addition, if the SSE were to replicate the previous rise and fall in the period from 2005 to 2008, the index could drop as low as 1,447.37.