Below are the downside targets for Exxon Mobil (XOM) applying Dow’s Theory. Continue reading

- Japan
- Market Indicator
- Price Momentum Indicators
- Richard Russell
- Silver
- Speed Resistance Lines
- U.S. Dividend Watch List

Below are the downside targets for Exxon Mobil (XOM) applying Dow’s Theory. Continue reading
Below is a chart of Exxon Mobil Corp from 1964 to 2022, reflecting Price Momentum data.
Below is a chart of ExxonMobil Corp. (XOM) from 1964 to 2022, reflecting Price Momentum data.
Below are the valuation targets for ExxonMobil (XOM) for the next 10 years. Continue reading
The large market decline on Friday brought the Dow Jones Industrial average below 18,000 and the Nasdaq below 5,000. The key data point was from the Federal Reserve meeting and a sign that interest rate hike could come sooner rather than later. Even though the jobs report came out stronger-than-expected, the expectation that rate could rise as soon as June took the market by surprise. With that pull back, our watch list expanded to include 74 companies we will highlight the 25 companies which are at or near its 52-week low. Continue reading
The market finished the week on a high note with the S&P 500 closing at all-time highs. The blue chip Dow Industrial Average topped its all-time high as well, closing at 18,144. The deal to extend Greece’s aid for four months may have been the catalyst but we believe that the market climbs a wall of worry. Despite bullish market sentiment, our watch list contains 50 companies, suggesting that there is interal weakness in the market. While not all fifty companies are worth considering, there are pockets of opportunity. Continue reading
Below are the 10 companies on our U.S. Dividend Watch List that are within 11% of their respective 52-week lows. Stocks that appear on our watch lists are not recommendations to buy. Instead, they are the starting point for doing your research and determining the best company to buy. Ideally, a stock that is purchased from this list is done after a considerable decline in the price and rigorous due diligence.
Posted in BRK-A, CAT, ExxonMobil, NLO Dividend Watch List, Warren Buffett, XOM
Tagged members
We’ve noticed an interesting pattern which may suggest that the Dow Jones-UBS Commodity Index is nearing the low. In the chart below, we show (at the red circles) the exact same percentage difference between the long-term technical support (red line) and the 2002 and 2013 low. That percentage difference, approximately 7% in both cases, is all that stands between the two low points and the support level. Our primary question is, will the most recent low sustain a double bottom as was the case in the 2001-2002 period?
Already we have indicated the extreme downside target for the commodity index at 79.32, based on the work of Edson Gould’s Speed Resistance Lines. However, if we are in a commodity bull market, as we’ve made reference to in our January 1, 2009 article titled (found here), then there is a good chance that a bounce at the long-term technical support line would mark the end of the cyclical bear move in commodities.
Comments Off on Has the Dow Jones-UBS Commodity Index Reached the Low?
Posted in Dow Jones-UBS, ExxonMobil, gold, gold bugs, Sysco, SYY, XOM
Below are the 11 companies on our U.S. Dividend Watch List that are within 11% of their respective 52-week lows. Stocks that appear on our watch lists are not recommendations to buy. Instead, they are the starting point for doing your research and determining the best company to buy. Ideally, a stock that is purchased from this list is done after a considerable decline in the price and rigorous due diligence.
Below are the approximate ex-dividend dates for the month of February 2013 for companies that appear on our U.S. Dividend, Nasdaq 100, Dow Jones Transportation/Industrial Index and International Dividend Watch Lists. All companies are ranked by ex-dividend dates.
Companies that show up on our Watch Lists could be considered the equivalent of the bargain bin of high quality blue chip stocks. Because these companies have increased their dividends every year for at least 10 years in a row (or have had similar dividend policies in the past) or are part of major indexes and within 20% of their respective 52-week low, you know that you’re not overpaying for a company that has demonstrated profitability and the ability to rebound from challenging times.
| Symbol | Company | Price | % from yr low | Qtrly Yield | payout ratio | Ex-date |
| (IBM) | International Business Machines | $203.19 | 11.71% | 0.43% | 23.66% | 2/6/2013 |
| (AA) | Alcoa Inc. | $8.93 | 12.17% | 0.33% | 66.67% | 2/6/2013 |
| (FNFG) | First Niagara Financial Group Inc. | $7.98 | 12.41% | 1.00% | 80.00% | 2/6/2013 |
| (BBT) | BB&T Corporation | $30.92 | 15.04% | 0.75% | 34.07% | 2/6/2013 |
| (CWT) | California Water Service Group | $19.36 | 14.99% | 0.80% | 58.72% | 2/7/2013 |
| (XOM) | Exxon Mobil Corporation | $89.79 | 16.31% | 0.63% | 23.51% | 2/7/2013 |
| (ALTR) | Altera Corp. | $34.49 | 16.46% | 0.30% | 23.26% | 2/7/2013 |
| (SJW) | SJW Corp. | $26.45 | 17.24% | 0.65% | 59.84% | 2/7/2013 |
| (WBS) | Webster Financial Corp. | $22.44 | 18.64% | 0.45% | 21.51% | 2/8/2013 |
| (AAPL) | Apple Inc. | $455.49 | 4.44% | 0.58% | 24.03% | 2/11/2013 |
| (STBA) | S&T Bancorp Inc. | $18.47 | 17.79% | 0.80% | 50.85% | 2/12/2013 |
| (MSEX) | Middlesex Water Co. | $19.51 | 11.96% | 0.95% | 87.21% | 2/13/2013 |
| (UMH) | UMH Properties Inc. | $10.38 | 12.45% | 1.75% | 514.29% | 2/13/2013 |
| (BRCM) | Broadcom Corp. | $32.56 | 13.81% | 0.33% | 35.20% | 2/13/2013 |
| (BA) | The Boeing Company | $76.20 | 13.96% | 0.65% | 37.96% | 2/13/2013 |
| (DD) | E. I. du Pont de Nemours | $47.77 | 14.74% | 0.90% | 58.31% | 2/13/2013 |
| (GRC) | Gorman-Rupp Co. | $29.88 | 17.13% | 0.33% | 28.37% | 2/13/2013 |
| (RBA) | Ritchie Bros. Auctioneers | $21.18 | 18.87% | 0.55% | 62.03% | 2/13/2013 |
| (EGN) | Energen Corp. | $47.80 | 19.21% | 0.30% | 16.52% | 2/13/2013 |
| (PRK) | Park National Corp. | $65.80 | 8.55% | 1.43% | 77.05% | 2/20/2013 |
| (MHP) | The McGraw-Hill Companies, Inc. | $46.99 | 12.91% | 0.48% | 37.09% | 2/22/2013 |
| (BOH) | Bank of Hawaii Corporation | $48.36 | 16.74% | 0.93% | 49.05% | 2/26/2013 |
| (CTWS) | Connecticut Water Service Inc. | $29.38 | 9.78% | 0.83% | 61.78% | 2/27/2013 |
| (TRMK) | Trustmark Corporation | $23.48 | 12.84% | 0.98% | 50.83% | 2/27/2013 |
| (MCD) | McDonald's Corp. | $95.29 | 14.33% | 0.80% | 57.46% | 2/27/2013 |
| (AJG) | Arthur J Gallagher & Co. | $37.88 | 12.12% | 0.93% | 88.05% | 2/28/2013 |
Watch List Summary
The first stock on our list is IBM (IBM). After our April 19, 2012 titled “What Does Warren Buffett See In IBM?” (found here) the stock has been in a consolidation pattern. Despite the critics, IBM managed to fall within 5% of the 52-week low on November 14, 2012. With the stock currently trading within 12% of the 1-year low and a healthy payout ratio of 24%, the stock is well positioned for those interested in long-term positions. We’re including an updated version of Edson Gould’s Altimeter which suggests that IBM is significantly undervalued based on the on dividend relative to the stock price.

According to Gould’s Speed Resistance Lines, IBM has the downside targets of $137.45 and $72.
Another notable stock on our list is Apple with an ex-dividend date of February 11, 2013. On April 14, 2012, we projected the conservative downside target for Apple (AAPL) at $424.15 and the extreme downside target of $212.08 (found here). On an intraday basis, Apple fell within 3% of our April 2012 conservative downside target. Regardless of the market conditions, according to Dow Theory, Apple has upside targets of $528.28 and $616.68 before re-testing the previous highs.

If you happen to be researching these companies for potential investment, it would be advisable to consider the ex-dividend date prior to possible purchases. Owning the shares of the company that you're interested in before the ex-dividend date entitles you to the upcoming dividend payment.
Owning the shares on or after the ex-dividend date means that you would have to wait at least three months before receipt of the next dividend payment. Please verify the ex-dividend date and payout ratio before committing funds to these stocks. Additionally, do not base your next long or short-term purchase on the dividend payment or yield. Instead, get as much research in as you possibly can before the ex-dividend date "just in case" you're actually interested in buying the stock. Payout ratios that exceed 100% should be considered speculative investments.
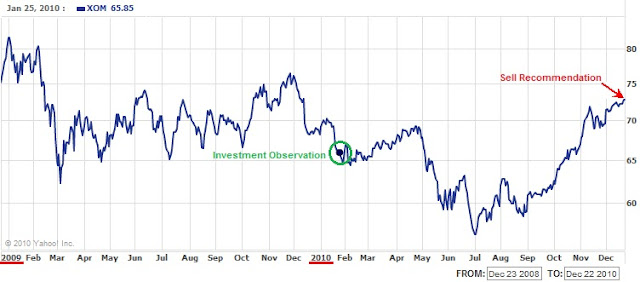
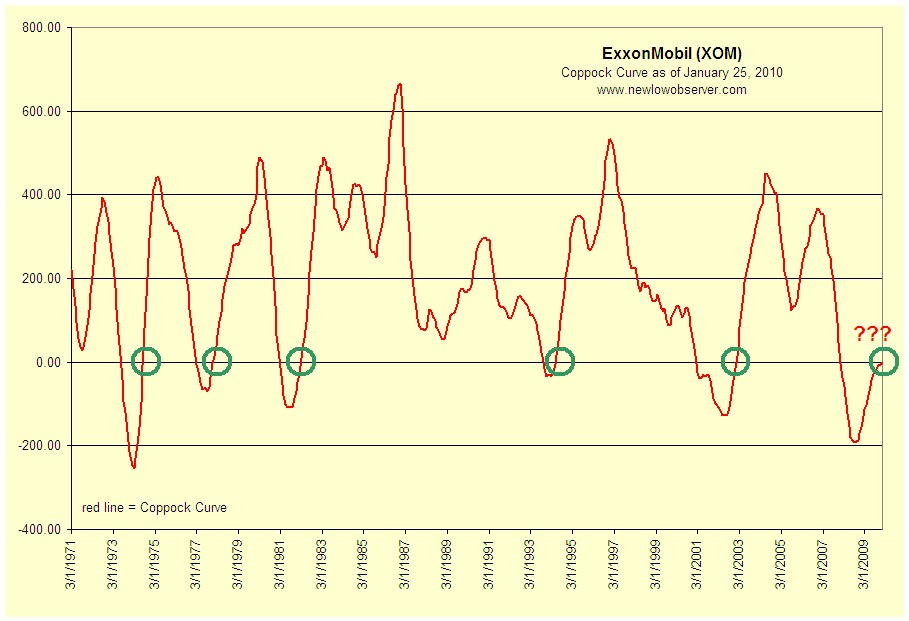
“…based on the prior Coppock Curve indications, XOM is expected to remain unchanged or fall for another three to six months by about 11% to 18%.”
“If we were to invest in stocks the way that Charles H. Dow would then we would buy half of the intended amount now and purchase the second half if the price declines. For example, let's say that you wanted to invest $13,180 in this company. What you would do is buy $6,590 worth of stock now (approximately 100 shares) and hold the stock if the price goes up. If the stock goes down then you would invest the remaining $6,590 at the next level that you felt was ideal. This approach works well regardless of the market that you're in as long as you set aside the amount that you intend to invest before making the first purchase. Also, after making the first investment never invest the second half somewhere else.”
-Touc
Posted in Coppock Curve, investment observation, XOM