For gold stock investors, a timing strategy is the most effective way to match or beat the coming metal price increase. Among our caveats, we’re excluding junior and exploration mining companies which will either go out of business, experience share price booms or get acquired by peers or the majors. What follows is our examination of whether the lagging gold stocks, the inability of gold stocks to perform equal to or greater than the price of physical metal, is unique to our time or a fundamental hallmark of gold bull markets.
There is considerable discussion about the divergence between the price of gold and gold stocks. In the divergence, the price of gold has tended to rise to new highs while gold stocks (majors) either trade in a range, decline or increase at a tepid rate compared to the physical metal.
Some argue that due to the divergence, gold stocks represent the best investment opportunity because inevitably, the stocks will catch up with the metal. Others say that, the lack of confirmation of gold stocks to exceed prior highs is an indication that the metal is overvalued or needs to decline.
Unfortunately, although both points seem well reasoned (along with many other explanations), evidence from the previous gold bull market suggests that gold mining majors typically underperform the metal. The primary source that we’re drawing from is Richard Russell’s Dow Theory Letters from 1970 to 1979 with data points confirmed in Barron’s and Kitco.com for the respective dates.
On numerous occasions, Richard Russell would express his concern for the divergence between the price of gold and gold stocks. Below are Russell’s observations of the failure of gold stocks to follow the price of gold higher:
“Meanwhile, despite the recent highs in the price of gold bullion, the gold stocks are not keeping up with the price of the yellow metal. I have received many calls from subscribers asking why.” (Richard Russell, Dow Theory Letters, May 17, 1972, Letter 529, page 6.)
“The general feeling seems to be that the gold stocks have been discounting [falling in advance of] a decline in bullion.” (Richard Russell, Dow Theory Letters, September 27, 1974, Letter 610, page 6.)
“‘What’s happening to the shares’ I am asked. ‘Why don’t they move with gold?’” (Richard Russell, Dow Theory Letters, January 2, 1975, Letter 618, page 5.
“At the bottom of the chart is the Barron’s Gold Average (stocks). This may move, too, but this Average has a long way to go to hit its 1974 high while gold could better the old 200 high easily. That should tell us something. And it’s the reason I’ve been saying all along-gold, not gold stocks.” (Richard Russell, Dow Theory Letters, November 9, 1977, Letter 713, page 5.)
“Since Barron’s Average is very heavily weighted in favor of ASA, we are looking to a large extent at the relative performance of the S. African gold shares against bullion. The picture is clear enough. The market, since mid-1974. has preferred bullion to the gold shares. And who am I to argue with the market? That’s the reason I’ve been recommending gold, not the shares.” (Richard Russell, Dow Theory Letters, February 17, 1978, Letter 722, page 6.)
“Since late-January the gold stocks have been reactionary whereas gold has been hitting new 1977-78 highs. In March both stocks and the metal declined, and as you can see the stocks broke below their February lows. Yet the metal has not confirmed on the downside, holding well above its February low. I take this non-confirmation as a bullish indication. I think it is telling us that the metal will not respond to gold share weakness, and it is telling us that the metal ‘wants’ to go to new highs. Whether the stocks will follow is another story.” (Richard Russell, Dow Theory Letters, April 5, 1978, Letter 726, page 6.)
“My chart of gold and the gold averages (see page 6) is now showing a dramatic divergence. The gold stock average has broke” below its November low, but the bullion price has held well above that point.” (Richard Russell, Dow Theory Letters, May 5, 1978, Letter 729, page 5.)
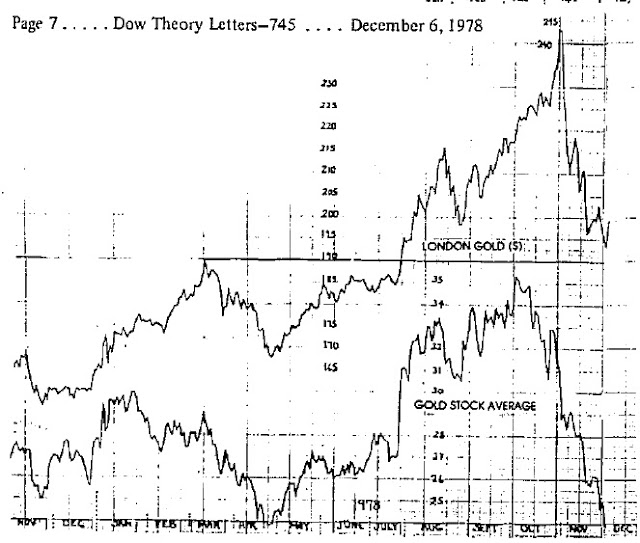
“This non-confirmation between gold and the gold stock average which I discussed in the last Letter is still in force. Many feared that the reactionary tendencies [decline] in the gold shares were calling for a correction in gold. For this reason many advisors have been telling their clients to sell their gold or even short gold. The consequences have been unhappy for the sellers, disastrous for the shorts.” (Richard Russell, Dow Theory Letters, November 1, 1978, Letter 742, page 5.)
“My chart of gold bullion (daily) and the Gold Stock Average (GSA) documents the extraordinary divergence which continues to build between gold and GSA. Why did gold and GSA rally in tandem up to the October highs and why are the gold shares so
reluctant now?” (Richard Russell, Dow Theory Letters, February 28, 1979, Letter 751, page 7.
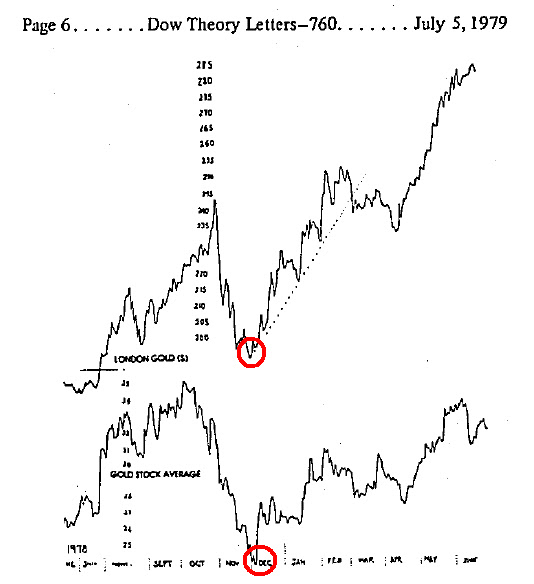
“My chart of daily gold and the gold stock average (GSA) continues to picture divergence, with Campbell Red Lake and ASA stubbornly refusing to move back to their October highs.” (Richard Russell, Dow Theory Letters, July 5, 1979, Letter 760, page 6.)
“I obviously cannot tell at this time whether gold is going to surge above 307 to a new high- or whether gold is in the process of topping out. The gold stocks have been weak, and my gold stock average has broken below the three minor bottoms. But so far, even weakness in the gold shares has not rubbed off on the metal.” (Richard Russell, Dow Theory Letters, August 15, 1979, Letter 763, page 6.)
To add to the consternation of gold stock investors, the period after the peak in the price of gold in January 1980 showed gold stocks held up better than the metal. This threw off “seasoned” gold investors because it gave the false impression that gold’s collapse would recover somehow. The following is Russell’s comments on this matter after the peak:
“The gold stocks did not act during the 1980 decline the way they did during the 1974 debacle. This time they tended to hold very well. Now they are looking bullish (despite the many troubles, the increasing troubles in So. Africa). The shares, in other words, show good relative strength against the metal. This is a good sign for gold in general.” (Richard Russell, Dow Theory Letters, June 4, 1980, Letter 784, page 5.)
Although gold stocks are a leveraged play on the price of gold, there are critical points in time when gold stocks should be bought and then sold in order to take advantage of the leveraged characteristics. Those who buy and hold gold stocks for the “long term” will be disappointed with the performance as compared to the price of gold. Therefore, it is necessary to have a timing indicator that will highlight the best times to invest in gold stocks.
Below we have constructed a gold stock indicator based on the Philadelphia Gold and Silver Stock Index (XAU) which reveals the best times to accumulate and dispose of gold stocks. The points above the red line indicates the time to sell gold stocks and the points below the green line indicate when to buy gold stocks. We’ve taken the liberty of considering a sell indication whenever the indicator first reaches the red zone on a move to the upside and a buy/accumulate when the indicator first falls to the green line on a move to the downside.
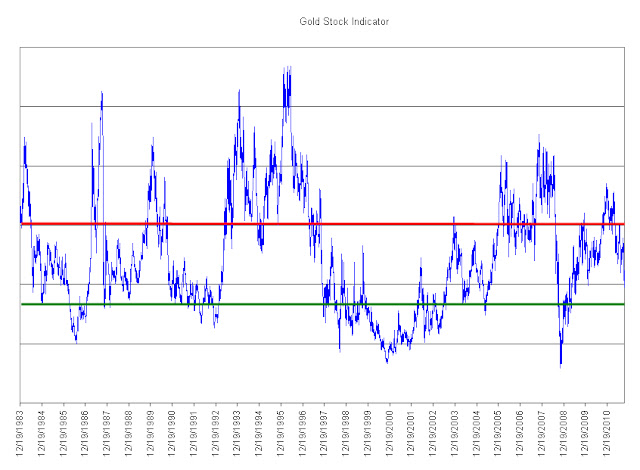
On average, sell indications occurred after a +52% increase in the XAU index. This does not account for the individual performance of gold stocks that are constituents of the index. The consistency of our Gold Stock Indicator reflected the best times to acquire the major gold stocks as well as the most ideal times to sell the gold stocks.
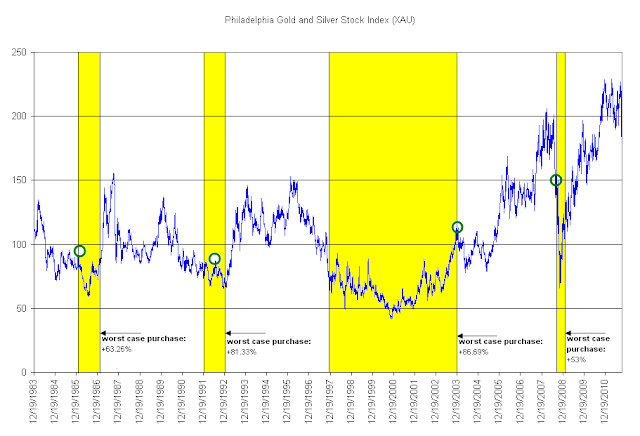
On the chart of the Philadelphia Gold and Silver Stock Index (XAU) above, we have shown where the indicated “buy/accumulate” recommendations would have taken place in yellow. The green circles show what would have happened if the purchase occurred at the worst possible time in the given period and is measured to the respective peaks in the XAU index soon after. As mentioned in many prior articles, we always account for at least -50% downside risk with any investment position that we take. This appears to be a minimum requirement when applying our indicator to the purchase of constituents of the Philadelphia Gold and Silver Stock Index (XAU).
For an investor who wishes to accumulate gold shares from within the XAU index, they would benefit from well timed purchases rather than getting whip-sawed by a wildly gyrating index that will inevitably underperform the price of gold in the “long-term.” We have identified the top five stocks that are likely to outperform the XAU index when the next buy signal is given. The five companies are AngloGold (AU), Yamana Gold (AUY), Gold Fields (GFI), Randgold (GOLD) and Royal Gold (RGLD).
The obvious alternative to buying gold stocks is with the physical asset. The paper version of gold is the SPDR Gold Shares (GLD). Although not truly tested through a full gold bull and bear cycle, GLD remains the among the most popular ways to “invest” in the physical asset. Our preference is for the non-paperized version of gold in the form of one-ounce coins.
As has been demonstrated in the gold bull market from 1970 to 1980, gold stocks (the majors) will generally underperform the price of gold. Those who are bound and determined to buy gold stocks can pursue the juniors and explorers which provide a wide range of outcomes that are independent of the price of gold (but helped by the rising value of gold) based on new discoveries, getting acquired or going bust. The alternative, buying the majors, should be done with a well constructed strategy that does not rely on hold-and-hope.