
-
Topics
Archives
-
-
Recent Posts
-
-
-
-
Category Archives: gold
Gold Stock Indicator: XAU and Barron’s Gold Mining Index
In this post, we’re going to review our Gold Stock Indicator from two perspectives, the Philadelphia Gold and Silver Stock Index (XAU) and the Barron’s Gold Mining Index (BGMI). We were curious about how closely the XAU Index and BGMI would look when applying our GSI formula. We’ve never had the BGMI data set until yesterday. The BGMI data goes back to 1973 while the XAU data goes back to 1983. Based on the charts that we’ve drawn below, we believe that our prior analysis, based on the GSI for the XAU, is confirmed and correct using the last 40 years of data for the BGMI.
Gold: Conservative Downside Target Met
On March 3, 2013 (found here), we posted the conservative and extreme downside targets for the price of gold with the following commentary:
”According to Edson Gould’s Speed Resistance Lines (SRL), gold has as a minimum decline of -25% from the closing price of Friday March 1, 2013 to the conservative downside target of $1,179.25. From our experience with Gould’s SRL, the minimum downside target is often achieved, especially when the price experiences an almost parabolic price move to the upside.
The extreme downside target of $681.75, which seems outlandish from the current level. Therefore, we’ll split the difference with an initial extreme downside target of $930.50 until proven otherwise. Already, the $1,179.25 level seems extreme in our minds.”
On December 6, 2013, the update to our downside targets for gold is depicted in the chart below:
Gold Stock Indicator: November 29, 2013
During the last week gold and the Philadelphia Gold and Silver Stock Index (XAU) were relatively unchanged. Below is the Gold Stock Indicator from March 2012 to the present.
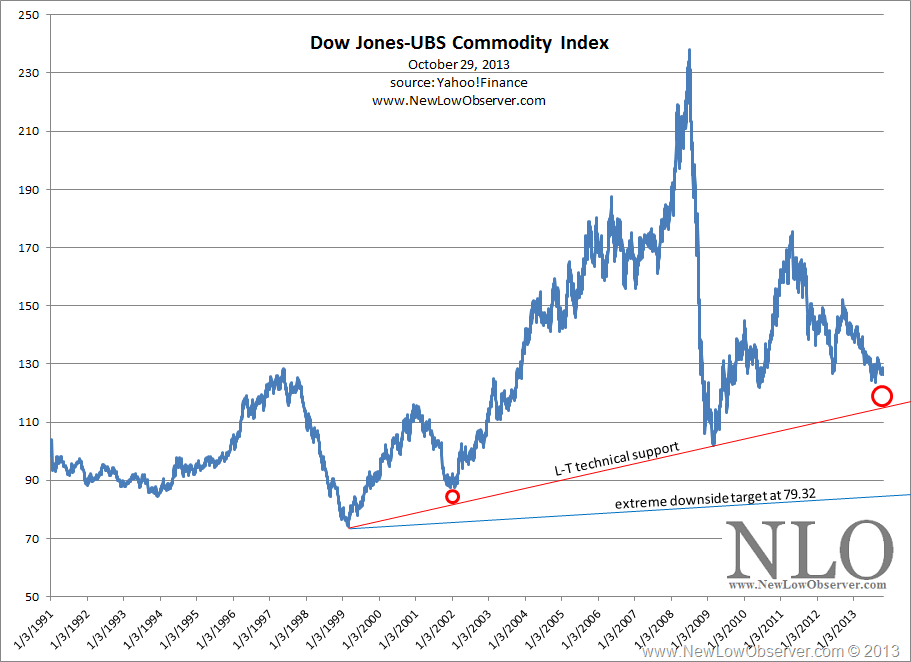
Has the Dow Jones-UBS Commodity Index Reached the Low?
We’ve noticed an interesting pattern which may suggest that the Dow Jones-UBS Commodity Index is nearing the low. In the chart below, we show (at the red circles) the exact same percentage difference between the long-term technical support (red line) and the 2002 and 2013 low. That percentage difference, approximately 7% in both cases, is all that stands between the two low points and the support level. Our primary question is, will the most recent low sustain a double bottom as was the case in the 2001-2002 period?
Already we have indicated the extreme downside target for the commodity index at 79.32, based on the work of Edson Gould’s Speed Resistance Lines. However, if we are in a commodity bull market, as we’ve made reference to in our January 1, 2009 article titled (found here), then there is a good chance that a bounce at the long-term technical support line would mark the end of the cyclical bear move in commodities.
Comments Off on Has the Dow Jones-UBS Commodity Index Reached the Low?
Posted in Dow Jones-UBS, ExxonMobil, gold, gold bugs, Sysco, SYY, XOM
Gold Stock Indicator: October 9, 2013
Although gold and gold stocks declined, the Gold Stock Indicator (GSI) increased above the level from yesterday. we’re currently sitting slightly above the “stage 4 buy” level which is based on the 2008 low.
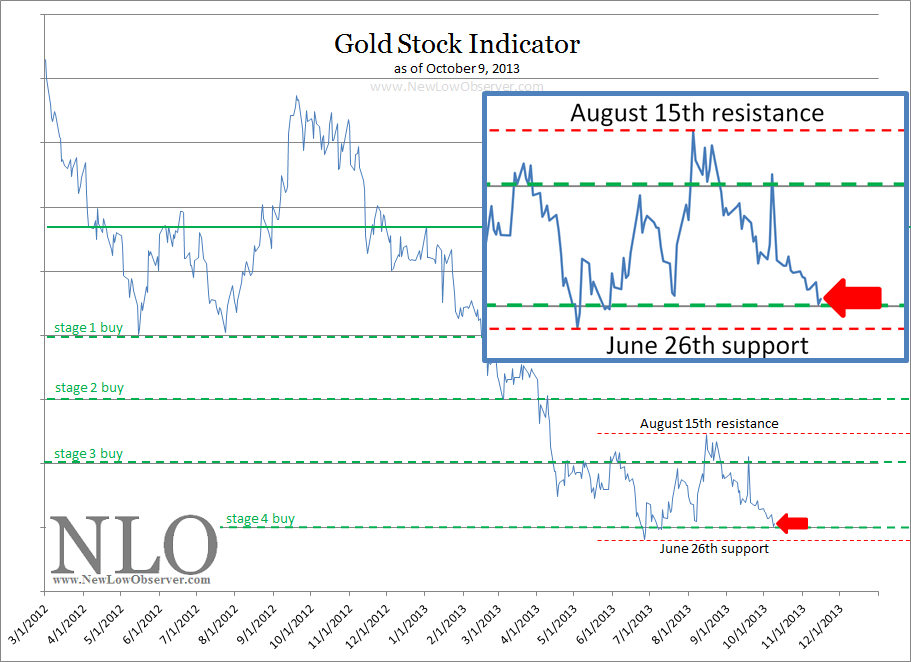
Our use of the 2008 low as a reference point is based on Charles H. Dow’s assessment of the best time to consider an investment:
“The point of importance for those who deal in industrial stocks is whether the capitalization of the companies into which they propose to buy is moderate or excessive, when compared with the aggregate earnings of the various concerns forming the combination in a period of depression. It is probable that consolidated companies will be able to earn as much in the next period of low prices as the companies forming the combine were able to earn in the last one; hence the very foundation of investments in industrials should be knowledge of what these companies earned, say in 1893 to 1896, making, perhaps, reasonable allowances for economies under consolidation. Where the earnings so shown would have provided dividends for industrials now active, the fact must be regarded as a very strong point in favor of those stocks.[1]”
The consideration of investments “in periods of depression,” “periods of low prices,” and “economies under consolidation” with the reference to 1893 and 1896 are all consistent with extremes in the investment cycle. This definitely is the case for gold and more especially gold stocks. Dow is telling us that investment considerations need to look back to the prior extreme lows for the best approximation for where investments will likely go to the downside in the current cycle and when those investments could be considered the best values. Naturally, in the next decline from a gold stock peak, we will need to use the 2013 low as the worst case scenario of downside risk.
The following are the dates and levels of gold and gold stocks (XAU) that were at or lower than the current level in the GSI.
| Date | Gold | XAU |
| 10/27/2008 | $730.50 | 65.72 |
| 6/24/2013 | $1,286.75 | 87.33 |
| 6/25/2013 | $1,279.00 | 87.22 |
| 6/26/2013 | $1,236.25 | 82.35 |
| 6/27/2013 | $1,232.75 | 84.35 |
| 7/8/2013 | $1,235.25 | 84.98 |
| 7/9/2013 | $1,255.50 | 85.99 |
| 7/10/2013 | $1,256.00 | 85.71 |
| 10/8/2013 | $1,329.50 | 88.94 |
| 10/9/2013 | $1,304.00 | 88.79 |
June 26, 2013 was the lowest point ever reached in the GSI since 1983. While we’re not there yet, we expect that gold and gold stocks should bring us to the former low with some margin for error on the downside.
Citation:
-
Dow, Charles. H. Review and Outlook. Wall Street Journal. April 27, 1899.
Comments Off on Gold Stock Indicator: October 9, 2013
Posted in Charles Dow, Charles H. Dow, gold, gold bugs, Gold Stock Indicator