Gold and gold stock continue to trade in a narrow range. This past week, gold increased just over +1% while gold stocks gained +0.82%.
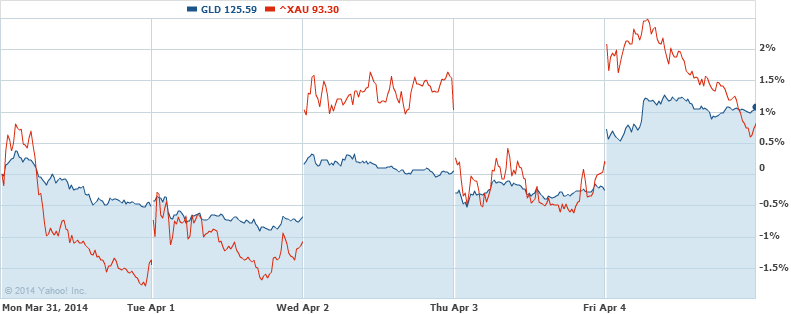

Gold and gold stock continue to trade in a narrow range. This past week, gold increased just over +1% while gold stocks gained +0.82%.
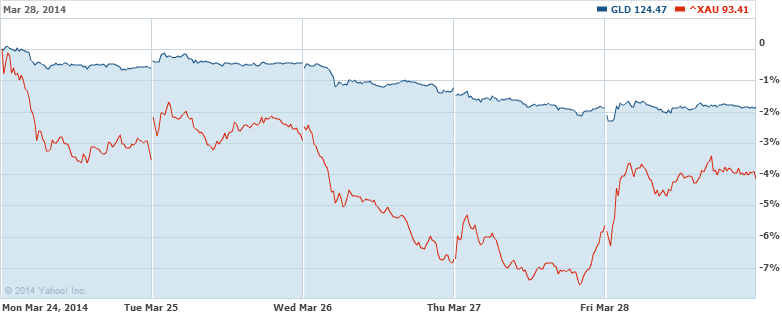
This is the second week in a row of declining gold and gold stocks. The past week saw gold decline –1.86% while gold stocks fell –4.11%.
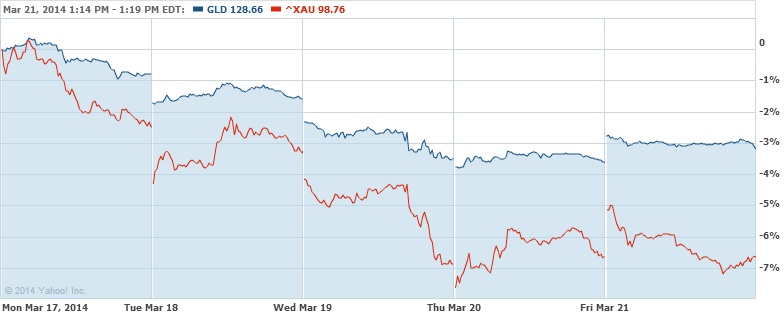
The gold and gold stock market appears to be deflating to more “respectable” levels. Gold as represented by the ETF GLD declined –3.20% while the Philadelphia Gold and Silver Stock Index (XAU) declined –6.65%.
The expected decline has finally arrived. Hopefully, the Gold Stock indicator can declined all the way to the June 2013 low. At which point there should be additional accumulation of gold stocks. Gold stocks are already at what we consider to be significant values compared to the historical “norm” and relative to the general equity market. Any additional declines to prior lows is welcomed.
A reader asks:
“(Barrick Gold Corp) ABX has seen considerable gains since the time of your last two purchases. Have you considered taking profits at this time?”
Our response:
A brutal week for gold investors as the metal represented by the gold EFT has gained nearly +3% while the gold stock index (XAU) has gained nearly +5.50%. These aren’t normal moves to the upside and we try to take these advances in stride.
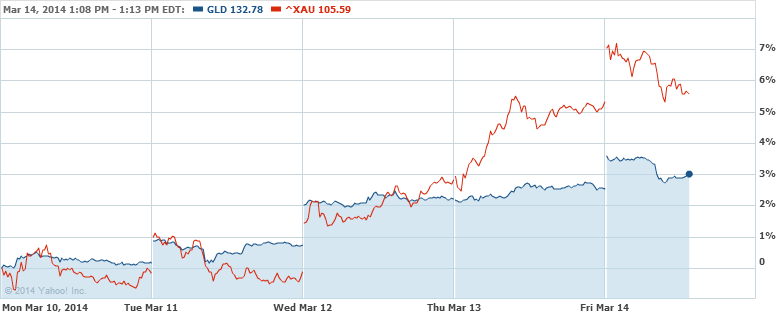
The Gold Stock Indicator has prepared us well in advance of the current move as indicated in the chart below.
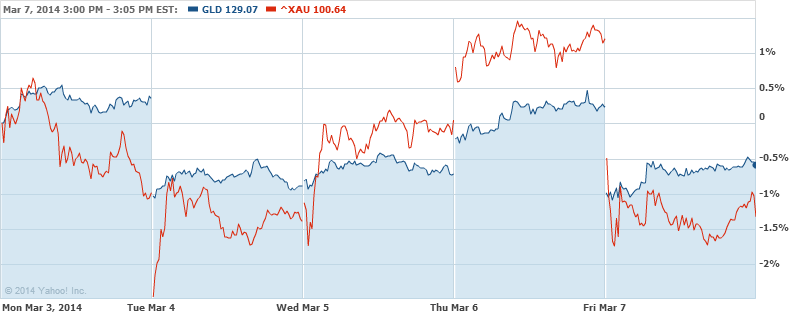
This past week, gold as represented by the SPDR Gold Shares ETF (GLD) declined –0.59%. Gold stocks as represented by the Philadelphia Gold and Silver Stock index (XAU) declined by –1.38%. Both GLD and the XAU are plotted below:
There is an interesting development in the Gold Stock Indicator (GSI) as applied to Barron’s Gold Mining Index (BGMI). As seen in the charts below, the Barron’s Gold Mining Index is on the leading edge of what might be a new trend.
In the past week, gold increased marginally while the Philadelphia Gold and Silver Stock Index (XAU) declined –3.23%. Our Gold Stock Indicator had the following performance:
Gold (as represented by GLD) is on a relative tear of late. In the last week, gold has increased +3.41%. On the other side of the gold play, gold stocks (as represented by the Philadelphia Gold and Silver Stock Index [XAU]) gained +9.10%.
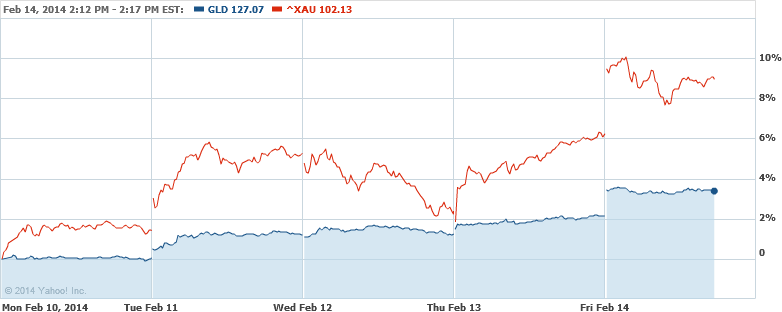
Gold (as represented by GLD) and the Gold & Silver Stock Index (XAU) finished the last week on a high note with gains of +1.45% and +1%, respectively. Although, it could be said that gold stocks took investors for a ride in order to achieve the +1% gain. The XAU Index declined as much as –2.5% before regaining all of the lost ground of Tuesday and Thursday of this week.
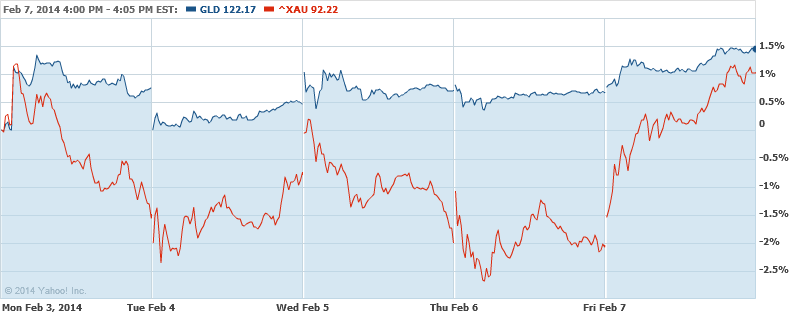
This week, gold declined –1.31% and the Philadelphia Gold and Silver Stock Index (XAU) declined –1.48%. Below is the Gold Stock Indicator:
Gold increased +2% in the last week while the Philadelphia Gold and Silver Stock Index declined –1%. Below is the level of the Gold Stock Indicator:
In the last five trading days, the Philadelphia Gold & Silver Stock Index has increased +6.47% while the price of gold has increased by +0.28%. Our Gold Stock Indicator is charted below:
Gold and gold stocks, based on the Philadelphia Gold & Silver Index, was unchanged for the week.
This week, gold increased +1.70% while gold stocks, as represented by the Philadelphia Gold and Silver Index (XAU), increased +3.61%. Our Gold Stock Indicator (GSI), is indicated in the chart below:
This week, gold increased +1.54% while gold stocks, as represented by the Philadelphia Gold and Silver Index (XAU), increased +4.56%. Our Gold Stock Indicator (GSI), is indicated in the chart below: