Category Archives: gold

Gold Stock Indicator

Continue reading

Gold Stock Indicator

Continue reading

Gold Stock Indicator

Continue reading

Gold Stock Indicator

Continue reading

Gold Stock Indicator

As goes the market, so goes gold and gold stocks.  We got the opportunity to see this action in spades today.

Continue reading

Gold Stock Indicator

Continue reading

Gold Stock Indicator

Continue reading

Gold Stock Indicator

Continue reading

Gold Stock Indicator

Continue reading

Review: XAU Speed Resistance Lines

In our very first attempt at understanding Edson Gould’s Speed Resistance Lines, when the Philadelphia Gold and Silver Stock Index (XAU) was within 6 trading days of the top (found here), we said the following: Continue reading

Gold Price: Affected by Gold ETF Outflows?

Subscriber F.H. brings our attention to a comment made by a gold fund manager.  The manager suggested that the reason for gold’s weakness is primarily due to the liquidation occurring in gold ETFs.  This implies that if there weren’t gold ETFs, then the price of gold would not decline as much as it already has (possibly not at all).  However, our work on this topic is to check the data and show how easily this can be proven an incorrect analysis.

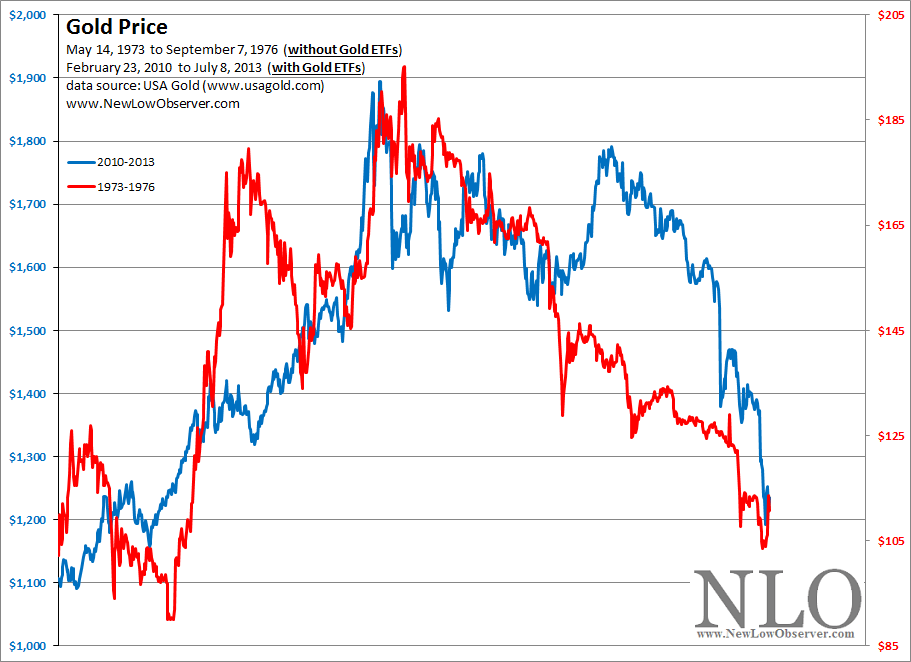
The chart below quickly demonstrates that gold outflows from ETFs is a symptom and not the cause in the decline of gold.

image

What did we do to arrive at the outcome above?  First, we already knew that the price of gold declined -50% from the 1974 peak to the 1976 trough.  This simple fact, within what is widely accepted as the last secular bull market for gold (1971-1980), acted as our starting point.  In our myopic view, when comparing data, you must compare like to like, bull market to bull market and bear market to bear market.  Therefore, selecting a set of data from the secular bear market in gold from 1980 to 1999 would result in flawed analysis.

Second, we took the period when gold went from $100 to its respective peak in 1974 and trough in 1976 then compared that period (in trading days; 833 days) to the current period going backwards 833 trading days.

Finally, we noted the fact that each period was with and without gold ETFs.

  • Please note that when we analyze any data, we only seek the “big picture” view, something akin to the horseshoes and hand grenades analogy.

What is our interpretation based on this rudimentary and potentially flawed approach?

First, gold ETF outflows are not the reason why gold is declining.  Instead, gold ETF outflows are a mirror of the price of gold, albeit a somewhat distorted mirror.

Second, the decline in the price of gold has been normal within what we believe to be a secular bull market in gold.  So far, gold has declined “only” –35% from the 2011 peak.  This is contrasted with the aforementioned decline of –50% from the 1974 peak to the 1976 trough.  What would change our view that we are no longer in a secular bull market in gold?  Our highly biased view is that a bear market begins when gold and silver declines below our 1996 purchase price of the respective metals.  However, the real world analysis says that a secular bear market is confirmed when gold attempts to go above the $1,895 price but fails.  Lacking a qualified retest of the prior high, we will infer that we’re still within a secular bull market for precious metals.

Third, our view is that when a gold fund manager speaks they have only one message, gold related investments are always good and never bad.  This opinion is the same for technology, biotechnology, small cap, large cap and international fund managers.  There will never be a day when a fund manager says, “My fund is [I’m] not needed for the next several months or years.”

Our final interpretation is that when a gold fund manager uses the explanation that the outflow of funds from gold ETFs is the predominate reason for the price decline in gold, it demonstrates a significant lapse of analysis.

Transaction Alert

Continue reading

Does the Budget Surplus Affect the Price of Gold?

Subscriber R.G. asks:

“Will the precious metal sector be affected in anyway by the CBO budget surplus? http://www.marketwatch.com/story/cbo-sees-115-billion-june-budget-surplus-2013-07-09

Our response:

As far as we can tell, a government budget surplus or deficit does not materially correspond to an increase or decrease in the price of gold.  Take a look at the chart below:

image

Taking artistic license on the matter, over the past 36 years, we’ve seen equally as many periods of correlation as divergence in the budget deficit/surplus and gold on a short-term basis.  In addition, although the deficit has dramatically increased since 1980, the price of gold has fallen and increased equally as much on a long-term basis.

Our only conclusion is that there is no substantive value in seeing a relationship between the U.S. budget and the price of gold.

Citations:

Precious Metal Juniors or Majors?

Reader T.H. asks:

“What is your position on miner shares since the absolute destruction of share prices across the board? does it make a difference to differentiate between juniors and large miners? this sector could be setting up with spectacular gains if timed right.”

Our Response:

There are two types of gold stocks right now, investments and speculations.  The investment category are those gold stocks that are members of the XAU or HUI index.  Constituents of Market Vectors Junior Gold Miners ETF (GDXJ) are the gold stocks that are speculations.

Because many of the gold stocks that are part of the GDXJ will die on the vine, the best opportunity for taking advantage of the juniors is with GDXJ.  However, keep in mind that GDXJ is a "product" and not an asset.  Theoretically, assets can be held for the long-term while products must have a "sell by" date or price.

Below we have listed the gold and silver stocks that are ranked by payout ratio:

Symbol Name Price P/E EPS Yield P/B % from yr low payout ratio
ABX Barrick Gold Corporation 14.11 - -0.86 5.8 0.61 5.13% -93.02%
KGC Kinross Gold Corporation 4.61 - -2.16 3.4 0.53 1.99% -7.41%
GOLD Randgold Resources Limited 62.69 14.1 4.44 0.8 2.09 0.66% 10.81%
GFI Gold Fields Ltd. 4.94 5.03 0.98 2.9 0.7 5.57% 14.29%
HL Hecla Mining Co. 2.78 61.48 0.04 0.4 0.69 4.40% 25.00%
BVN Compa 14.12 6.19 2.28 3.9 0.98 5.38% 25.44%
AU AngloGold Ashanti Ltd. 12.79 17.3 0.74 1.7 0.88 2.28% 28.38%
SLW Silver Wheaton Corp. 19.34 11.99 1.61 2.5 2.08 8.73% 29.81%
HMY Harmony Gold Mining 3.475 10.63 0.33 2.7 0.36 5.32% 30.30%
GG Goldcorp Inc. 24.31 13.74 1.77 2.5 0.84 9.45% 33.90%
FCX Freeport-McMoRan Copper & Gold 27.6 8.96 3.07 4.6 1.45 4.27% 40.72%
NEM Newmont Mining Corporation 27.12 8.27 3.29 5 0.97 2.26% 42.55%
AUY Yamana Gold, Inc. 9.19 18.4 0.5 2.8 0.87 7.37% 52.00%
AEM Agnico Eagle Mines Limited 27.8 18.6 1.49 3.3 1.37 0.22% 59.06%
RGLD Royal Gold, Inc. 42.04 32.76 1.28 1.9 1.12 8.28% 62.50%
GORO Gold Resource Corp 8.75 17.82 0.49 4.3 5.04 10.23% 73.47%
AUQ AuRico Gold Inc. 4.54 27.67 0.16 3.6 0.55 12.47% 100.00%
PAAS Pan American Silver Corp. 11.56 40.35 0.29 4.4 0.62 2.21% 172.41%

The precious metal stocks are arranged by the payout ratio, which in our opinion is the best measure of sustainability of the dividend.  Dividend payout ratios of 50% and less are the most likely to be maintained.  However, the trials that lay ahead in the precious metal sector may require more cuts in the dividend.

Two notes of caution are required.  First, we’re not yield chasers and advise that gold stocks are not purchased based on dividend yield.  Second, Barrick Gold (ABX) and Kinross Gold (KGC) are wild card speculations, with payout ratios in the minus column due to negative annual earnings.  Investment in these companies are highly volatile plays that will pay off big.  However, the challenge will be sitting through the gut wrenching declines that may be ahead.

Gold Stock Indicator

The Gold Stock Indicator (GSI) is on course to retest the June 26, 2013 low.

image

Our theory on the GSI at the current level suggests that a steady purchase of gold stocks at or below current prices.

image