Category Archives: gold

Gold: 50% Principle

From a Dow Theory perspective, downside targets rely heavily on the concept of the 50% principle. Although mistakenly attributed to E. George Schaefer by Richard Russell, the 50% principle is derived from Charles H. Dow’s “great law of action and reaction.” Dow describes the “law” in the following manner:

The market is always responsive to the great law of action and reaction. The longer the swing one way the longer it will be the other. One of the best general rules in speculation is the theory that reaction in an advance or a decline will be at least one-half of the primary movement [50% principle].

The fact that the law is working through short ranges and long ones at the same time makes it impossible to tell with certainty what any particular swing may do; but for practical purposes, it is not infrequently wise to believe that when a stock has risen 10 points, and as a result of one or two short swings [double tops] does not go above the high point, but rather recedes from it, that it will gradually work off 4 or 5 points.[1]”

In another excerpt from Dow’s work, on the topic of the 50% principle, Dow says:

It often happens that the secondary movement in a market amounts to 3/8 to ½ of the primary movement.[2]”

Again, Dow emphasis the concept of the 50% principle:

Whoever will study our averages, as given in the Journal for years past, will see how uniformly periods of advance have been followed by periods of decline, amounting in a large proportion of cases to from one-third to one-half of the rise. [3]”

Finally, George Bishop, one of the greatest authors on the topic of Charles H. Dow, concludes:

The law of action and reaction applies to both the general market and to individual stocks. This law states that the reaction to an advance or decline will approximate half the original movement.[4]”

Dow Theory 50% Principle for Gold

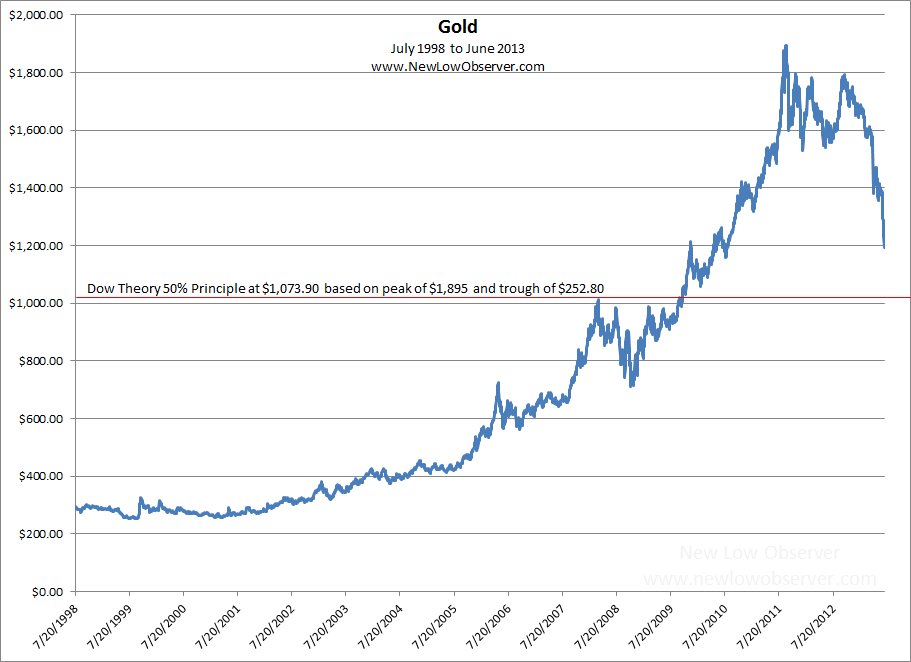
Dow Theory downside targets for the price of gold, based on the peak of $1,895 and the initial  low of $252.80 based on the closing price, is charted below (July 20, 1999 and September 5, 2011, respectively):

image


Citations:

  • [1] Dow, Charles H. Wall Street Journal. October 19, 1900.
  • [1] Bishop, George. Charles H. Dow and the Dow Theory. Appleton-Century-Crofts. New York. 1960. page 119.
  • [1] Sether, Laura. Dow Theory Unplugged. W&A Publishing. 2009. page 112.
  • [2] Dow, Charles H. Wall Street Journal. January 22, 1901.
  • [2] Bishop, George. Charles H. Dow and the Dow Theory. Appleton-Century-Crofts. New York. 1960. page 120.
  • [2] Sether, Laura. Dow Theory Unplugged. W&A Publishing. 2009. page 117.
  • [3] Dow, Charles H. Wall Street Journal. January 30, 1901
  • [3] Bishop, George. Charles H. Dow and the Dow Theory. Appleton-Century-Crofts. New York. 1960. page 120.
  • [3] Sether, Laura. Dow Theory Unplugged. W&A Publishing. 2009. page 199.
  • [4] Bishop, George. Charles H. Dow and the Dow Theory. Appleton-Century-Crofts. New York. 1960. page 231.

Emerging Markets and Gold

Drawing from the work of Bhartia and Seto in the article titled "Present and Emerging Risks to the Gold Trade" (found here) and "Emerging Consumers Drive Gold Prices: Who Knew?" (found here) it is claimed that the driver for the price of gold since 2000 has been the emerging economies. 

From our perspective, we have struggled to jump on board the explanation that India and China, or emerging markets, are the primary contributing influence on the rise in the price of gold.  In our experience, when the small players (in any market) are piling in on a particular trade, it is worth examining the elements that are making it possible.

What stands out the most in our review of Bhartia and Seto’s work is the following comment:

“The impact of the Asian financial crisis is instructive. As the economies in the region fell into recession, the purchasing power of consumers in Southeast Asia declined commensurately. Thailand, Indonesia, and Korea all became netsellers of gold, albeit briefly (see Exhibit 1). In line with the drop in demand and the drop in the regional stock markets, gold prices fell 25% (see Exhibit 2).”

This is an instance where it appears that correlation of a select period of time has fit the argument more than explained the reasons why the price of gold has increased.  Unfortunately, this examination overlooks or omits the performance of the same regional stock markets from 1980 to 1993, a period that reflected massive gains in the respective emerging stock markets even as the price of gold crashed or was unchanged from the peak in 1980 to 1993, and ultimately to 2000. As an example:

  • The Thai Set Stock Index increased 16 times (16x) from 1980 to the 1993 peak (found here) & (confirmed here) In the same time frame (1980-1993), gold declined -61%.
  • In the case of the KOSPI or Korean stock index, it increased 11 times (11x) from 1980 to the 1993 peak (chart here). In the same time frame (1980-1993), gold declined -61%.
  • In the case of the Indonesian stock market, it increased 6 times (6x) from 1982 to 1992/1993 (chart here).  In the same timeframe, gold was unchanged.

Our belief is that the overall rise in the stock market reflects a general increase in economic wealth of the country.  Unfortunately, Bhartia and Seto cannot demonstrate that the emerging market consumer demand to push the price of gold higher in a period when the emerging economies grew from 1980 to 1993.  Nor could they demonstrate that currency collapse and a crashing economy had enough impact to move the price of gold higher.

If Bhartia and Seto are correct that emerging markets are moving the price of gold higher today, then the ability and opportunity, due to significant economic growth, to buy gold should have increased enough to move the needle in a positive direction from 1980 to 1993.  Unfortunately, when countries normally associated with a long tradition for appreciating the value of gold and/or high savings rate experienced substantial economic wealth, the price of gold did not increase.  In fact, from 1980 to 1993, the price of gold declined substantially. Also, as the respective currencies were on the brink of collapse in 1996 and 1997, gold managed to decline -37%.

The economic law of demand suggests that as prices go higher, demand will decline.  That has not been the case in emerging economies when it comes to gold, as demonstrated by Bhartia and Seto.  Worse still, when  emerging markets are piling into a trade (any trade), it may mean that the easy money has been made, in the short term.

Rather than considering emerging markets as leaders of a movement towards better investment decisions, we should be reassessing the role of that investment and its ability to generate reasonable risk-reward outcomes.

Gold Stock Indicator

Continue reading

1925 to 1932: A Question for Precious Metal Investors

Continue reading

Gold Stock Indicator: Now is the Time

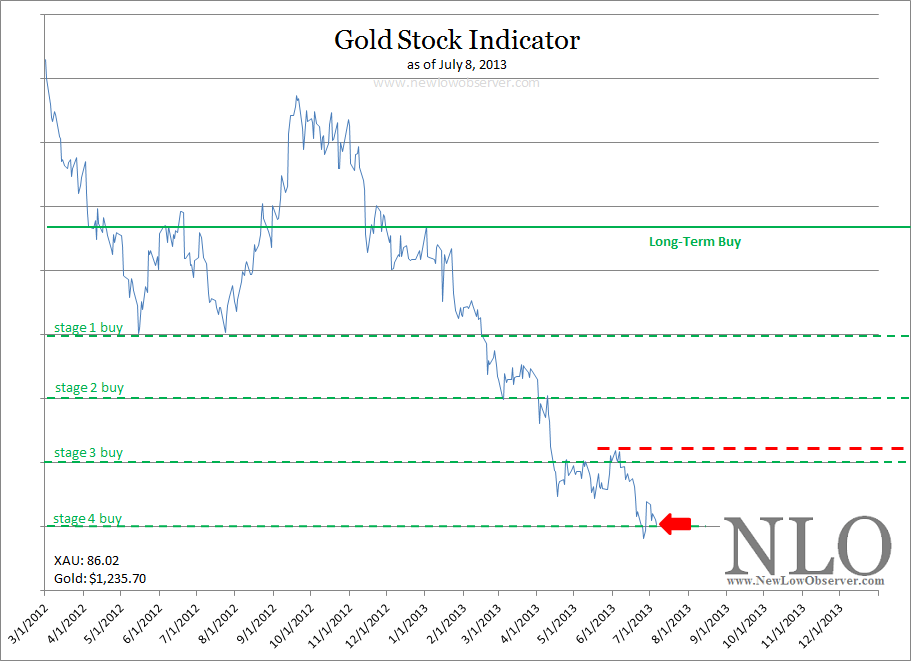
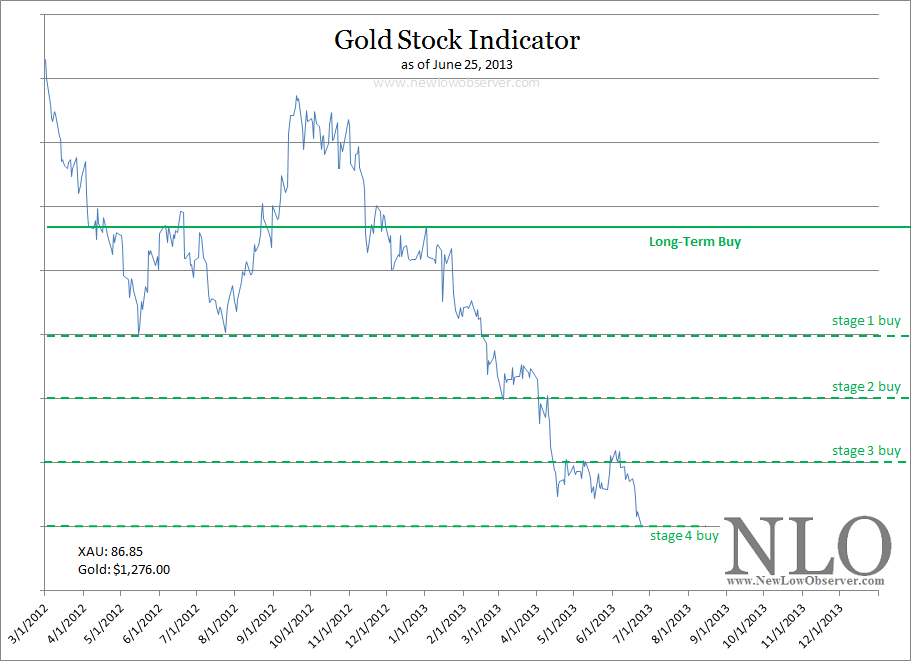
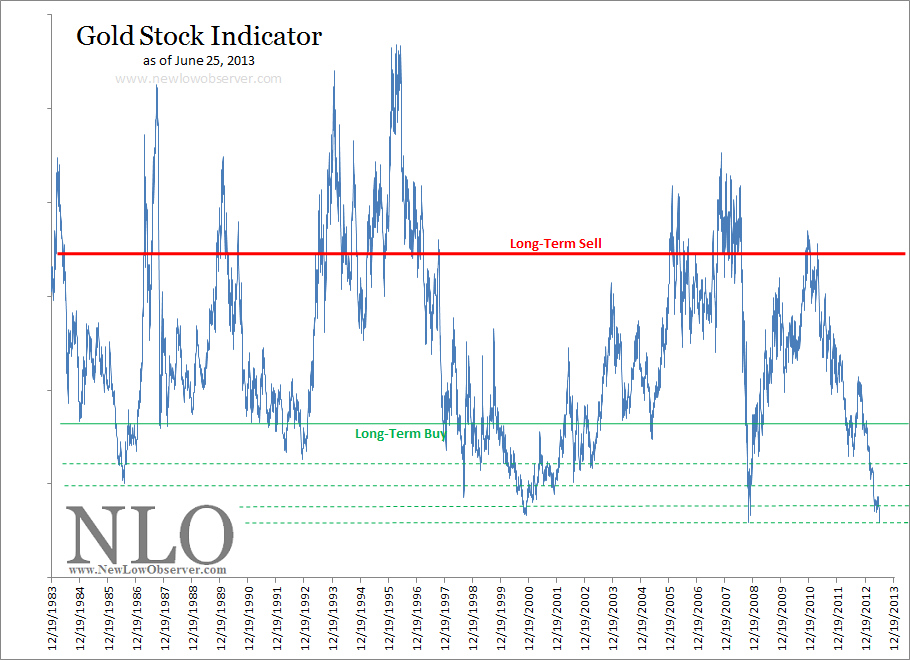
On June 24, 2013, the Gold Stock Indicator (GSI) declined below the 2008 low for a brief moment.  Today, June 25, 2013, the GSI is at the 2008 low.

image

Any activity in the gold stock arena below the “stage 4 buy” level is uncharted waters for us.  We will continue to post transaction alerts based on our partnership account.  However, successfully navigating to this point without over-committing our resources was the ultimate goal of this exercise.  We hope this effort has been practical and saved our readers money they would have otherwise lost at much higher levels in gold stocks.

image

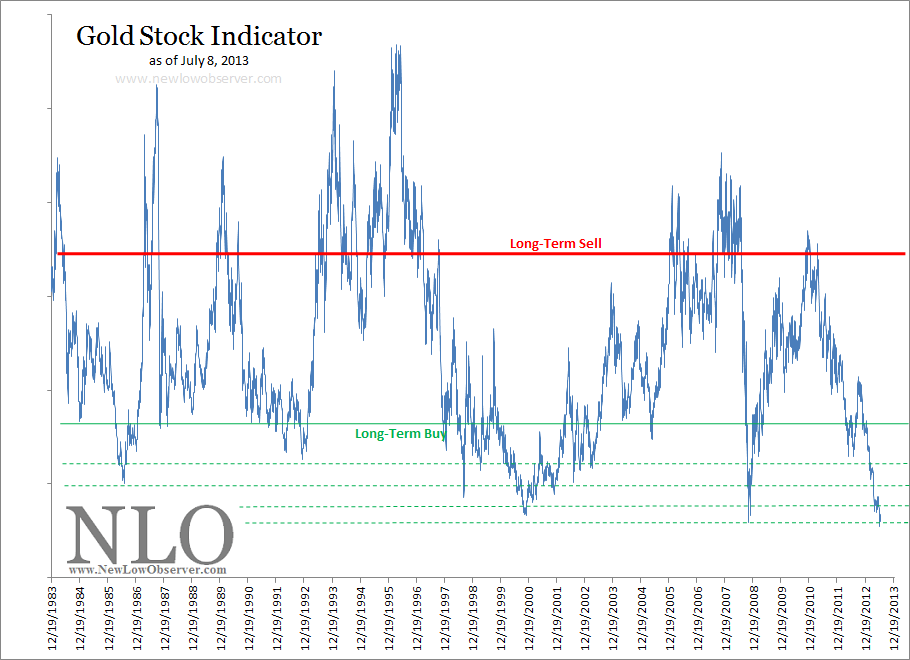
We would not be surprised to see a considerable sell-off in gold stocks in the near-term.  However, based on the GSI since 1983, now is a reasonable time to line up gold and silver stocks that are part of the Philadelphia Gold and Silver Index (found here) or the Amex Gold Bugs Index (found here) for investment opportunities.

Nasdaq 100 Watch List: June 21, 2013

Below are the Nasdaq 100 companies that are within 10% of their respective 52-week lows. Stocks that appear on our watch lists are not recommendations to buy. Instead, they are the starting point for doing your research and determining the best company to buy. Ideally, a stock that is purchased from this list is done after a considerable decline in the price and rigorous due diligence.

Continue reading

Gold Stock Indicator

Continue reading

Gold Stocks Near New Low

This is the list of gold related equities that we track within 10% of the one year low.  We strongly recommend that you do your own research on these companies and assume that the downside risk is half of the current price, at minimum.

Continue reading

Gold Stock Indicator

Continue reading

Gold Stock Indicator: Battle Lines Have Been Drawn

Continue reading

Gold Stock Indicator

Continue reading

Gold Stock Indicator

Continue reading

Gold Stock Indicator

Today the Gold Stock Indicator increased over +12% as the Philadelphia Gold and Silver Index increased +5.71% while the actual price of gold declined -1.02%.  Keep in mind that, in the past, we’ve demonstrated that the price of gold stocks going counter to the price of gold (on the upside) can be a warning of more downside risk.

Continue reading

Gold Stock Indicator

Early indications are that the Gold Stock Indicator is at the same level as the “panic 2 level.”  Only a little more to go before the we’re below the “stage 4 buy” level. Continue reading

Gold Stock Indicator

Continue reading