Category Archives: Edson Gould

Dow Altimeter Review

On May 20, 2014, we said the following about the Dow Jones Industrial Average Altimeter based on the work of Edson Gould:

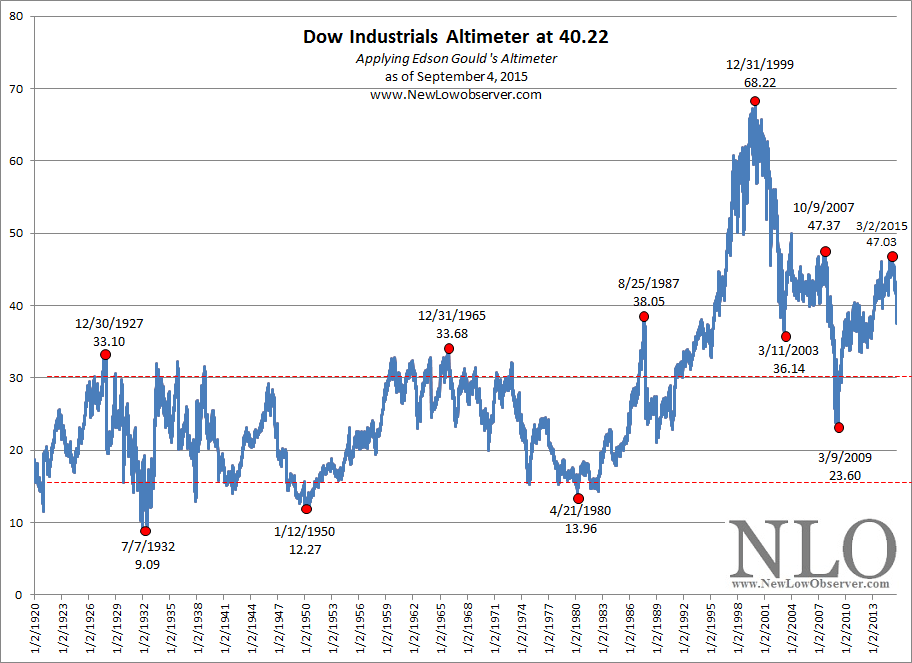
“Currently, the Altimeter is closing in on the 2007 peak of 47.37.  If the Dow were to attain the 47.37 level in the Altimeter, the index would sit at 17,062.67.  There is no rule that says the Dow Industrials must stop at the prior turning point.  However, our cautious nature instinctively pushes us to wonders if the run from the 2009 low is about to come to an end.”

Since that time, the Altimeter for the Dow peaked at 47.03 on March 2, 2015, just short of the 2007 level of 47.37, and has declined below the 32.05 support level.  From a performance standpoint, the Dow Industrials has fallen -11.95% since March 2, 2015.

image

Naturally we can’t say that we predicted any of the changes in the market since May 2014.  However, our primary goal is to observe indicators that most accurately guides our thinking about possible scenarios for the stock market.  In this case, we believe that the best way to assess the possible scenarios is by applying Dow Theory to Gould’s Altimeter, as seen below.

Oil and Gas Stock Index Update

On January 6, 2015, we said the following about the NYSE Oil and Gas Stock Index (XOI):

“The conservative downside target of 1,454.79 has been constructed while the mid-point of 1,015.10 is also indicated.  However, we did not include the extreme downside target of 575.41.  We did indicate in red the 812.08 level which was the extent of the decline in the period from the 2008 high to the 2009 low.

“Suffice to say that we expect the XOI index could easily fall to 1,015.10 and subsequently to the 812.08.  Those interested in the oil sector should start initiating positions at or below the ascending 1,015.10 level. ”

At the time, the NYSE Oil and Gas Stock Index was trading at 1,287.66.  The September 4, 2015, XOI close was 1,085.81, down –15.67%.  At least from the perspective of the last posting, the SRL achieved the expected downside target.

image

However, lurking in the background is the extreme downside target of 575.41.  Since our experience has been that the extreme downside target is commonly achieved, we hazard to guess what would happen globally to the oil market in order to decline to such a low point.

For now, we’ll resign ourselves to the idea that the 812.08 is the next downside target.  If that target is achieved we believe that the 575.41 level is highly achievable.  Given our concern for the downside risk, oil sector stocks should be bought in three stages at 958, 812 & 575.

Baidu: Downside Targets

On April 27, 2013, we wrote a short piece on Baidu (BIDU) that concluded with the following remark:

“The conservative downside target of $93.43 has been achieved and we are now sitting at the extreme downside target of $54.79. All indications, based on the SRL, are that Baidu is worth considering in a two stage purchase plan, once at the current level and again at $67 or lower.”

The chart that we included for the above assessment was based on the work of Edson Gould’s Speed Resistance Lines (SRL) and is shown below.

image

Since that recommendation to buy at $85, Baidu had increased to as high as $251.  What was not included at the time was the upside targets based on the work of Edson Gould.  At that time, the upside targets were:

  • $140.16 (conservative target)
  • $210.23 (mid target)
  • $280.31 (extreme target)

Baidu was able to achieve two of the three upside targets that were indicated for the stock based on the interpretation of Gould’s work.  With the Chinese stock market experiencing significant turmoil, Baidu has declined from the $251 level to the current price of $144 making a review of the technicals useful.

Baidu Downside Targets

Below is the updated Speed Resistance Lines based on the work of Edson Gould:

Continue reading

Commodity Index Review: Upside Targets

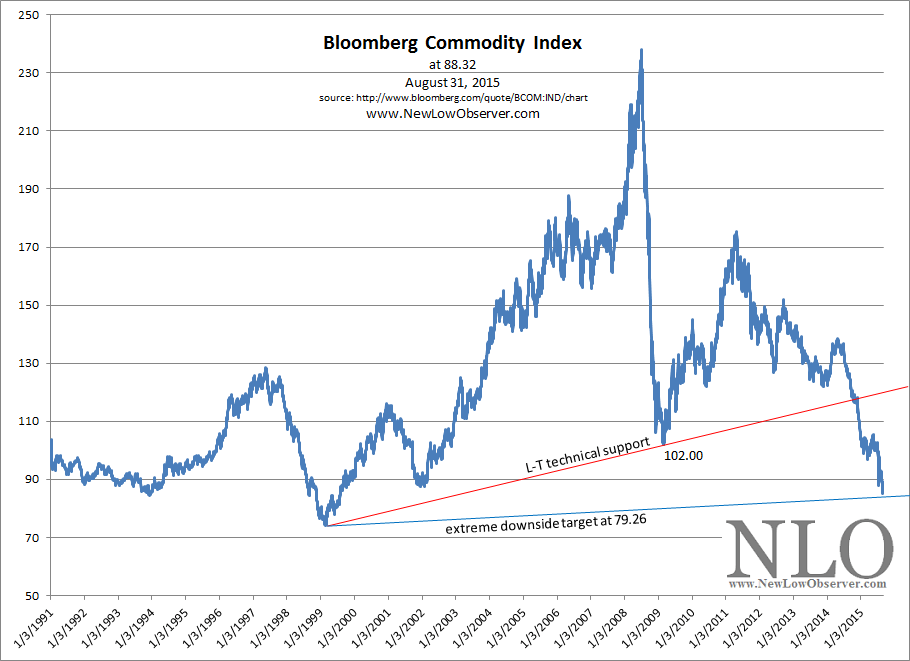
The Bloomberg Commodity Index has finally reached the extreme downside target of 79.26.  Initially, we didn’t think that the index would fall to the extreme downside target as indicated in our October 29, 2013 posting.  However, after declining below the long-term technical support level, we had to acknowledge what is now obvious.

image

Continue reading

Shanghai Composite Index: Upside Target

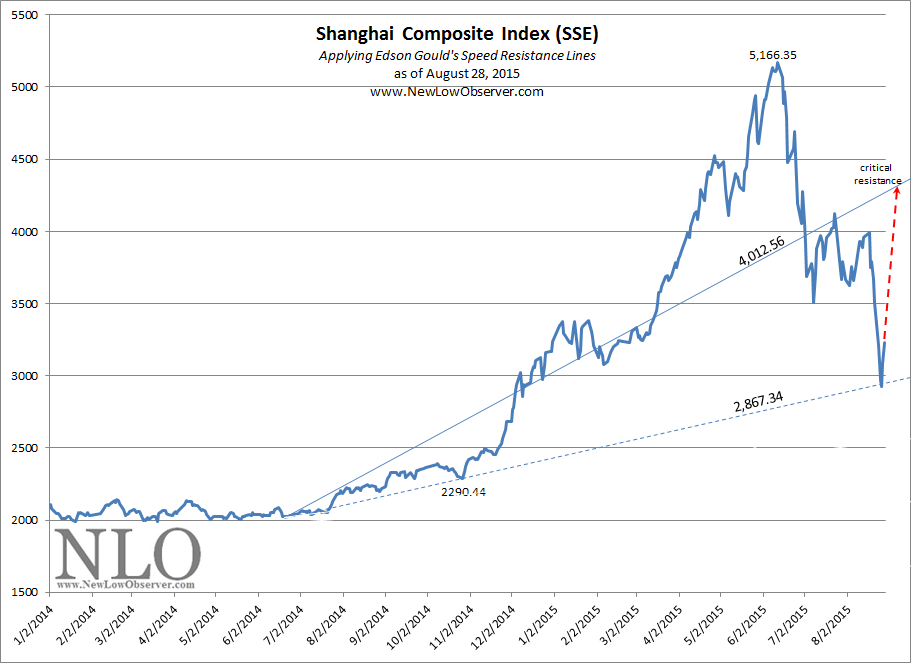
On August 26, 2015, the Shanghai Composite Index traded as low as 2,850.71.  While the most recent rise may only be a bear market rally, we think that resistance to the rise might kick in around the 4,400 level.  Rising above 4,4oo would suggest that a run to the previous peak of 5,166.35 is not out of the question.  Keep in mind that a bull market in this index is not confirmed until the index exceeds the prior high, until that time the Shanghai Composite is in a bear market rally.

image

Shanghai Composite Index: Where To Now?

On August 23, 2015, we said the following:

“The next move in the price to the downside should confirm the downside move or indicate the ongoing battle between buyers and sellers.  The point indicated as the critical support will reveal the overall short-term direction of the index.  Although the move up or down is academic, it is the size of the move that will be most fascinating as we believe it will be massive.”

So far, the Shanghai Composite Index (SSE) has confirmed that the direction of the index is down, now it is only a matter of magnitude.  Already the Shanghai Composite Index has reached the mid-range downside target of 2,867.34.

image

A large bounce at this level is hoped for as a continuation of the declining trend could spark a genuine panic.  If an upside bounce were to occur at this level, the SSE would face resistance at the ascending conservative downside target of 4,012.56.   It would be a +48% rise to the 4,400 ascending conservative downside target from the close of August 25, 2015. 

The flip side of a reversal to the upside is a decline to the extreme downside target of 1,722.12.  Our breakdown of the potential reversal points are as follows:

  • 2,450
  • 2,100
  • 1,722

The actions of the Chinese government have not been constructive for a change in the declining trend of the market.  The sooner restrictions intended to stop prices from falling are lifted the better the chance for Chinese stocks to fully recover.  The more involved the government becomes in the stock market the more we believe that 1,722 on the SSE is likely to occur.

Shanghai Composite Index: Downside Targets

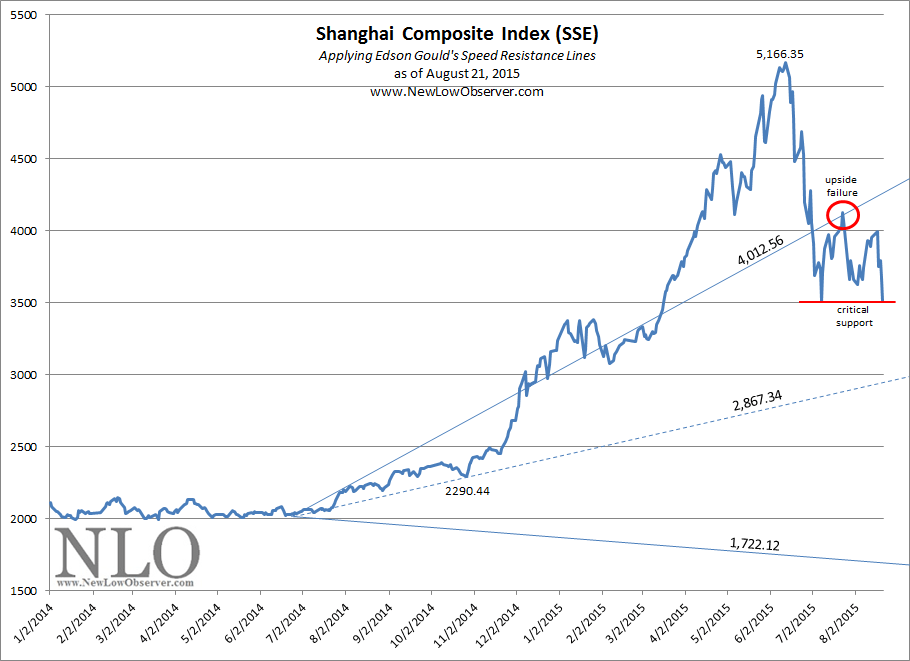
The index to watch in the coming week is the Shanghai Composite Index (SSE) as it represents the raw emotions of the stock market in China.  Below we have applied Edson Gould’s Speed Resistance Lines [SRL] to the SSE to determine the potential downside targets to watch for.

image

The SRL is ideally suited for a stock or index that has experienced a parabolic move to the upside.  When viewed from a historical perspective, the Shanghai Index meets the criteria of entering the entropy stage. 

Already the Shanghai Composite Index has declined below the conservative downside target of 4,012.56.  The July 23, 2015 upside failure coincided with the ascending conservative target.  This is the first true test of weakness in the upside move.  The next move in the price to the downside should confirm the downside move or indicate the ongoing battle between buyers and sellers.  The point indicated as the critical support will reveal the overall short-term direction of the index.  Although the move up or down is academic, it is the size of the move that will be most fascinating as we believe it will be massive.

Because the Shanghai Composite Index has a history of parabolic rises and subsequent crashes, our guess is that  declining to the 1,722.12 level should be expected.  In addition, if the SSE were to replicate the previous rise and fall in the period from 2005 to 2008, the index could drop as low as 1,447.37.

Gold Stock Indicator: August 14, 2015

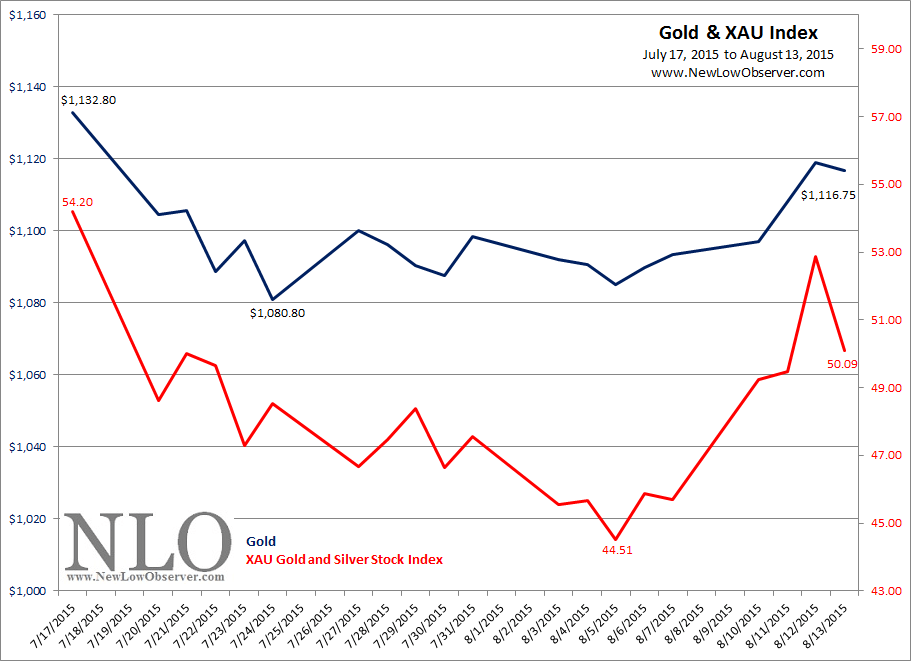
In the past month, gold and gold stocks have been on a rollercoaster ride.  Gold declined as much as –4.59% while gold stocks, as represented by the Philadelphia Gold and Silver Stock Index (XAU), declined –17.88%.

image

Although there has been a recovery of sorts, we cannot be sure that the decline is over.

Green Mountain Coffee Roasters: On Target

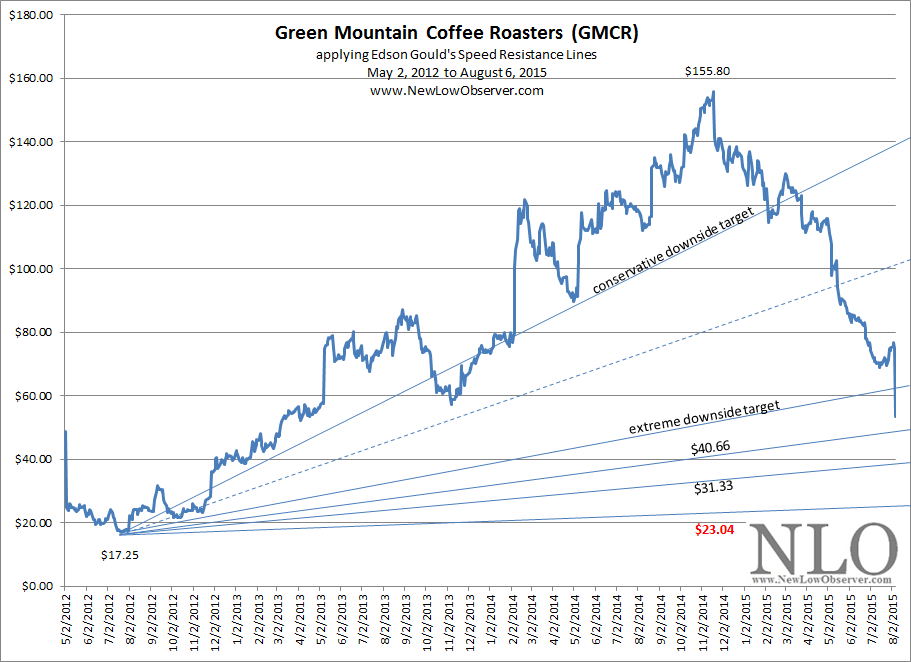
On May 19, 2015, we did a downside review of Green Mountain Coffee Roasters (GMCR) based on the work of Edson Gould.  At the time, GMCR was trading at $88.69.  Our downside assessment was as follows:

“As can be seen above, the price of GMCR has declined below the conservative and mid-range downside targets of $110.08 and $81.40.  The acceleration of the current decline seems to indicate that achieving the $52.71 extreme downside target is very likely.”

On August 6, 2015, GMCR declined as low as $52.40.  This falls well within the indications that were provided by Gould’s Speed Resistance Lines [SRL] at $52.71.  We closed our downside assessment of GMCR with the following comment:

“The fact that GMCR is prone to extreme moves up and down suggests that the extreme downside target is the point at which to start assessing risk and accumulating shares.”

Now that GMCR has fallen below the extreme downside target of $52.71, we think now is the time to review GMCR as a going concern for a potential transaction.

The Setup

Assuming that an investor is willing to accept total loss of funds, now is a great time to review the fundamentals of GMCR and determine if it will survive on its own or ultimately get acquired.  Below is the updated SRL based on the work of Edson Gould.

image

Our best guess is that buying GMCR in three stages on the way down is the most “prudent” approach.  For those interested in the stock but don’t like the prospect of catching a falling knife, we’ve outlined three potential starting points for investment at $40.66, $31.33 and $23.04.  We’d suggest investments of 50%, 25% and 25% of allotted funds.

Again, this recommendation is not for the faint of heart.  Additionally, it is safest to assume all money put to this stock are a total loss and requires a significant amount of due diligence before any commitment is made.  From a historical standpoint, a  retest of the prior low ($17.25) is not unusual.

Chesapeake Energy is on Target

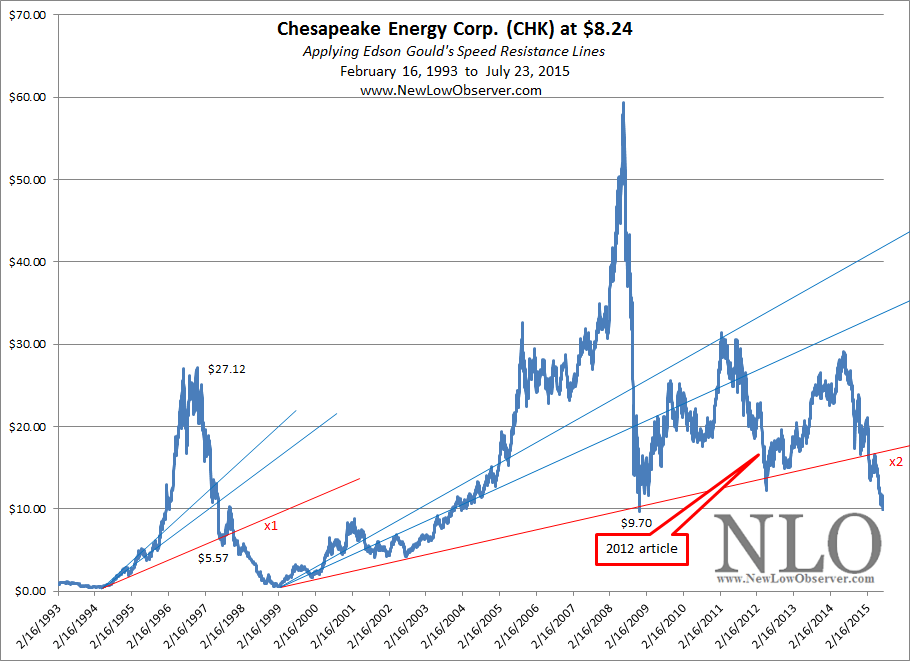
On April 26, 2012, we posted an article titled “A Warning For Chesapeake Energy Stockholders”.  In that article we said the following:

“While it appears that Chesapeake Energy  (CHK) has seen all the punishment that could possibly lay ahead, we’re concerned that the previous technical pattern in the period from 1993 to 1999 is about to repeat.”

The period from 1993 to 1999 saw (CHK) decline from as high as $27 to under $1.00.  The 2012 article was written when CHK was at $18.10 and had already fallen more than –66%.  So far, CHK is on track to replicate the decline achieved from 1993-1999.  The next downside target for Chesapeake Energy is $4.50.

image

IBM: A Value Investor’s Delight

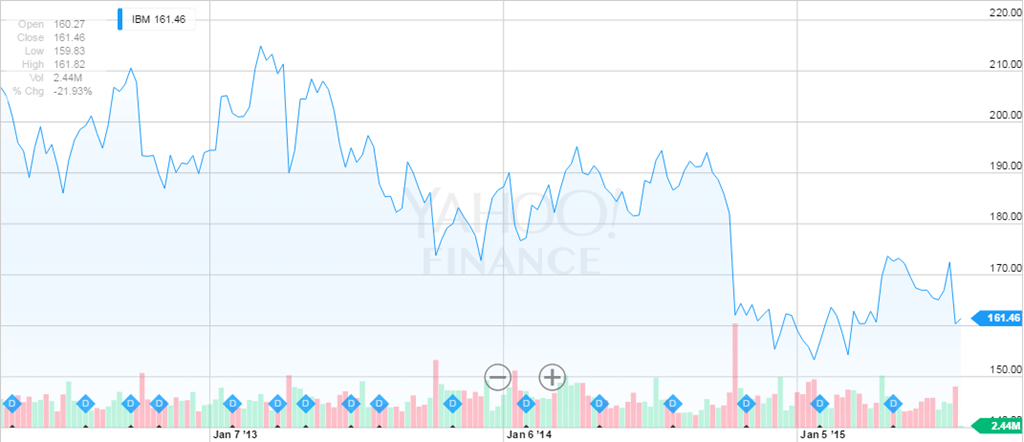
In April 2012, we published an article titled, “What Does Warren Buffett See In IBM?”  At the time we concluded the article with the following thought:

“…just imagine what IBM will look like after falling to a 52-week low.”

A reader of our article took exception to the idea of IBM declining in price with the remark:

“I have no idea why you think you could buy IBM on a 52 week low. There is nothing fundamental about the company that would lead one to think that might happen. IBM is a difficult company to short because people who own it primarily intend to hold it for a longer term, do not trade on margin, and do not sell their shares based on fear (Momintn. What Does Warren Buffett See in IBM? April 19, 2015. link.).”

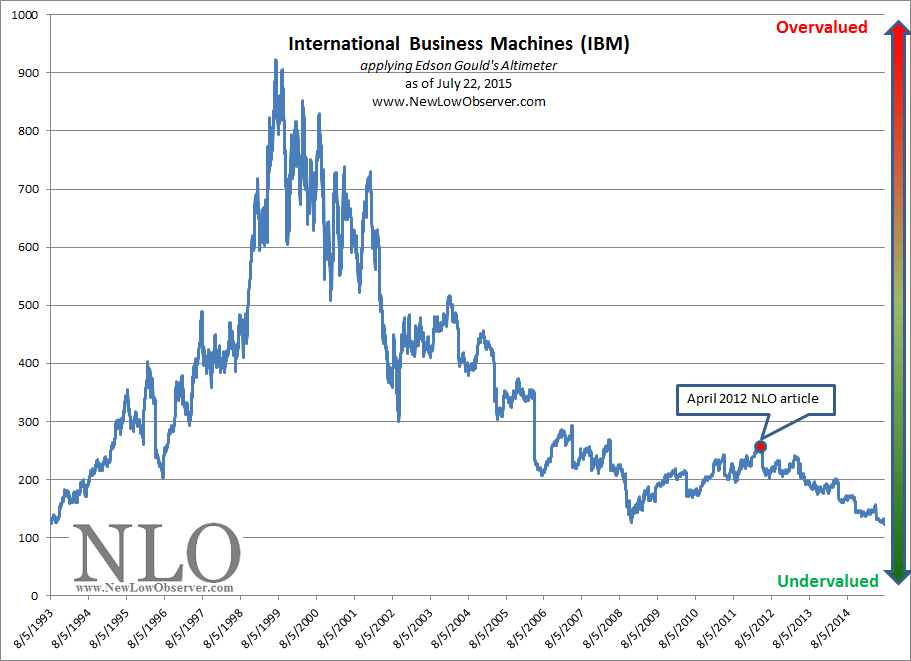
Since our article, IBM has declined from $207 to $161 with upside movement being limited to $213.

image

In spite of the price decline of nearly –22% since 2012, IBM has increased the dividend by +53%.   This has resulted in a situation where the price of IBM has becomes very compelling from a value perspective.  As indicated in our original article on IBM, the growth of the dividend has become an overpowering force which is creating a stock that could eclipse all expectation for long-term investors.  This leaves aside the topic of IBM share repurchases which Warren Buffett discussed in his 2011 shareholder letter.

Our premise of IBM’s valuation is narrowly perched on the work of Edson Gould’s Altimeter.  Below is an update of Gould’s Altimeter since our April 2012 article.

image

According to Gould’s Altimeter, IBM is now undervalued below the levels of the 2008 low.  We think that a value investor would have fun pouring over the data to determine the actual value of IBM.   Gould’s Speed Resistance Lines [SRL] indicate that the conservative downside target for IBM is $130.  However, we think a process of accumulation at the current price, and below, is a prudent long-term strategy.

Hospitality Properties Trust Downside Target

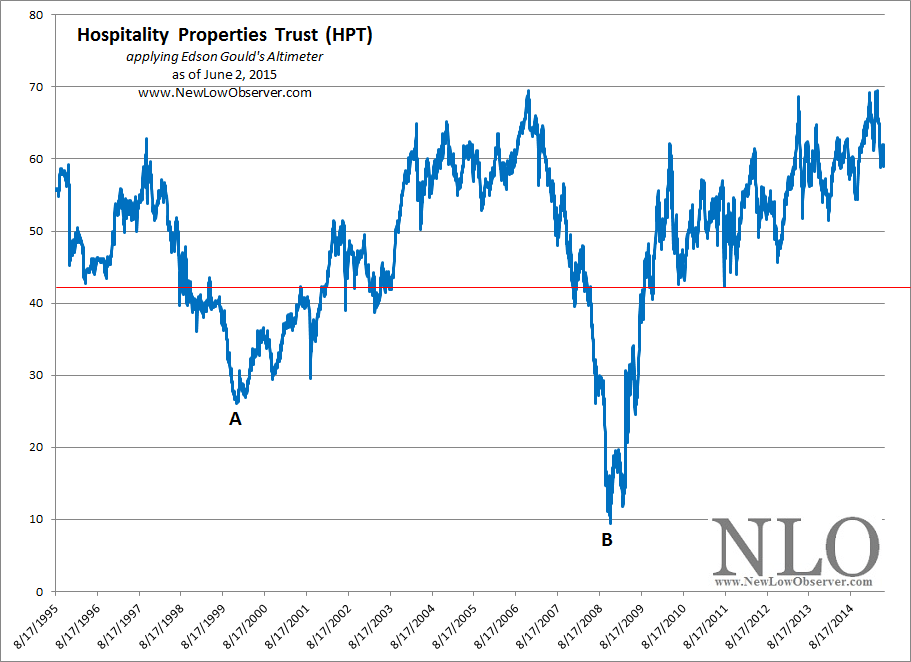
We’re always hopeful and expectant about the future prospects of any investment that we make.  However, that doesn’t mean that we’re going to ignore the most pressing matter when investing which is assessing the downside risk.  Below is the downside risk assessment for Hospitality Properties Trust (HPT) based on the work of Edson Gould.

The first tool of Gould is the Altimeter.  This assesses a stock based on the stock price relative to the dividend that is paid.  In this case, HPT has come off of a recent high near 70.  This high matched the high of late 2006, the subsequent decline brought the stock price down nearly –80%.  We don’t think that it is realistic to believe that HPT will decline as in the period from 2006 to 2008.  However, we’ve outlined in red a low that we feel is reasonable if a decline were to take place.  This low is at the $21 level where there appears to be a common retracement point.

image

If worse comes to worse, HPT could decline to point A or $13.00.  If a repeat of the housing crisis were to take place then HPT could decline as low as point B or $4.67.

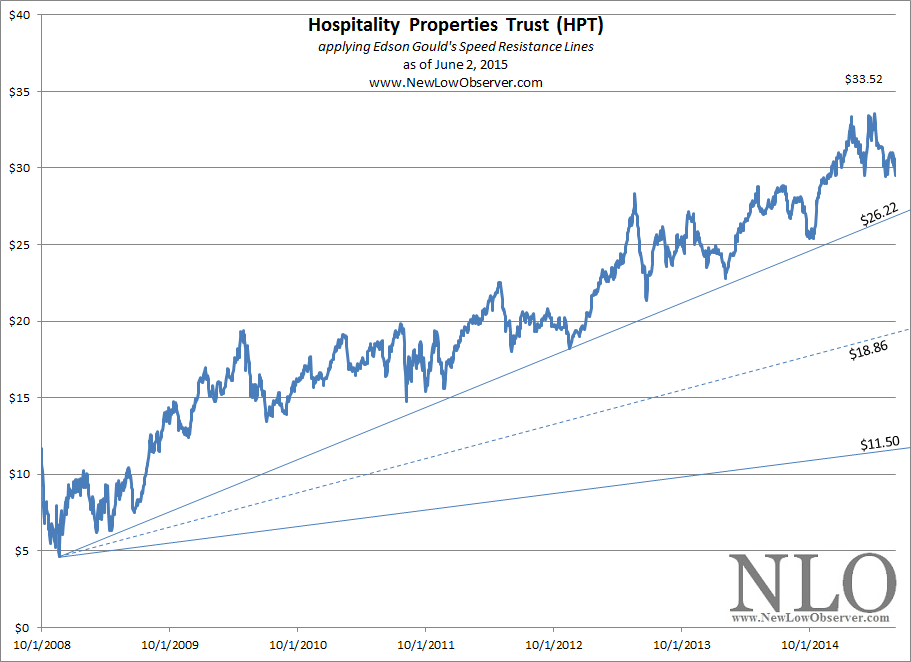
The other tool that Gould used was the Speed Resistance Line [SRL].  The SRL is ideal for stocks that increase significantly out of proportion to the general stock market.  As HPT has increased nearly twice that of the S&P 500, we feel that the SRL is the most appropriate assessment for downside risk.

image

In this case, the SRL indicates that the conservative downside target is $26.22.  In the previous decline of 2006 to 2008, HPT declined to the previous low set in 1999 at slightly below $5.00.  However, as we mentioned before, we don’t think that this time is anything like the rise and fall of the housing bubble.  Therefore, we’re looking for HPT to successfully breach the $26.22 level and retrace to the $18.86 level before a possible rebound.  Our experience has been for HPT to adhere to the ascending lines for most stocks that we have covered in the past.

Who is Edson Gould?

"Edson Gould spent over 60 years working in and studying financial markets. Gould studied the arts at Princeton, engineering at Lehigh (from where he graduated in 1922), and finance at New York University. In 1922, after working for a short time at Western Electric, he joined Moody's Investor Service as an analyst and later was editor of Moody's Stock Survey, Bond Survey, and Advisory Reports. In 1948, he began at Arthur Wiesenberger & Company, where he developed and edited the well-known Wiesenberger Investment Report and became a senior partner. He also was Research Director at E. B. Smith (which later became Smith Barney), and worked for Nuveen."

(source: Market Technicians Association. Gould, Edson Beers, Knowledge Base. Accessed April 26, 2012. link MTA reference.)

"Market technician Edson Gould always laughed at the idea of having a significant influence on the stock market, but his predictions were the most precise around. He pinpointed major bull markets and prophesied bottom-out markets as if he had his own peephole into the future. But in place of a crystal ball and wacky off-the-cuff schemes, his were smart, intensely researched and time-tested theories that made him a legend in the investment community."

(source: Fisher, Kenneth L.. 100 Minds That Made the Market. Business Classics, Woodside, CA. 1993. page 320.)

GMCR: Downside Targets

On October 25, 2011 when Green Mountain Coffee Roasters (GMCR) was trading at $63.85, we projected conservative and extreme downside targets of $59.93 and $37.21, respectively.  Subsequent price action for the stock brought the price as low as $17.11.  After achieving the downside target the stock rose as high as $158.87 by November 2014.  The potential gains of acquiring GMCR below either downside target was +165% and +326%.

The problem with this modeling of the past is having the fortitude of buying the stock and watching it fall –66% before the subsequent rise.  Can you handle a decline of –50% or more in your investments?  If you can’t sleep at night with losses of –50% or more then don’t bother reading any further as what follows is speculation of what would happen if history were to repeat (NOTE: history does not repeat).

Alternate reading on portfolio losses of –50% or more by Charlie Munger.

LinkedIn Corp. Downside Targets

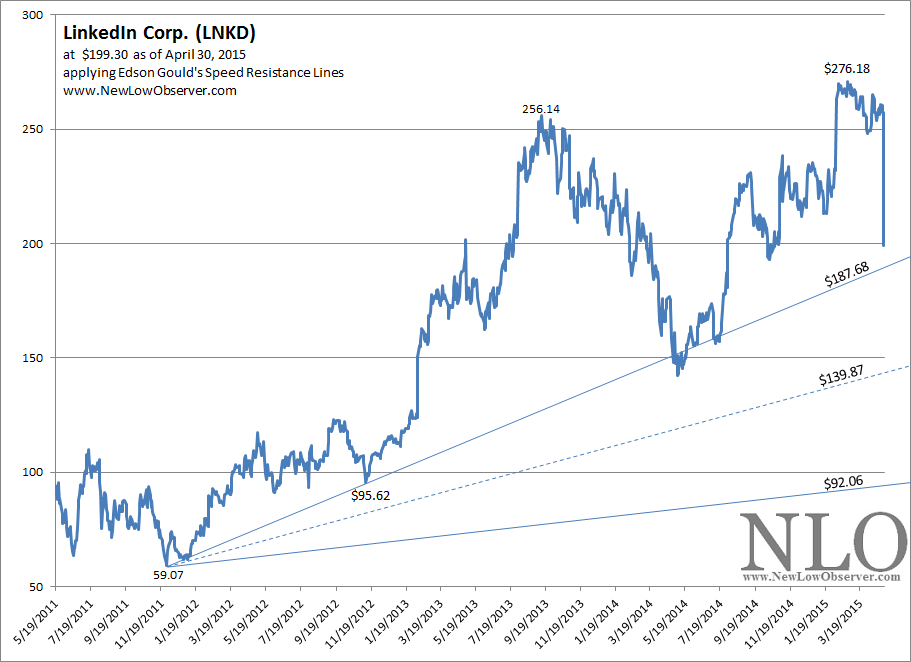
On April 30, 2015, in after-hours trading, LinkedIn (LNKD) declined –20.95% from the closing price of $252.13 to $199.30.  with such a decline, it is worth considering what the downside risk would be according to Edson Gould’s Speed Resistance Lines (SRL).

image

The above chart shows the current SRL downside targets based on the peak price of $276.16:

  • $187.68 (conservative target)
  • $139.87 (midpoint target)
  • $92.06 (extreme target)

What is most relevant in this SRL is the downside targets from the previous peak at $256.14.  At that time, LNKD had the following downside targets:

  • $181.00 (conservative target)
  • $133.19 (midpoint target)
  • $85.38 (extreme target)

In the prior decline, LNKD fell to slightly below the midpoint target at $133.19.  This suggests that the current slump should go below the conservative downside target of $187.68.  Going below the $187.68 level should get the stock price to the ascending midpoint target of $139.87.  Those interested in LNKD should consider the stock in stages at or below the ascending $139 level with an acceptance of a decline to the ascending $92.06 level.

Worth noting is that anyone who had a standing stop loss order with their broker, say below $250 or $240, will be forced out of their position once the stock market opens on May 1, 2015 at whatever the opening price is as long as it is below either of the sample levels.  At $199, investors with stop loss orders will take a severe beating even though they may not have been involved in the after hour activity.

A Different Perspective on Lumber Liquidator

On February 25, 2015, when Lumber Liquidator was trading at $57.23, we said the following:

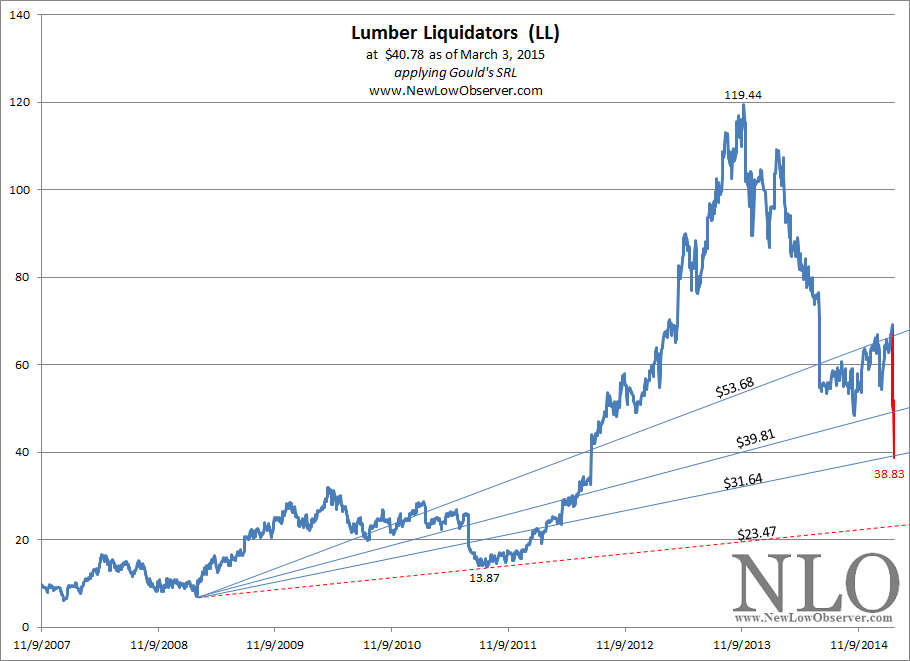
“Those interested in LL and willing to perform appropriate due diligence could engage in a three phase purchase plan beginning below $39.81, $31.64 and $23.47.  Investors, as opposed to speculators, should be willing to accept that there is no compensation for the wait when holding LL and that the decline to the ascending $23.47 level is a real risk.”

In fact, Lumber Liquidator blasted below the $39.81 support level and has rested at the $31.64 support level and started to move higher as seen in the chart below.

image

We’ve intentionally left out the move up from $38.83 to highlight the extent of the decline and the high level of coincidence with the supports levels that we had outlined in the previous month.  All that remains is the decline to the $23.47 level.

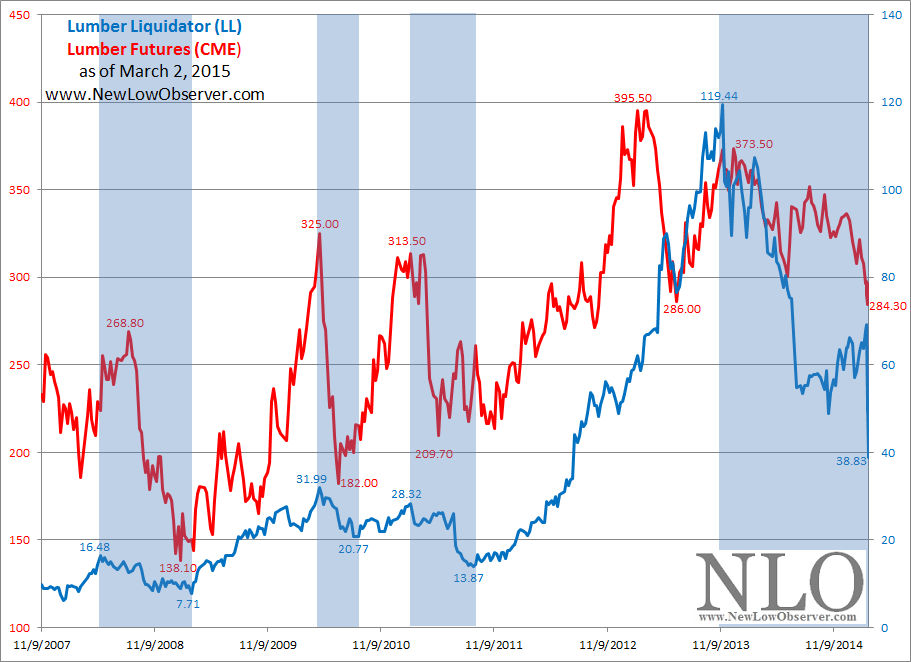
While famous short-sellers have the ear of influential media to talk their book and ensure their profits, we only have price action to work from.  For this reason, it is well worth noting another coincidence that relates to Lumber Liquidator and futures price on lumber as seen in the chart below.

image

The coincidence of Lumber Liquidator (LL) declining significantly at the same time as the futures price of lumber (as traded on the Chicago Mercantile Exchange) seems difficult to ignore.  Investors should take note of the fact that in three prior periods indicated in blue, LL has lost a minimum of –35% and as much as –53% when the price of lumber declined –33% or more. 

So far, from December 2013 to March 2015, the price of lumber has declined –23% while LL has declined as much as –67.49%.  Much of the decline in LL has been exacerbated by concerns related to quality and sourcing of the flooring.  However,  the current decline is only slightly out of alignment from what has happened in the past. 

We say slightly because we’re excluding the peak in lumber at 395.50 when LL was trading at $62.19.  While lumber was trading lower and not to exceed the $395.50 (considered a bear market), LL gained another +92.05%.  If Lumber Liquidator’s decline was measured from the February 15, 2013 peak in lumber at $395.50, the decline in the stock price would equal –37.56%.

Assuming we aren’t on the cusp a new bear market, the decline in LL has been overdone and an individual willing to accept the downside risk to $23.47 should consider implementing a three phase purchase plan.  An investor must keep in mind that the conservative upside target is $80.53 which is the new “limit” for the stock instead of the previous $119.44.  In addition, the downside targets now act as upside resistance level as was the case when LL could not sustain the $53.68 level prior to the recent collapse.