Category Archives: Edson Gould

Technical Take: LL & SAM

Below are the downside targets using Speed Resistance Lines [SRL] for Lumber Liquidator Holdings (LL) and Boston Beer Company (SAM) based on the work of Edson Gould.

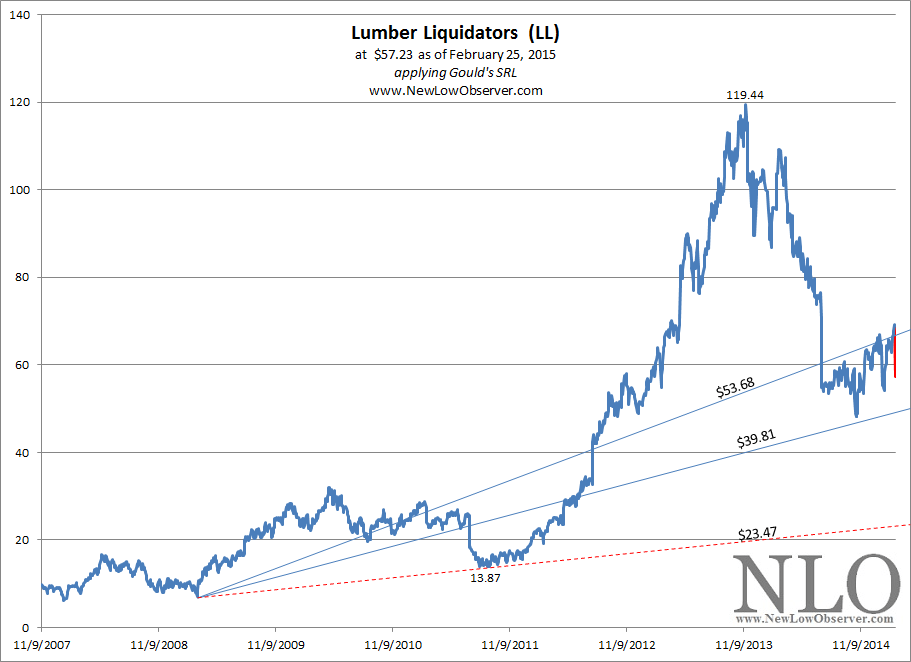
Lumber Liquidator (LL) has declined from the peak of $119.44.  Gould’s SRLs suggest that from the peak price, LL has a conservative downside target of $53.68 and an extreme downside target of $39.81.
image

On February 25, 2015, LL was unable to sustain a price above the ascending $53.68 level with a decline of over –17%.  Our best guess is that LL will decline to the ascending $39.81 level, which currently approximates $49.50 price.  Those interested in LL and willing to perform appropriate due diligence could engage in a three phase purchase plan beginning below $39.81, $31.64 and $23.47.  Investors, as opposed to speculators, should be willing to accept that there is no compensation for the wait when holding LL and that the decline to the ascending $23.47 level is a real risk.

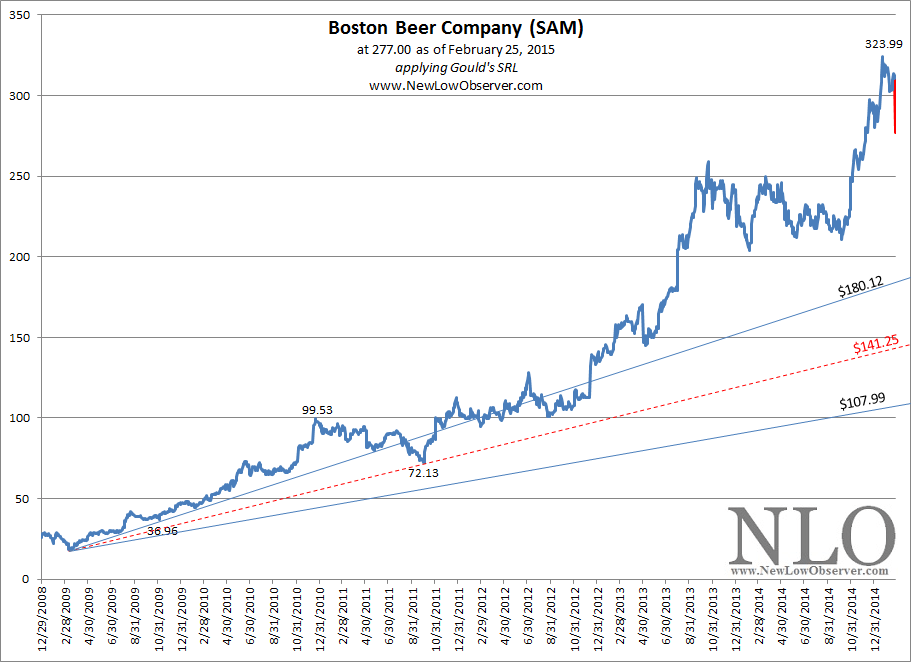
Boston Beer Company (SAM) is the brewer of Samuel Adams beer and a multitude of other “craft” beers.  Today SAM declined –10% on an earnings miss.  Below is the SRL for SAM.
image

Our expectations for SAM are not very high as the last time that the stock was able to achieve the conservative downside target of $70.13 was in 2011.  Since that time, SAM has faltered but not fallen.  In spite of this fact, we’ve outlined the conservative downside target of $180.12 and the extreme downside target of $107.99.  Investors should note that a decline to the ascending $180.12 level is an ideal buying target with a follow-up purchase below $141.25.  As with Lumber Liquidators, SAM is bet on growth in the stock price and not much else. 

The relative strength of each company (long-term viability) is what makes these stocks compelling and worth considering at the appropriate predetermined price.
TripAdvisor Running Away From Buyers

On February 12, 2015, news of Expedia (EXPE) buying Orbitz (OWW) combined with the earnings release by TripAdvisor (TRIP) has resulted in OWW increasing +21.83% while TRIP has increased by +23.76%.  This cannot be good news for Priceline (PCLN) shareholders as the likelihood of the company overpaying for TRIP grows.

Our February 6, 2015 Nasdaq 100 Watch List had the following review of TripAdvisor and Priceline:

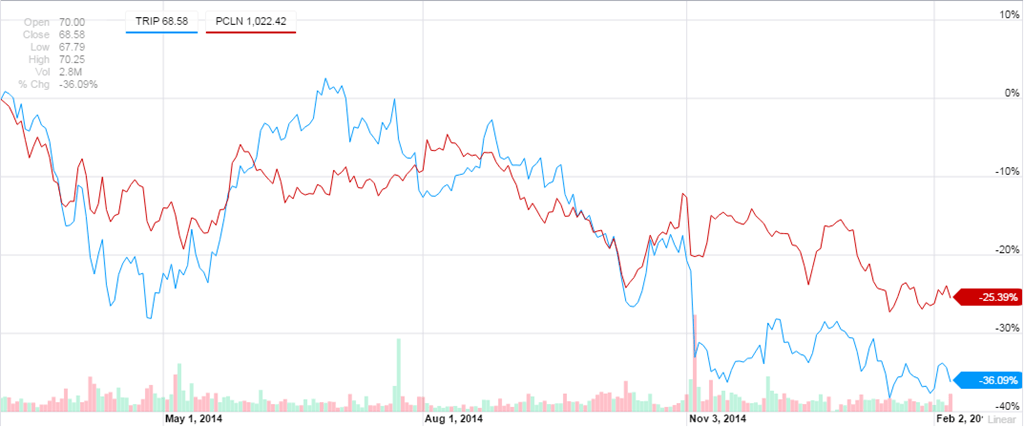
A couple of stocks that have caught our eye are Priceline (PCLN) and TripAdvisor (TRIP).  Both stocks are low in price relative to their March 2014 peaks. 

image

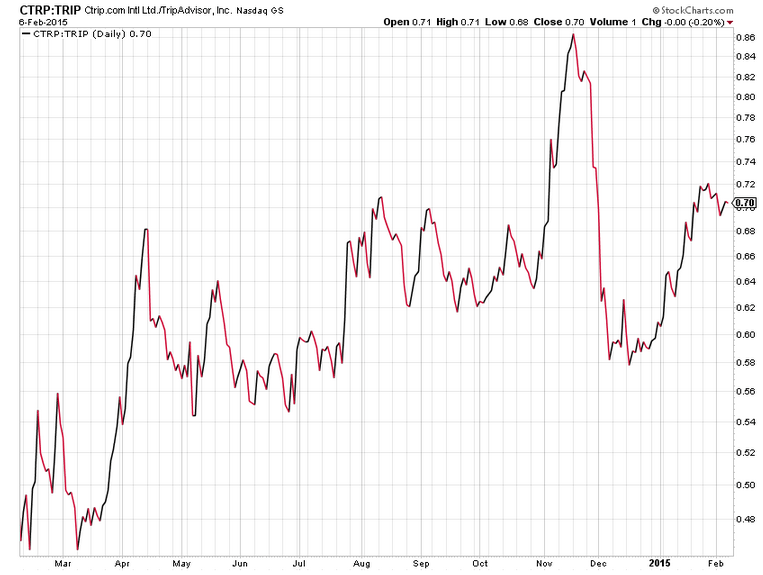
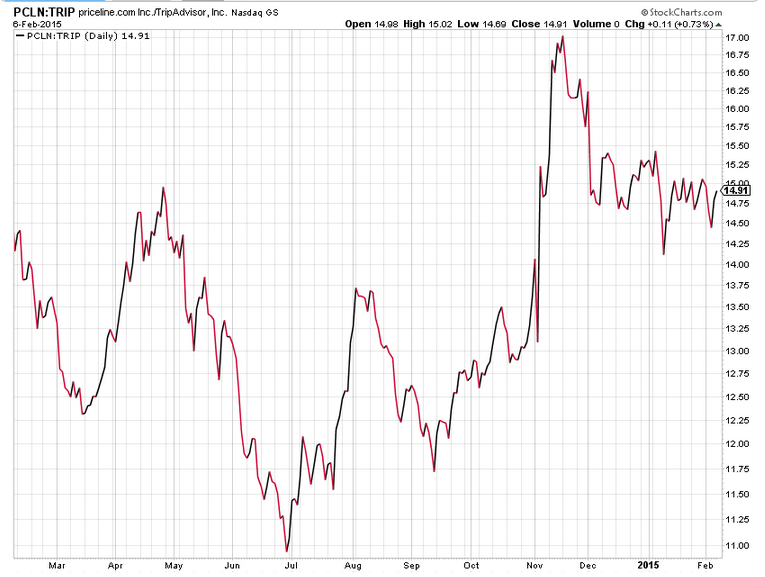
There has been some recent talk about PCLN absorbing TRIP in a buyout.  Below is the relative price difference between PCLN and TRIP.  In the last year, mid-November 2014 was the best time for PCLN to leverage the stock price to buy TRIP while July 2014 was the worst time to use stock to buy TRIP.

image

While PCLN has changed on a relatively small basis over the last year, Ctrip.com (a company that we correctly analyzed on December 2011) has had a tremendous amount of relative price change over TRIP in the last year.

image

While TripAdvisor (TRIP) may not be the best investment over Priceline (PCLN) on a fundamental basis, the potential for a buyout of TRIP may make good investment sense due to the need to eliminate a competitor or to take advantage of existing clients, assets or infrastructure.  Things could get worse for the market overall, pushing all of the stocks in the sector down. Barring a general market correction, investors probably have until the middle of December 2015 for a deal to be hammered out if the stock price doesn’t recover from the current levels.

We remain confident that TripAdvisor is the best relative value in the competition elimination game for the sector.  In reality, Ctrip.com acquiring TRIP is very unlikely.  However, we believe that with the recent jump in the price of TRIP, Priceline will feel the burn and get into a rampant bidding war for TRIP.  This could result in TRIP being acquired for well above the most recent 52-week high of $110. 

Below are the downside targets along with the conservative/extreme upside targets for TRIP based on Gould’s Speed Resistance Lines.  Non-members of our site wishing to view the upside/downside targets can send an email to nlo@newlowobserver.com.

Qualcomm Chokes and Other Thoughts

On January 29, 2015, Qualcomm (QCOM) announced that a “…key customer passed on new chip…”  On the news, QCOM stock fell as much as –12%.

Royal Gold: SRL Update

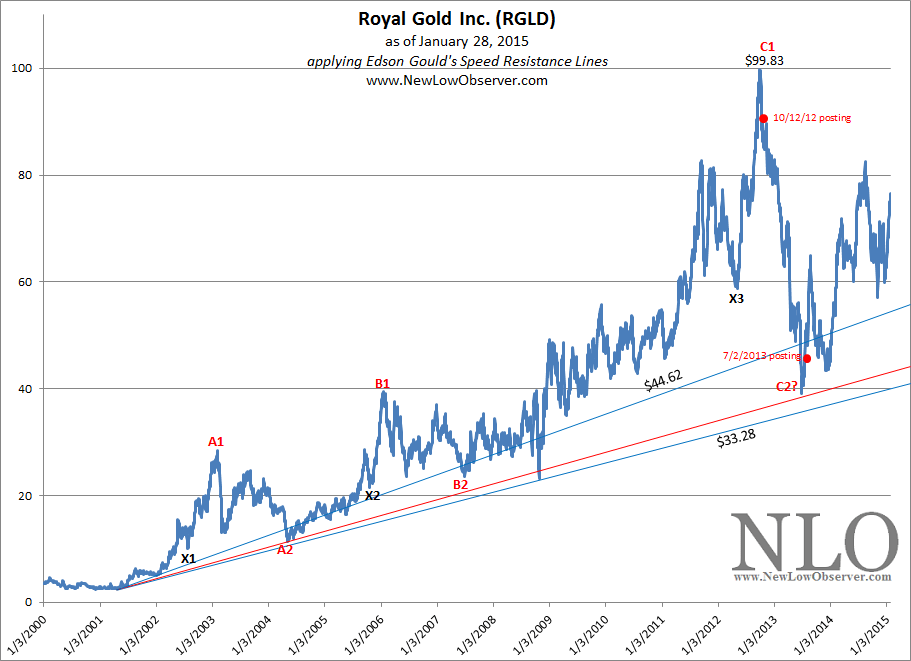
On October 12, 2012, we posted the following SRL for Royal Gold:

image

We said the following of the above chart:

“The SRL for Royal Gold at $44.62 doesn’t seem outlandish given what has already occurred in the previous declines from prior peaks.  The X marks the first decline after a “minor” parabolic move that was later exceeded on a larger scale to point A1, B1 and C1.  Additionally, the  X reflects the minimum retracement from the top and has provided consistent support for the price for RGLD.

“We’d consider buying RGLD if it declines to either of the support levels of X3 or C2.  The movement of RGLD has been consistent with the price of gold (GLD) which is in stark contrast with gold stocks as represented by the Philadelphia Gold and Silver Stock Index (^XAU)....”

On July 12, 2013, we said the following of RGLD:

“RGLD has fulfilled almost all of our expectations for downside risk since October 2012.  Although we’d much rather see this stock reach the extreme downside target of $33.28, we feel that purchases at the current level and below would be consistent with asset accumulation and wealth building, in contrast to those who were considering the stock at or near the October 2012 levels.”

So far, Royal Gold has adhered to the SRL outlined on October 12, 2012 and July 12, 2013 as displayed in the chart below.

image

Royal Gold has a mid-range upside target of $100.39 and an extreme upside target of $133.85 based on Gould’s Speed Resistance Line.  However, the upside targets are somewhat immaterial when considered from the context of buying based on values.

Clean Harbors Update

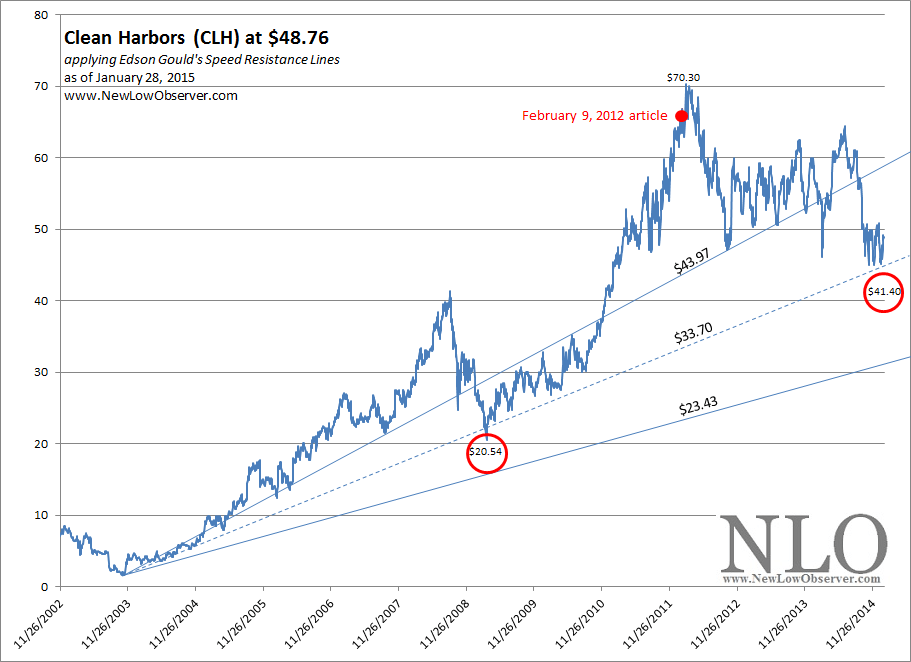
On February 9, 2012, we posted Edson Gould’s Speed Resistance Lines (SRL) for Clean Harbors (CLH) with the downside risk for the stock.  At the time, the downside targets were:

  • $43.53 (conservative downside target)
  • $31.00 (mid range)
  • $22.53 (extreme downside target)

Since that time, we’ve revised the downside targets to reflect the following minor changes.

  • $43.97 (conservative downside target)
  • $33.70 (mid range)
  • $23.43 (extreme downside target)

A visual of the downside targets reveals the value of Gould’s SRL.

image

So far, CLH has adhered to the SRL that was initially outlined in 2012.  If we consider the period of 2007 to 2009, when the stock fell as low as $20.54 and extend that same decline to the current period, then CLH could decline as low as $41.40.  This assumption is predicated on the stock market not experiencing a precipitous decline from the current level.  A broad market decline would easily bring CLH to the ascending $23.43 level in the SRL. 

While the fundamentals are not glowing for CLH as it goes through the process of spinning off its oil and gas services unit, which could “…take more than a year for the spinoff to be completed…”, there are expectations that the current actions will refocus the company.

Speculators, those willing to accept the downside risk of –36%, could purchase CLH with 25% of intended funds at $45.10 and $41.40.  The final purchase would be at $31.00 or below.  Investors, those willing to hold for 5 years or more, would want to re-assess CLH at $34 and below.

Oil and Gas Stock Index Downside Targets

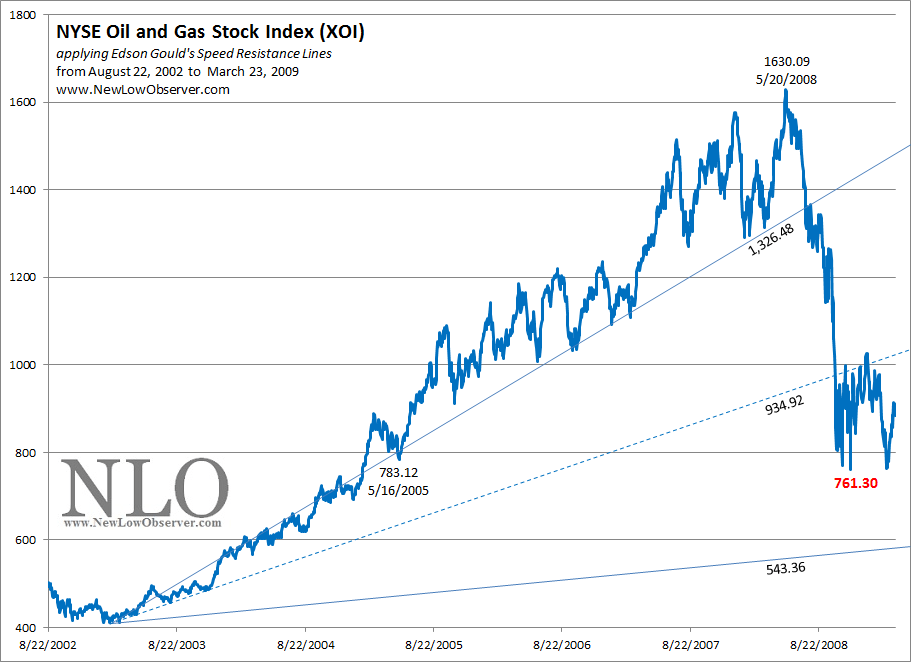
In the period from 2002 to 2009, the NYSE Oil and Gas Stock Index (XOI) presents us with a possible template for what to expect in the current decline in the same index.  Below is Gould’s Speed Resistance Lines (SRL) for 2002 to 2009 of the XOI Index.

image

The above chart shows the conservative downside target of 1,326.48 and the extreme downside target of 543.36.  The mid-point of the downside targets is 934.92.  In the case of the XOI index, it managed to achieved the conservative and mid range for the index.  However, the extreme downside target was not achieved.  The full extent of the decline is indicated in red at the 761.30 level.

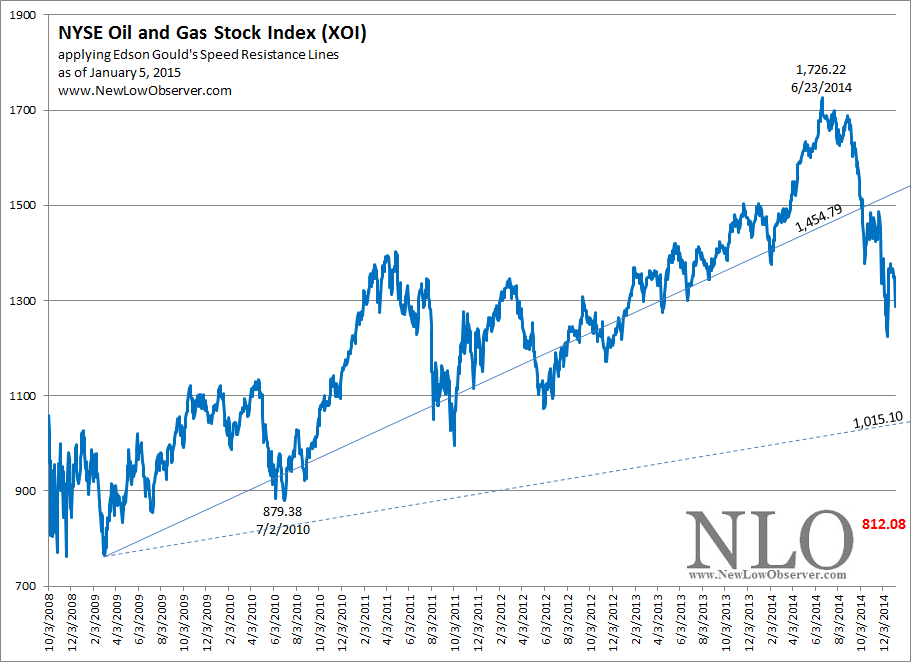
Our guess is that the XOI index will accomplish a similar pattern of “performance” on the downside in the current run as was the case in the 2002 to 2009 period.  We’ve charted the progress of the XOI Index in the period from 2008 to the present with Gould’s SRL.

image

The conservative downside target of 1,454.79 has been constructed while the mid-point of 1,015.10 is also indicated.  However, we did not include the extreme downside target of 575.41.  We did indicate in red the 812.08 level which was the extent of the decline in the period from the 2008 high to the 2009 low. 

Suffice to say that we expect the XOI index could easily fall to 1,015.10 and subsequently to the 812.08.  Those interested in the oil sector should start initiating positions at or below the ascending 1,015.10 level.  Two funds that trade in line with the XOI index are PowerShares DB Oil ETF (DBO) and Direxion Daily Energy Bull 3x (ERX).  One ETF that trades the opposite of the XOI index is the Direxion Daily Energy Bear 3x (ERY).

Best Buy’s New Normal

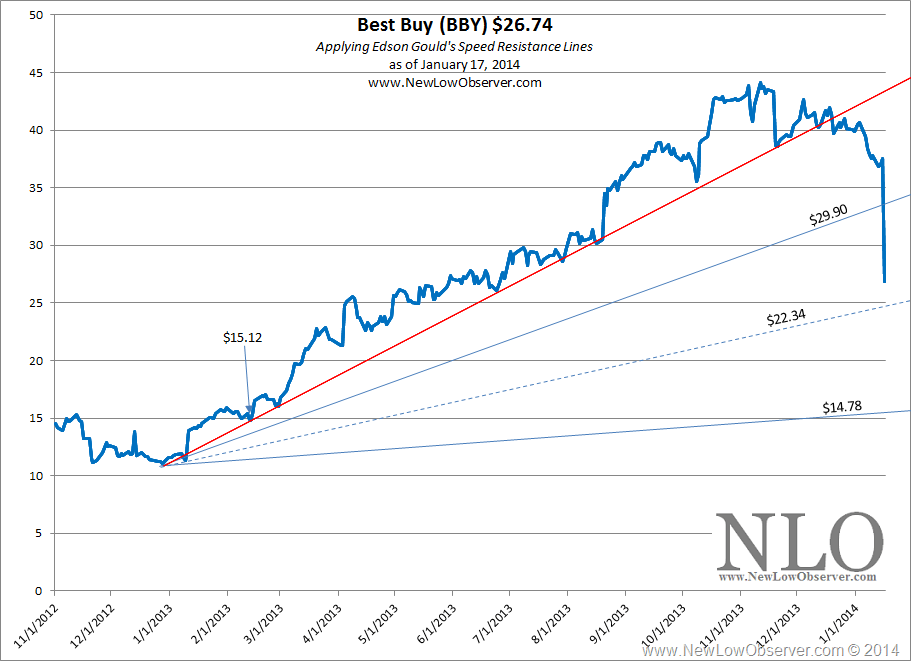
On January 17, 2014, we posted Edson Gould’s Speed Resistance Lines for Best Buy (BBY) in an attempt to determine what the extent of the decline might be.  From that posting we said the following:

“Best Buy has had a history of resting [at] the extreme downside target, currently at $14.78.  However, we have split the difference and placed an intermediate downside support level of $22.34.  Again, this is not a recommendation to buy or sell Best Buy, instead, it is an attempt to observe how closely the stock will adhere to the SRLs indicated in the chart.”

image 

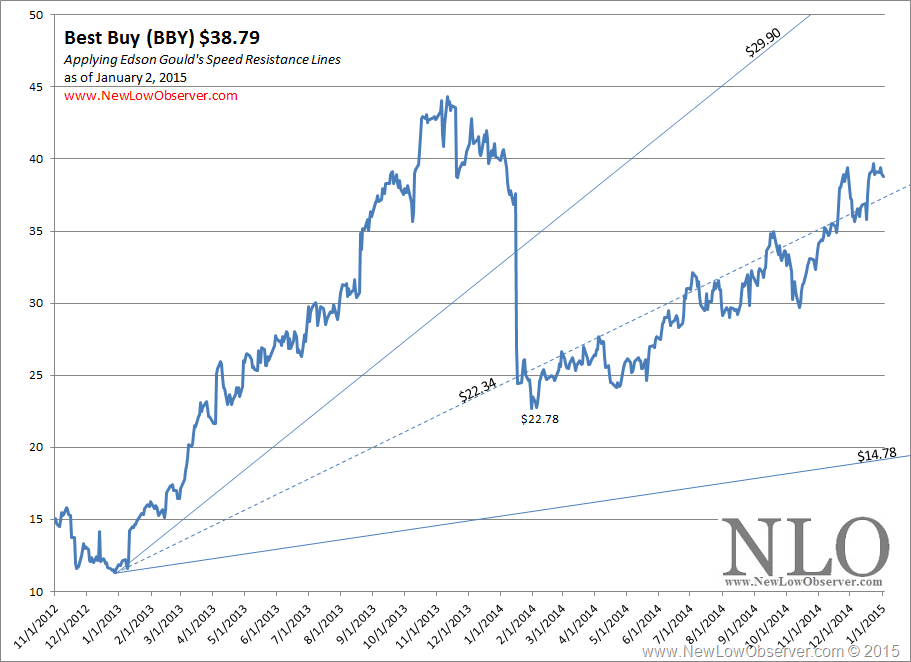
Nearly one year later, we can see that although the historical trend had been for BBY to decline to the extreme downside target ( at $14.78), the estimate of $22.34 was a fair assessment of downside risk as the stock has managed to vacillate at or above the ascending $22.34 level seen below.

image

The quality of Gould’s SRL has been fairly consistent and reasonably accurate.  We look forward to introducing additional SRLs of stocks that have established a declining trend to determine downside targets.  The conservative upside target for BBY is $44.85.

Netflix: Downside Targets

Review

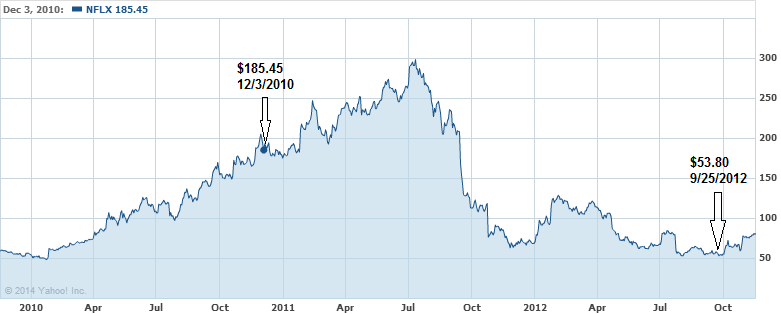
On December 3, 2010, we ran the numbers for Netflix,based on the work of Edson Gould’s Speed Resistance Lines, to determine what the downside risk might be for the stock.  The projected downside targets are illustrated below:

Not long afterwards, Netflix stock price soared from $185.45 to $300.  However, the goal of our site is to determine downside risk and the rise in the stock price of was of little interest.  Our view is that if we missed an investment opportunity then we will consider investing only if the stock declines to any of the anticipated downside targets.

image 

Naturally, there was considerable opportunity that we missed on the way from $185 to $300.  However, our rule is to seek values and from our experience all quality companies become undervalued at some point. Finally and for numerous reasons, Netflix declined from the peak of $300 to as low as $53.80.  Naturally, we were able to pick up shares of Netflix at $62, a price we felt was reasonable at the time.  Our critical review of the downside targets allows us to accept our purchases for the long-term in case we happen to be wrong about the short-term upside prospects.

October 15, 2014: Netflix Downside Targets

Quick Take: GoPro Downside Targets

We’re fascinated with the news surrounding GoPro (GPRO).  The stock went public on June 26, 2014 at $24 per share and has since increase in price to $89.93 as of October 8, 2014.  As public offerings go, the rise in price is considered a success.  As recently as October 7, 2014, Barclays raised their price target for GPRO from $45 to $60, in spite of the fact that the stock is already trading well above the new target price.  It seems that Barclays doesn’t want to appear over anxious to recommend the stock even though they are not confirming their expectation for the stock to decline.

Continue reading

Quick Take: Consolidated Edison

“The valuation problem is far from academic: In recent years, some huge-scale frauds and near-frauds have been facilitated by derivatives trades. In the energy and electric utility sectors, for example, companies used derivatives and trading activities to report great ‘earnings’ – until the roof fell in when they actually tried to convert the derivatives-related receivables on their balance sheets into cash. ‘Mark-to-market’ then turned out to be truly ‘mark-to-myth.’”

Buffett, Warren. Berkshire Hathaway. 2002 Letter to Shareholders. February 21, 2003.

Berkshire Hathaway: 10-year Price Projections

In our May 6, 2012 posting on Berkshire Hathaway (BRK-A) titled “Should Berkshire Hathaway Be Trading at 1995 Prices?”, we gave price projections based on Edson Gould’s Altimeter using very conservative estimates if BRK-A paid a dividend.  As we’ve managed to achieve the middle of the three upside targets set down in our 2012 article, we’re going to list the price that we think BRK-A would be considered undervalued for each of the next 10 years.

Apple meets NLO Upside Target

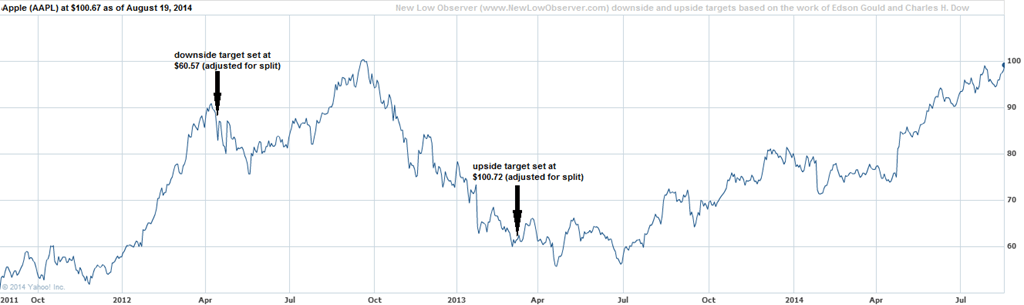
On August 19, 2014, Apple (AAPL) stock price rose as high as $100.66.  When Apple was trading at $61.61 on March 9, 2013, we said the following with the accompanying chart:

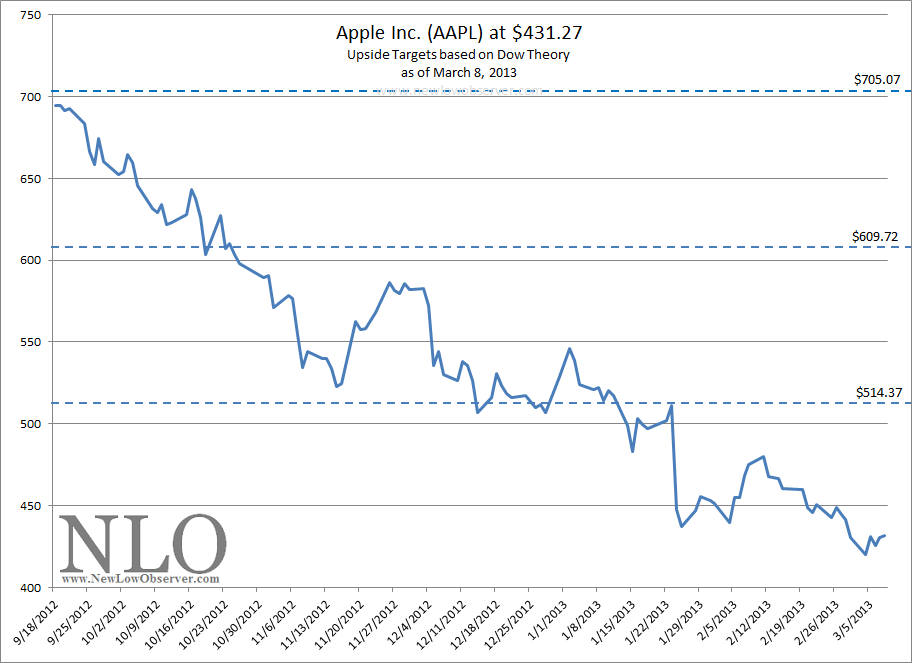
“Apple Inc. (AAPL) is at the top of our watch list as it is within 5% of the one year low.  In our April 14, 2012 test of the quality of Edson Gould’s Speed Resistance lines, Apple fell from $636 [adjusted price of $90.85] to our projected level of $424.15 [adjusted price of $60.59] (found here).  Now that the stock has achieved our downside target, we expected that a reaction to the upside is likely.”

image

On July 17, 2013, when Apple was trading at $61.47, we re-affirmed our view of the upside potential for Apple with the following commentary:

“Currently, Apple is demonstrating a basing pattern that if successful, could result in a breakout to the upside.  At the current levels, we wouldn’t be opposed to buying some shares of Apple with the expectation that the stock could decline an additional –25% to –35%.”

The work of Edson Gould has proven to be astounding when considered in its context.  On April 14, 2012, we posted an article titled “Considering the Downside Prospects for Apple”.  At that time, we were revising the previous estimates of downside risk done on February 5, 2012 (third party source available here).

What was mentioned on February 5, 2012 is critical to understanding how Edson Gould’s downside projections work.  At the time, we said:

“The very first thing that we look for, to determine speed resistance lines, is the most recent peak in the price. Because AAPL is continually making new highs, we only need to use the latest price of $455.68 [post split price of $65.09] as our starting point….As the price of Apple increases, so too does the SRL lines based on the work of Edson Gould.”

This means that as long as the price of the stock increases to a new high the speed resistance lines are expected to increase as well.  Only when the stock starts on a declining trend can we expect that the stock price might go to the conservative and extreme downside targets.

image

On April 14, 2012, when Apple was trading at $90.89 (pre-split price of $636.23), we said the following:

“…we believe that, based on the current speed resistance lines, no one would expect Apple to decline to our conservative downside target of $424 (post split price of $60.57)...”

The strength of Gould’s downside risk estimates is that we didn’t even have the peak price of $100.71 set on September 18, 2012 but we were still able to see the conservative downside target of $60.57 achieved.  Had we used the peak price, we would have achieved the $67.14 conservative downside target much earlier than the $60.57 level.

Berkshire Hathaway Meets NLO Target

On May 6, 2012, we proposed that Berkshire Hathaway (BRK-A) was trading at a price that was well below its true value.  At the time, BRK-A was trading at $164,990 per share.  However, we proposed that Berkshire Hathaway should have been selling at much higher prices with upside targets of $175k, $197k and $219k in a 2-3 year timeframe.  As BRK-A sits within 1% of our mid-range target of $197,190 after two years, we believe it is time to reassess where Berkshire Hathaway sits within the context of Edson Gould’s Altimeter.

Nu Skin Meets Our Downside Target

On January 16, 2014 at 8:40am EST, we said the following of Nu Skin Enterprises (NUS):

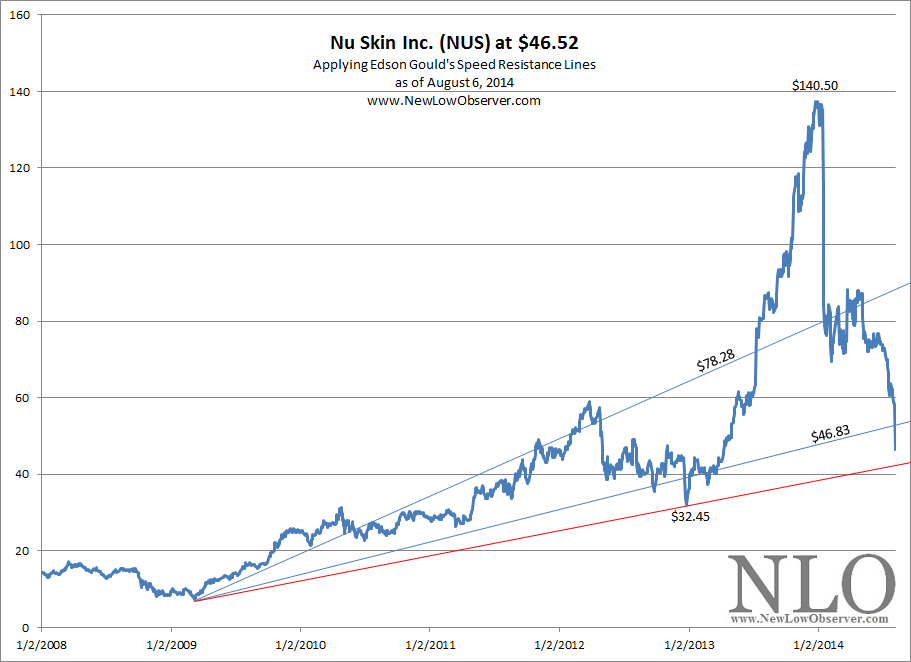
“If the stock closes below $79.28 then the price should vacillate at or below the rising conservative SRL in the medium-term.  If the stock manages to close above the $79.28 level then the upside target is $118.92.  Additionally, the extreme downside target of $46.83 is just on the horizon.  In theory, this stock should achieve the extreme downside level before hardened speculators will jump in.”

On August 6, 2014, NUS declined as low as $43.50 and closed at $46.52.  An updated Speed Resistance Line is included below:

image

NUS has met our January 2014 call for the extreme downside target of $46.83.  It is at this point that NUS becomes interesting to hardened speculators.  Based on Gould’s SRL, NUS has an upside targets of $82.73 and $118.92. 

Dow Altimeter Review

As the Dow Industrials meander near all-time highs, it is necessary to review Edson Gould’s Altimeter for the index.

Continue reading