- Japan
- Market Indicator
- Price Momentum Indicators
- Richard Russell
- Silver
- Speed Resistance Lines
- U.S. Dividend Watch List

On November 19, 2013, we said the following:
“Our conservative downside target for Bitcoin, based on the peak closing price of $785.50 is $384.83. The extreme downside target is $261.83. The worst case scenario is for Bitcoin to fall as low as $152.83 as indicated by the red line on the chart.
As we’ve written many pieces on the topic of Edson Gould’s Speed Resistance Line, we’ve made some observations that we think should be highlighted at this time. For the first time, we’re going to provide what we believe might be an upside target. In the case of Bitcoin, the next conservative upside target is $1,154.49 if the most recent peak of $785.50 is exceeded. This is a tentative estimate based on observations of the many successful downside SRLs that we have run in the past. We’ll be on the lookout for what may come next.”
After offering up our upside target of $1,154.49, Bitcoin peaked at $1,147.25. The downside targets, a standing number for when and if a decline ensued, were promptly followed by Bitcoin declining to $177.28.

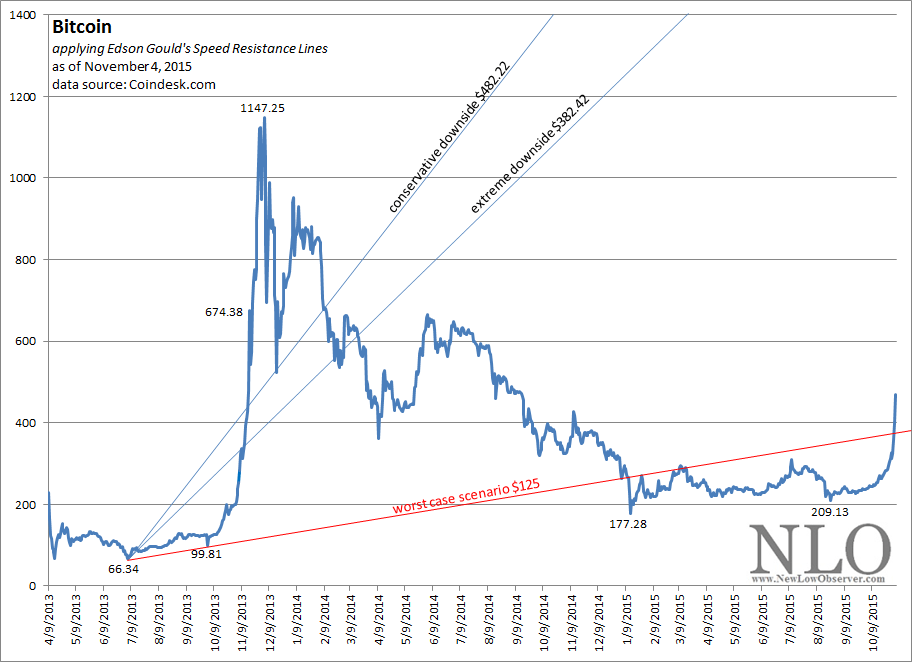
It has taken some time but Bitcoin appears to be on the rebound. The last quote received was $424 which is above our previous worst case scenario for the digital currency.
Below is the latest downside target based on the current peak price of $424.
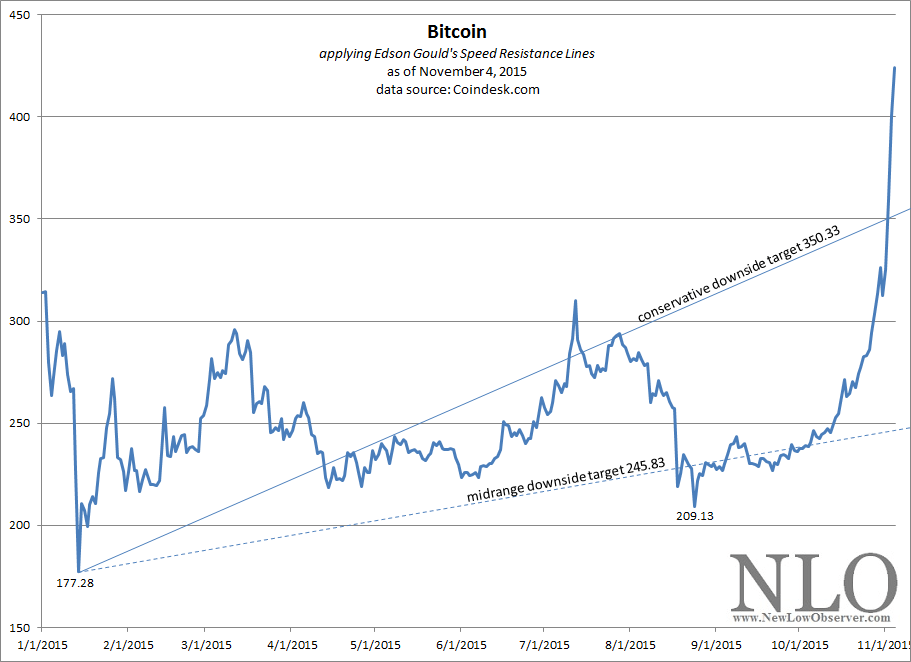
We focus on the downside risk to prepare for prudent employment of capital. Any and all ventures, whether speculative or investment related, should be with the expectation that the worst case scenario is likely. For this reason, we have indicated the conservative and midrange downside targets on the chart. One number that has been left out of the chart above (but should be factored in) is the extreme downside target of $141.33. These numbers will change when and if Bitcoin charges higher.
Currently, the upside targets are:
If the current run-up is anything like those in the past, $1,051 could be a relatively small number. However, each of the indicated upside targets must be achieved first before we can start giving estimates of how far beyond $1,051 Bitcoin could go.
Posted in Bitcoin, Edson Gould, speed resistance line, SRL
Posted in downside, Edson Gould, speed resistance line, SRL, Wolverine World Wide, WWW
It could get bad if the Shanghai Composite Index cannot sustain the brief increase that it has experience since the August 26, 2015 low.
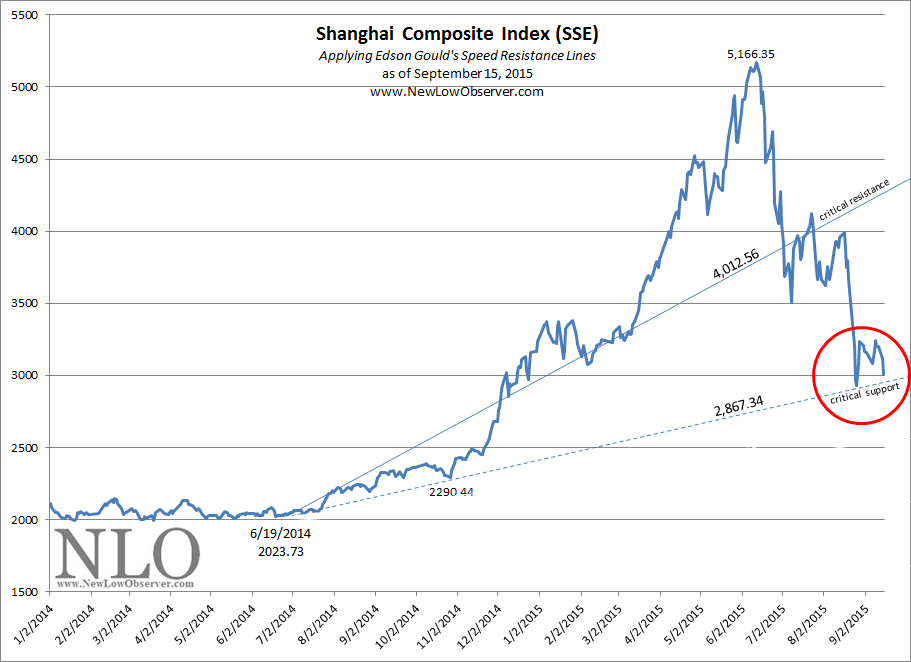
As we touched upon this topic on August 23, 2015, the next downside target could be a long way down from the current level at 1,722.12. If the current support level of 2,867.34 cannot be maintained then the only downside supports levels are 2,294.73 and 1,722.12.
Posted in Edson Gould, Shanghai Composite Index, SRL
It is clear that the commodity market is in the dumps. The chart below outlines the course of the Bloomberg Commodity Index since the July 2008 peak.
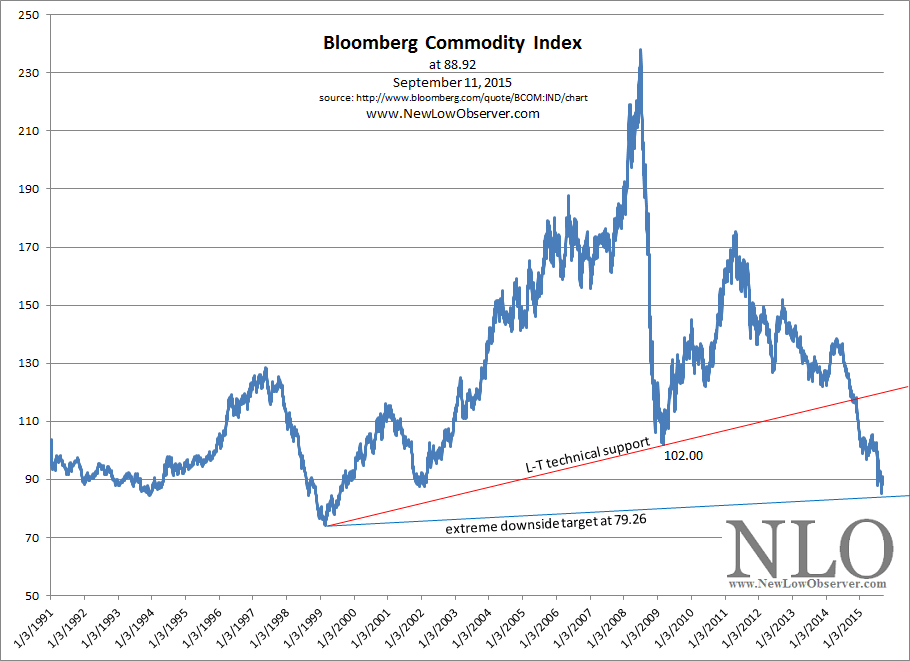
With the decline that has occurred in the index, it would be obvious to any long-term investor that there are values to be had. Yeah, there are risks but we’re investors not savers (anyone confused about the difference between saving and investing? Savers expect the money to be there no matter what, investors are taking the risk that more or less will be there, after the passage of time). One idea that we think is worth entertaining (or researching) is a stock that we’ve followed for many years.
Posted in Edson Gould, Helmerich & Payne, Quick Take, speed resistance line, SRL
According to Yahoo!Finance, “Dover Corporation manufactures and sells a range of equipment and components, specialty systems, and support services in the United States. The company operates in four segments: Energy, Engineered Systems, Fluids, and Refrigeration & Food Equipment. The Energy segment provides solutions and services for the production and processing of oil, natural gas liquids, and gas to drilling and production, bearings and compression, and automation end markets.”
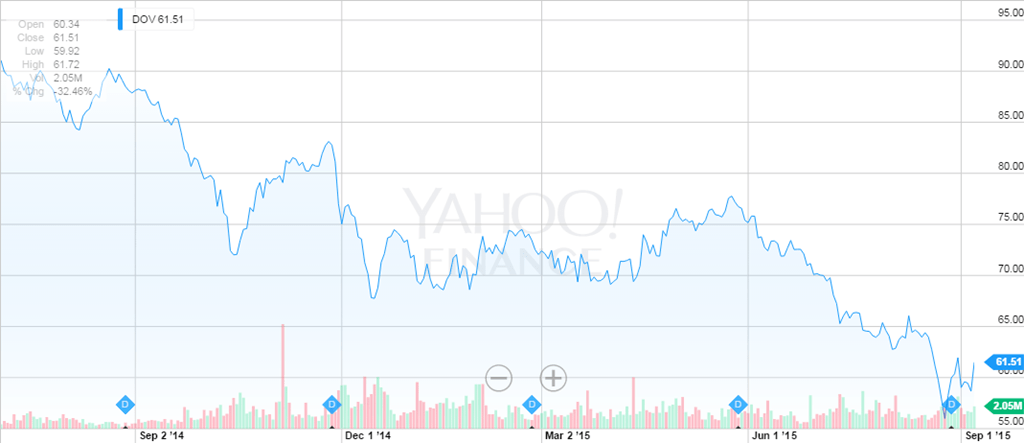
The price of Dover Corp. (DOV) has declined by –32.46% since the early July 2014 peak. Looking at the stock, it appears that the downward spiral is locked in. The following are some thoughts about the stock.
Posted in Altimeter, Charles H. Dow, DOV, Dover, Dow Theory, Edson Gould, Quick Take
It’s that time again. We’re going to see what the effectiveness of Gould’s Speed Resistance Lines (SRL) is in predicting the downside for Netflix (NFLX). But first we’re going to review the last time that we ran an SRL on Netflix. The very first time we ran numbers on NFLX was on December 3, 2010 when the stock was trading at the pre-split price of $185.45.
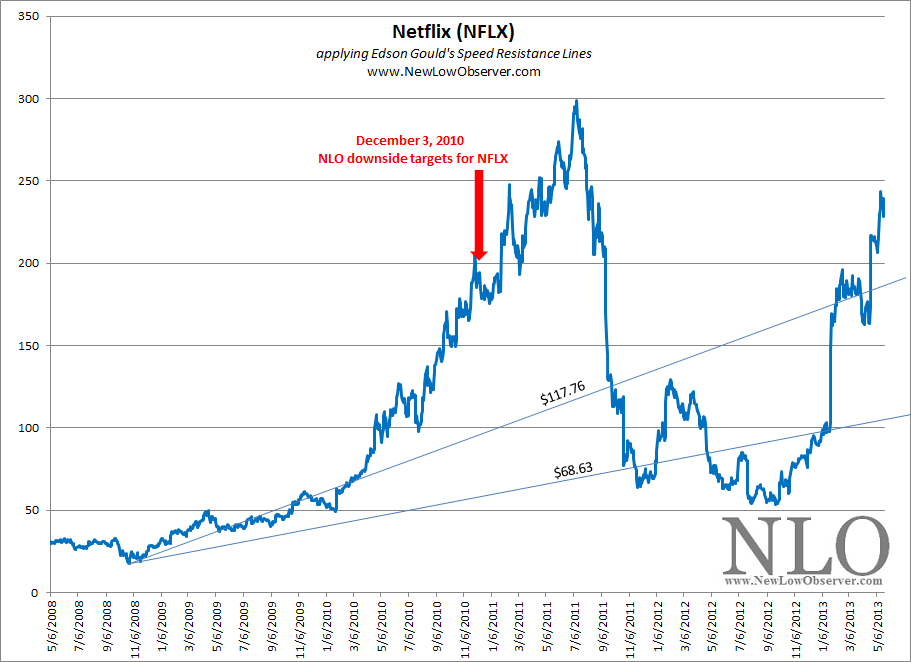
At the time, we were testing out the quality of Gould’s work. We came up with a conservative downside target of $117.76 and an extreme downside target of $68.63. The most challenging part of the assessment was the fact that Netflix increased +50% before achieving the first downside target.
A follow-up review of the SRL on Netflix was done on September 22, 2011 where we had the following to say:
“…in reviewing the chart pattern of Netflix (NFLX), we have the peak of NFLX at $298.73. The conservative estimate for the stock is that it would fall to $148 which has already taken place. The extreme downside target would be $99.58. Because of the nature of the rise, we believe that Netflix (NFLX) is slated to fall at least to the $99.58 level.”
At the time, we proposed that NFLX would decline at least -66% from the peak of $298.73. The actual decline was -79.89%. Will it happen again? We don’t know. However, if it does, there will be good buying opportunities ahead.
Posted in Edson Gould, NFLX, speed resistance line, SRL