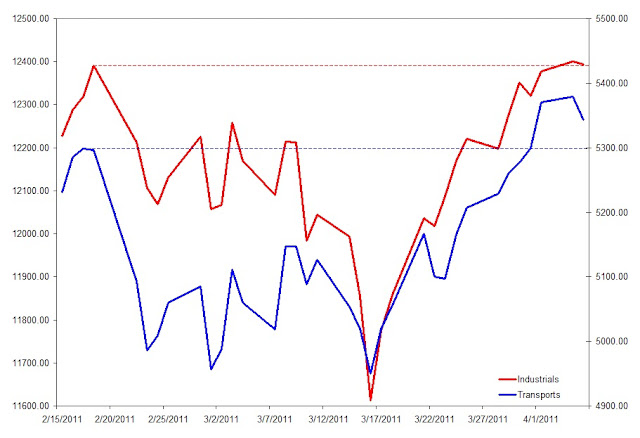
- Japan
- Market Indicator
- Price Momentum Indicators
- Richard Russell
- Silver
- Speed Resistance Lines
- U.S. Dividend Watch List
Posted in book, Dow Theory, Robert Rhea
| Symbol | Name | Trade | P/E | EPS | Yield | P/B | % from Low |
| CSCO | Cisco Systems | $17.04 | 12.89 | $1.32 | 1.40% | 2.08 | 0.41% |
| URBN | Urban Outfitters | $30.35 | 18.97 | $1.60 | 0 | 3.48 | 4.55% |
| AMGN | Amgen Inc. | $53.08 | 11.08 | $4.79 | 0 | 2.08 | 5.61% |
| TEVA | Teva Pharma. | $50.54 | 13.79 | $3.66 | 1.80% | 2.05 | 7.55% |
| ATVI | Activision Blizzard | $11.01 | 33.36 | $0.33 | 1.50% | 1.27 | 10.21% |
| INTC | Intel Corporation | $19.72 | 9.81 | $2.01 | 3.60% | 2.25 | 12.05% |
| MSFT | Microsoft Corp. | $25.48 | 10.87 | $2.34 | 2.50% | 4.4 | 12.10% |
| MRVL | Marvell Tech. | $15.93 | 11.89 | $1.34 | 0 | 1.84 | 14.85% |
| SPLS | Staples | $20.06 | 16.58 | $1.21 | 2.00% | 2.02 | 14.96% |
| CELG | Celgene Corp. | $57.30 | 30.48 | $1.88 | 0 | 4.53 | 19.33% |
| AKAM | Akamai | $37.60 | 41.59 | $0.90 | 0 | 3.26 | 19.59% |
| QGEN | Qiagen N.V. | $20.31 | 33.85 | $0.60 | 0 | 1.89 | 20.46% |
| EXPE | Expedia, Inc. | $22.26 | 15.25 | $1.46 | 1.30% | 2.32 | 21.64% |
| APOL | Apollo Group | $41.41 | 11.36 | $3.65 | 0 | 4.17 | 22.70% |
| MAT | Mattel, Inc. | $25.26 | 13.6 | $1.86 | 3.70% | 3.31 | 25.42% |
Nasdaq 100 Summary
Nasdaq 100 Performance Review
| Symbol | Name | 3/26/2010 | 3/26/2011 | % change | |||
| GILD | Gilead Sciences | $45.34 | $42.08 | -7.19% | |||
| GENZ | Genzyme Corp. | $53.00 | $75.94 | 43.28% | |||
| APOL | Apollo Group | $61.28 | $43.51 | -29.00% | |||
| QCOM | Qualcomm | $41.10 | $52.75 | 28.35% | |||
| FSLR | First Solar | $116.50 | $150.44 | 29.13% | |||
| SRCL | Stericycle, Inc. | $54.50 | $88.82 | 62.97% | |||
| - | Average | - | - | 21.26% | |||
| NDX | Nasdaq 100 | 1952.63 | 2326.26 | 19.13% | |||
| Company | Symbol | March 29, 2010 | March 28, 2011 | % change |
| Costco Wholesale | COST | $59.36 | $71.26 | 20.05% |
| AT&T | T | $24.91 | $29.36 | 17.86% |
| ADP | ADP | $43.15 | $50.35 | 16.69% |
| Markel | MKL | $372.70 | $405.12 | 8.70% |
| Pepsico | PEP | $64.57 | $64.34 | -0.36% |
| Proctor & Gamble | PG | $61.82 | $60.66 | -1.88% |
| Johnson & Johnson | JNJ | $62.52 | $59.24 | -5.25% |
| Intel | INTC | $21.65 | $20.34 | -6.05% |
| Average | - | - | - | 6.22% |
| Dow Industrial Average | - | 10895.86 | 12197.88 | 11.95% |
| S&P 500 | - | 1173.22 | 1310.19 | 11.67% |
| Symbol | Name | 3/26/2010 | 3/18/2011 | % change | Yield at rec'd |
| MKC | McCormick | 36.67 | 49.61 | 35.29% | 2.70% |
| ADP | ADP | 42.86 | 50.37 | 17.52% | 3.00% |
| CLX | Clorox Co. | 62.47 | 69.48 | 11.22% | 3.10% |
| SYY | Sysco Corp. | 28.18 | 27.86 | -1.14% | 3.50% |
| PG | Procter & Gamble | 61.78 | 60.88 | -1.46% | 2.80% |
| PEP | Pepsico, Inc. | 64.61 | 63.98 | -0.98% | 2.70% |
| ABT | Abbott Labs | 51.07 | 48.03 | -5.95% | 3.00% |
| HCBK | Hudson City Bancorp | 13.31 | 9.87 | -25.85% | 4.30% |
| Average | 3.58% | 3.14% | |||
It is noted that at the time of the recommendation of these stocks, they were at or near their respective 52-week highs. This is a critical element, recommending stocks at the high, that we strive to avoid. Our most recent list of Dividend Achievers with the one year performance can be found here.
| Symbol | Name | 2010 Adj. Price* | 2011 Price | % change | Yield at rec'd |
| RAVN | Raven Industries | 28.16 | 58.65 | 108.27% | 2.89% |
| HIFS | Hingham Savings | 32.34 | 51.00 | 57.70% | 2.83% |
| COP | ConocoPhillips | 49.11 | 80.24 | 63.39% | 4.22% |
| WSM | Williams-Sonoma | 26.18 | 39.45 | 50.69% | 1.88% |
| SBUX | Starbucks | 24.16 | 36.90 | 52.73% | 1.58% |
| CSBK | Clifton Savings | 9.15 | 11.94 | 30.49% | 2.50% |
| VLGEA | Village Super Market | 26.52 | 29.14 | 9.88% | 3.61% |
| RTN | Raytheon Co | 55.56 | 50.80 | -8.57% | 2.62% |
| Average | 45.57% | 2.77% | |||
| Dow Industrials | 10850.36 | 12220.59 | 12.63% | ||
| S&P 500 | 1166.59 | 1313.8 | 12.62% | ||
*All 2010 prices are adjusted to reflect dividends and splits
March 25, 2011 Watch List
Our watch list this week contains 28 companies that are within 11% of their 52-week low.
| Symbol | Name | Price | % Yr Low | P/E | EPS (ttm) | Dividend | Yield | Payout Ratio |
| SJW | SJW Corp. | 22.65 | 1.80% | 17.42 | 1.30 | 0.69 | 3.05% | 53% |
| SYY | Sysco Corp. | 27.86 | 2.69% | 14.36 | 1.94 | 1.04 | 3.73% | 54% |
| WABC | Westamerica BanCorp. | 50.13 | 2.94% | 15.62 | 3.21 | 1.44 | 2.87% | 45% |
| PPL | PP&L Corporation | 24.57 | 3.45% | 11.38 | 2.16 | 1.40 | 5.70% | 65% |
| TGT | Target Corp. | 49.95 | 3.57% | 12.49 | 4.00 | 1.00 | 2.00% | 25% |
| JNJ | Johnson & Johnson | 58.98 | 3.73% | 12.34 | 4.78 | 2.16 | 3.66% | 45% |
| HCBK | Hudson City Bancorp, Inc. | 9.87 | 3.79% | 9.06 | 1.09 | 0.60 | 6.08% | 55% |
| MCY | Mercury General Corp. | 38.83 | 4.13% | 13.97 | 2.78 | 2.40 | 6.18% | 86% |
| CHFC | Chemical Financial Corp. | 19.62 | 4.42% | 22.30 | 0.88 | 0.80 | 4.08% | 91% |
| PEP | PepsiCo Inc. | 63.98 | 6.07% | 16.32 | 3.92 | 1.92 | 3.00% | 49% |
| MRK | Merck & Co., Inc | 32.57 | 6.09% | 116.32 | 0.28 | 1.52 | 4.67% | 543% |
| CWT | California Water Service | 36.1 | 6.77% | 19.94 | 1.81 | 1.23 | 3.41% | 68% |
| HGIC | Harleysville Group Inc. | 32.37 | 6.80% | 13.38 | 2.42 | 1.44 | 4.45% | 60% |
| TRH | Transatlantic Holdings, Inc. | 47.41 | 7.55% | 7.66 | 6.19 | 0.84 | 1.77% | 14% |
| LLY | Eli Lilly & Co. | 34.48 | 7.68% | 7.53 | 4.58 | 1.96 | 5.68% | 43% |
| ABT | Abbott Laboratories | 48.03 | 7.71% | 16.23 | 2.96 | 1.92 | 4.00% | 65% |
| BMI | Badger Meter, Inc. | 39.65 | 8.81% | 20.76 | 1.91 | 0.56 | 1.41% | 29% |
| PRK | Park National Corp. | 64.37 | 8.92% | 14.27 | 4.51 | 3.76 | 5.84% | 83% |
| KMB | Kimberly-Clark Corp. | 65.1 | 9.28% | 14.63 | 4.45 | 2.80 | 4.30% | 63% |
| AWR | American States Water Co. | 34.16 | 9.35% | 19.30 | 1.77 | 1.04 | 3.04% | 59% |
| WMT | Wal-Mart Stores, Inc. | 52.35 | 9.59% | 11.74 | 4.46 | 1.46 | 2.79% | 33% |
| CL | Colgate-Palmolive Co. | 80.15 | 9.61% | 18.60 | 4.31 | 2.32 | 2.89% | 54% |
| AVP | Avon Products, Inc. | 27.43 | 9.72% | 19.73 | 1.39 | 0.92 | 3.35% | 66% |
| VLY | Valley National BanCorp. | 13.55 | 9.89% | 16.73 | 0.81 | 0.72 | 5.31% | 89% |
| NWN | Northwest Natural Gas Co. | 46.07 | 9.95% | 16.88 | 2.73 | 1.74 | 3.78% | 64% |
| BOH | Bank of Hawaii Corp. | 47.25 | 10.04% | 12.43 | 3.80 | 1.80 | 3.81% | 47% |
| WEYS | Weyco Group, Inc. | 24.59 | 10.32% | 21.38 | 1.15 | 0.64 | 2.60% | 56% |
| RLI | RLI Corp. | 56.39 | 10.87% | 9.40 | 6.00 | 1.16 | 2.06% | 19% |
| 28 Companies | ||||||||
Watch List Summary
Top Five Performance Review
| Symbol | Name | 2010 Price | 2011 Price | % change |
| XOM | Exxon Mobil Corp. | 66.54 | 83.62 | 25.67% |
| FPL* | FPL Group, Inc. | 47.81 | 54.10 | 13.16% |
| MON | Monsanto Co. | 71.10 | 70.76 | -0.48% |
| TMP | Tompkins Financial Corp. | 37.75 | 41.34 | 9.51% |
| BRO | Brown & Brown, Inc. | 17.81 | 25.09 | 40.88% |
| Average | 17.75% | |||
| DJI | Dow Jones Industrial | 10,850.36 | 12,220.59 | 12.63% |
| SPX | S&P 500 | 1,166.59 | 1,313.80 | 12.62% |
*FPL is now NEE
Disclaimer
| Symbol | Name | 3/19/2010 | 3/18/2011 | % Change |
| XOM | Exxon Mobil Corp. | $65.36 | $80.85 | 23.70% |
| COSWF.PK | Canadian Oil Sands | $28.55 | $31.58 | 10.61% |
| TOT | Total S.A. | $53.91 | $57.58 | 6.81% |
| CVX | Chevron Corp. | $72.43 | $102.80 | 41.93% |
| PTR | PetroChina Co. | $112.48 | $133.63 | 18.80% |
| COP | ConocoPhillips Co. | $50.40 | $75.35 | 49.50% |
| Average | 25.23% | |||
| Median | 21.25% | |||
| Dow Industrials | 10,741.98 | 11,858.52 | 10.39% | |
| S&P 500 | 1,159.90 | 1,279.21 | 10.29% | |
| Amex Oil Index | 1,075.26 | 1,310.54 | 21.88% | |
Please revisit New Low Observer for edits and revisions to this post. Email us.
| Company | Symbol | 3/19/2010 | 3/18/2011 | Gain/Loss |
| Birner Dental | bdms | $16.24 | $19.62 | 20.81% |
| Warwick Valley Telephone | wwvy | $13.29 | $14.90 | 12.11% |
| Lennox | lii | $42.84 | $50.97 | 18.98% |
| PepsiCo | pep | $64.58 | $63.24 | -2.07% |
| Astro-Med | alot | $7.35 | $7.69 | 4.63% |
| Mead Johnson | mjn | $50.33 | $55.90 | 11.07% |
| Guess? Inc. | ges | $44.23 | $38.27 | -13.48% |
| Air Products | apd | $72.59 | $88.00 | 21.23% |
| Prospect Capital | psec | $10.94 | $11.87 | 8.50% |
| Average | 9.09% | |||
| Median | 11.07% | |||
| Dow Industrials | 10,741.98 | 11,858.52 | 10.39% | |
| S&P 500 | 1,159.90 | 1,279.20 | 10.29% | |
Because this is only a one year review, we believe that there may be no relationship to the short-term outcome versus the long-term expectations. Remember, past performance is no guarantee of future failure.
Theodore Roosevelt said "Do what you can, with what you have, where you are". Here are ways you can help those who are affected by the Earthquake in Japan.
Our watch list this week contains 31 companies that are within 11% of their 52-week low.
March 11, 2011 Watch List
| Symbol | Name | Price | % Yr Low | P/E | EPS (ttm) | Dividend | Yield | Payout Ratio |
| HCBK | Hudson City Bancorp, Inc. | 9.92 | 1.54% | 9.10 | 1.09 | 0.60 | 6.05% | 55% |
| SYY | Sysco Corp. | 27.83 | 2.58% | 14.35 | 1.94 | 1.04 | 3.74% | 54% |
| SHEN | Shenandoah Telecom | 16.01 | 2.89% | 17.59 | 0.91 | 0.33 | 2.06% | 36% |
| BMI | Badger Meter, Inc. | 37.68 | 3.04% | 19.73 | 1.91 | 0.56 | 1.49% | 29% |
| WABC | Westamerica BanCorp. | 50.25 | 3.18% | 15.65 | 3.21 | 1.44 | 2.87% | 45% |
| FCBC | First Community Bancshares | 12.26 | 3.20% | 9.97 | 1.23 | 0.40 | 3.26% | 33% |
| MCY | Mercury General Corp. | 39.31 | 3.72% | 14.14 | 2.78 | 2.40 | 6.11% | 86% |
| CWT | California Water Service | 35.17 | 4.02% | 19.43 | 1.81 | 1.23 | 3.50% | 68% |
| WEYS | Weyco Group, Inc. | 23.21 | 4.13% | 20.18 | 1.15 | 0.64 | 2.76% | 56% |
| SJW | SJW Corp. | 23.34 | 4.90% | 17.95 | 1.30 | 0.69 | 2.96% | 53% |
| CHFC | Chemical Financial Corp. | 19.72 | 4.95% | 22.41 | 0.88 | 0.80 | 4.06% | 91% |
| JNJ | Johnson & Johnson | 59.69 | 4.98% | 12.49 | 4.78 | 2.16 | 3.62% | 45% |
| AWR | American States Water Co. | 32.93 | 5.41% | 22.40 | 1.47 | 1.04 | 3.16% | 71% |
| ATNI | Atlantic Tele-Network, Inc. | 32.09 | 5.49% | 12.30 | 2.61 | 0.88 | 2.74% | 34% |
| PPL | PP&L Corporation | 25.26 | 6.36% | 11.69 | 2.16 | 1.40 | 5.54% | 65% |
| TGT | Target Corp. | 51.53 | 6.84% | 12.88 | 4.00 | 1.00 | 1.94% | 25% |
| PEP | PepsiCo Inc. | 64.65 | 7.18% | 16.49 | 3.92 | 1.92 | 2.97% | 49% |
| HGIC | Harleysville Group Inc. | 32.58 | 7.49% | 13.46 | 2.42 | 1.44 | 4.42% | 60% |
| RBCAA | Republic BanCorp., Inc. | 18.10 | 7.67% | 5.86 | 3.09 | 0.57 | 3.15% | 18% |
| SYBT | S.Y. BanCorp., Inc. | 23.93 | 7.99% | 14.33 | 1.67 | 0.72 | 3.01% | 43% |
| CL | Colgate-Palmolive Co. | 79.18 | 8.29% | 18.37 | 4.31 | 2.32 | 2.93% | 54% |
| AVP | Avon Products, Inc. | 27.16 | 8.64% | 19.54 | 1.39 | 0.92 | 3.39% | 66% |
| ABT | Abbott Laboratories | 48.46 | 8.68% | 16.37 | 2.96 | 1.92 | 3.96% | 65% |
| LLY | Eli Lilly & Co. | 34.86 | 8.87% | 7.61 | 4.58 | 1.96 | 5.62% | 43% |
| RLI | RLI Corp. | 55.47 | 9.06% | 9.25 | 6.00 | 1.16 | 2.09% | 19% |
| KMB | Kimberly-Clark Corp. | 64.65 | 9.15% | 14.53 | 4.45 | 2.80 | 4.33% | 63% |
| TRH | Transatlantic Holdings, Inc. | 48.28 | 9.53% | 7.80 | 6.19 | 0.84 | 1.74% | 14% |
| WMT | Wal-Mart Stores, Inc. | 52.59 | 10.09% | 11.79 | 4.46 | 1.46 | 2.78% | 33% |
| VLY | Valley National BanCorp. | 13.59 | 10.22% | 16.78 | 0.81 | 0.72 | 5.30% | 89% |
| BOH | Bank of Hawaii Corp. | 46.96 | 10.26% | 12.36 | 3.80 | 1.80 | 3.83% | 47% |
| PRK | Park National Corp. | 64.10 | 10.65% | 14.21 | 4.51 | 3.76 | 5.87% | 83% |
| 31 Companies | ||||||||
Watch List Summary
On the top of our list this week is Hudson City Bancorp (HCBK). The stock has been under pressure this week. Current yield of 6% is attractive but with nearly $30B of debt and only $650M of cash on hand, it many not be worth risk/reward.
Sysco (SYY) remains second on our list again. Our guess is that the stock has been hit by the high food costs and the inability to pass such costs on to customers. Two weeks ago shares were trading at 3.73% yield which is slightly lower than where we are. If share revert to "undervalue" range of 2% according to IQTrend, that's a 87% upside from here.
Target (TGT) is another name with a tremendous upside potential gauging by the relative dividend yield establish by IQTrend. Historically, shares are undervalue at 1% yield. With the stock trading nearly 2%, it has the potential to double, all else being equal.
Top Five Performance Review
In our ongoing review of the NLO Dividend Watch List, we have taken the top five stocks on our list from March 12, 2010 and have check their performance one year later. The top five companies on that list can be seen in the table below.
| Symbol | Name | 2010 Price | 2011 Price | % change |
| XOM | Exxon Mobil Corp. | 66.80 | 82.12 | 22.93% |
| AWR | American States Water Co. | 32.50 | 32.93 | 1.32% |
| MON | Monsanto Co. | 72.35 | 67.51 | -6.69% |
| FPL | FPL Group, Inc. | 47.07 | 55.69 | 18.31% |
| CWT | California Water Service | 36.55 | 35.17 | -3.78% |
| Average | 6.42% | |||
| DJI | Dow Jones Industrial | 10,624.69 | 12,044.40 | 13.36% |
| SPX | S&P 500 | 1,149.99 | 1,304.28 | 13.42% |
The performance of our top five stocks lagged the overall market. Exxon (XOM) was a slow starter but once crude price picked up, it carried on the momentum. California Water (CWT) and Monstanto (MON) were the major drag for our top five.
Disclaimer
On our current list, we excluded companies that have no earnings. Stocks that appear on our watch lists are not recommendations to buy. Instead, they are the starting point for doing your research and determining the best company to buy. Ideally, a stock that is purchased from this list is done after a considerable decline in the price and extensive due diligence. We suggest that readers use the March 2009 low (or the companies' most distressed level in the last 2 years) as the downside projection for investing. Our view is to embrace the worse case scenario prior to investing. A minimum of 50% decline or the November 2008 to March 2009 low, whichever is lower, would fit that description. It is important to place these companies on your own watch list so that when the opportunity arises, you can purchase them with a greater margin of safety. It is our expectation that, at the most, only 1/3 of the companies that are part of our list will outperform the market over a one-year period.
| Symbol | Name | Trade | P/E | EPS | Yield | P/B | % from Low |
| CSCO | Cisco Systems, Inc. | $18.40 | 13.92 | $1.32 | 0.00% | 2.25 | 0.93% |
| CEPH | Cephalon, Inc. | $56.17 | 10.66 | $5.27 | 0.00% | 1.66 | 2.13% |
| AMGN | Amgen Inc. | $52.32 | 10.92 | $4.79 | 0.00% | 2.04 | 4.10% |
| TEVA | Teva Pharma. | $50.32 | 13.73 | $3.66 | 1.70% | 2.07 | 7.09% |
| ATVI | Activision Blizzard | $11.27 | 34.15 | $0.33 | 1.50% | 1.30 | 12.81% |
| CELG | Celgene Corp | $54.26 | 28.86 | $1.88 | 0.00% | 4.83 | 12.99% |
| EXPE | Expedia, Inc. | $20.78 | 14.23 | $1.46 | 1.40% | 2.07 | 13.55% |
| MSFT | Microsoft Corp | $25.95 | 11.08 | $2.34 | 2.40% | 4.54 | 14.18% |
| MRVL | Marvell Tech | $16.13 | 12.28 | $1.31 | 0.00% | 2.27 | 16.29% |
| SPLS | Staples, Inc. | $20.43 | 17.78 | $1.15 | 1.70% | 2.25 | 17.08% |
| MICC | Millicom Intl | $89.59 | 5.88 | $15.24 | 2.70% | 3.07 | 18.96% |
All things being equal, the number of shares outstanding affects the reported earnings of a company. Some companies have no debt but they have increased the shares outstanding by a significant amount. Ultimately, a company from 1994 with the same number of shares outstanding, or fewer, is a better value proposition as long as their debt hasn't increased at the same time.
Below is the watch list with the percentage change in the shares and the year the data started from. As you will note, companies like Amgen, Activision and Microsoft have decreased the number of shares outstanding. Provided their debt position hasn't increased in the same time frame, they may be quality investment opportunities.
|
Symbol
|
shares outstanding +/-
|
Since
|
|
21%
|
1994
|
|
|
82%
|
2000
|
|
|
-6%
|
1994
|
|
|
73%
|
2000
|
|
|
-4%
|
2008
|
|
|
387%
|
1994
|
|
|
17%
|
2004
|
|
|
-7%
|
1994
|
|
|
38%
|
2000
|
|
|
53%
|
1994
|
|
|
n/a
|
n/a
|
Watch List Performance Review
| Symbol | Name | 3/5/2010 | 3/4/2011 |
% change
|
| FSLR | First Solar | $108.61 | $146.57 |
34.95%
|
| ERTS | Electronic Arts | $17.12 | $18.79 |
9.75%
|
| GILD | Gilead Sciences | $47.61 | $40.71 |
-14.49%
|
| APOL | Apollo Group | $62.39 | $44.29 |
-29.01%
|
| QCOM | QUALCOMM | $38.76 | $58.15 |
50.03%
|
| ATVI | Activision Blizzard | $11.03 | $11.27 |
2.18%
|
| SRCL | Stericycle | $55.35 | $85.90 |
55.19%
|
| Average |
15.51%
|
|||
| NDX | Nasdaq 100 | 1,888.56 | 2,359.96 |
24.96%
|
| Symbol | Name | Price | % from Low | Yield | Div/Shr | EPS | Est. Ex-date |
| CHFC | Chemical Financial | $19.83 | 5.53% | 3.90% | 0.80 | 0.88 | 3/1/2011 |
| ANAT | American National Insur | $79.63 | 7.40% | 3.80% | 3.08 | 5.37 | 3/1/2011 |
| LUV | Southwest Airlines | $11.71 | 12.38% | 0.20% | 0.02 | 0.61 | 3/1/2011 |
| AROW | Arrow Financial | $24.26 | 13.94% | 4.00% | 1.00 | 1.94 | 3/1/2011 |
| PEP | Pepsico | $63.21 | 4.79% | 3.00% | 1.92 | 3.92 | 3/2/2011 |
| ORI | Old Republic Intl | $12.23 | 7.85% | 5.50% | 0.69 | 0.13 | 3/2/2011 |
| KMB | Kimberly-Clark | $65.47 | 10.63% | 4.30% | 2.80 | 4.45 | 3/2/2011 |
| CCBG | Capital City Bank Group | $12.26 | 13.94% | 3.20% | 0.40 | -0.02 | 3/2/2011 |
| STR | Questar | $17.59 | 18.37% | 3.40% | 0.61 | 1.91 | 3/2/2011 |
| UVSP | Univest Co of Pennsylv | $17.71 | 12.73% | 4.40% | 0.80 | 0.95 | 3/7/2011 |
| WMT | Wal-Mart Stores, Inc | $52.07 | 9.00% | 2.30% | 1.21 | 4.46 | 3/8/2011 |
| NTRS | Northern Trust Co | $51.08 | 12.76% | 2.10% | 1.12 | 2.74 | 3/8/2011 |
| BDX | Becton, Dickinson | $79.20 | 19.15% | 2.00% | 1.64 | 5.55 | 3/8/2011 |
| EXPE | Expedia | $19.69 | 7.61% | 1.40% | 0.28 | 1.46 | 3/9/2011 |
| CBSH | Commerce Bancshares | $39.82 | 13.45% | 2.30% | 0.92 | 2.52 | 3/9/2011 |
| ALL | Allstate Co | $31.44 | 17.05% | 2.70% | 0.84 | 1.71 | 3/9/2011 |
| SYBT | S.Y. Bancorp | $24.17 | 10.62% | 2.90% | 0.72 | 1.67 | 3/10/2011 |
| WEYS | Weyco Group | $24.94 | 11.89% | 2.60% | 0.64 | 1.15 | 3/10/2011 |
| WRE | Washington REIT | $30.56 | 15.58% | 5.70% | 1.74 | 0.55 | 3/10/2011 |
| MRK | Merck | $32.46 | 5.73% | 4.70% | 1.52 | 0.28 | 3/11/2011 |
| FFIN | First Fin'l Bankshares | $50.05 | 14.93% | 2.70% | 1.36 | 2.86 | 3/11/2011 |
| CMA | Comerica Inc St | $38.10 | 15.07% | 1.00% | 0.40 | 0.88 | 3/11/2011 |
| CTBI | Community Trust | $28.52 | 16.41% | 4.20% | 1.22 | 2.16 | 3/11/2011 |
| CBU | Community Bank System | $24.86 | 16.55% | 3.80% | 0.96 | 1.89 | 3/11/2011 |
| HGIC | Harleysville Group | $36.13 | 19.20% | 4.00% | 1.44 | 2.42 | 3/11/2011 |
| VLY | Valley National | $13.44 | 9.00% | 5.30% | 0.72 | 0.81 | 3/13/2011 |
| HI | Hillenbrand | $21.47 | 13.12% | 3.50% | 0.76 | 1.45 | 3/13/2011 |
| SFNC | Simmons First National | $28.38 | 17.37% | 2.70% | 0.76 | 2.15 | 3/13/2011 |
| MCY | Mercury General Co | $38.90 | 2.64% | 5.90% | 2.40 | 2.78 | 3/14/2011 |
| ATVI | Activision Blizzard | $10.95 | 9.61% | 1.50% | 0.17 | 0.33 | 3/14/2011 |
| FNF | Fidelity National Financial | $13.70 | 8.73% | 3.50% | 0.48 | 1.61 | 3/15/2011 |
| TDS | TDS | $32.61 | 13.07% | 1.30% | 0.45 | 1.37 | 3/15/2011 |
| RCI | Rogers Communication | $35.11 | 10.48% | 4.10% | 1.45 | 2.71 | 3/16/2011 |
| VGR | Vector Group Ltd. | $16.54 | 19.16% | 9.40% | 1.60 | 0.73 | 3/16/2011 |
| ECL | Ecolab Inc. | $48.48 | 15.26% | 1.50% | 0.70 | 2.23 | 3/17/2011 |
| SPLS | Staples | $20.86 | 19.54% | 1.70% | 0.36 | 1.15 | 3/21/2011 |
| TLK | P.T. Tel. Indonesia, | $33.88 | 11.70% | 0.60% | 0.19 | 2.52 | 3/22/2011 |
| PNY | Piedmont Natural Gas | $29.24 | 19.35% | 3.80% | 1.12 | 1.96 | 3/22/2011 |
| PEBO | Peoples Bancorp | $13.29 | 19.41% | 2.90% | 0.40 | 0.34 | 3/22/2011 |
| SUBK | Suffolk Bancorp | $20.63 | 0.98% | 2.90% | 0.60 | 1.55 | 3/28/2011 |
| OFC | Corporate Office Prop | $35.50 | 6.51% | 4.70% | 1.65 | 0.43 | 3/29/2011 |
| IBKC | IBERIABANK Co | $56.56 | 17.08% | 2.40% | 1.36 | 1.88 | 3/29/2011 |
| BANF | BancFirst Co | $41.78 | 19.82% | 2.40% | 1.00 | 2.7 | 3/29/2011 |
| IRET | Investors REIT | $9.25 | 16.06% | 7.40% | 0.69 | 0.09 | 3/30/2011 |
February 25, 2011 Watch List
| Symbol | Name | Price | % Yr Low | P/E | EPS (ttm) | Dividend | Yield | Payout Ratio |
| RBCAA | Republic BanCorp., Inc. | 17.21 | 2.44% | 5.57 | 3.09 | 0.57 | 3.31% | 18% |
| SYY | Sysco Corp. | 27.91 | 2.88% | 14.39 | 1.94 | 1.04 | 3.73% | 54% |
| CWT | California Water Service | 35.13 | 3.90% | 18.59 | 1.89 | 1.23 | 3.50% | 65% |
| PPL | PP&L Corporation | 24.81 | 4.46% | 11.43 | 2.17 | 1.40 | 5.64% | 65% |
| MRK | Merck & Co., Inc | 32.19 | 4.85% | 9.41 | 3.42 | 1.52 | 4.72% | 44% |
| JNJ | Johnson & Johnson | 59.64 | 4.89% | 12.48 | 4.78 | 2.16 | 3.62% | 45% |
| HCBK | Hudson City Bancorp, Inc. | 11.38 | 5.37% | 10.44 | 1.09 | 0.60 | 5.27% | 55% |
| PEP | PepsiCo Inc. | 63.6 | 5.44% | 16.22 | 3.92 | 1.92 | 3.02% | 49% |
| WABC | Westamerica BanCorp. | 51.8 | 6.37% | 16.14 | 3.21 | 1.44 | 2.78% | 45% |
| LLY | Eli Lilly & Co. | 34.09 | 6.46% | 7.44 | 4.58 | 1.96 | 5.75% | 43% |
| CL | Colgate-Palmolive Co. | 78.12 | 6.84% | 18.13 | 4.31 | 2.12 | 2.71% | 49% |
| ABT | Abbott Laboratories | 47.64 | 6.84% | 16.09 | 2.96 | 1.92 | 4.03% | 65% |
| MCY | Mercury General Corp. | 40.62 | 7.18% | 14.61 | 2.78 | 2.40 | 5.91% | 86% |
| AWR | American States Water Co. | 33.68 | 7.81% | 22.91 | 1.47 | 1.04 | 3.09% | 71% |
| WMT | Wal-Mart Stores, Inc. | 51.75 | 8.33% | 11.60 | 4.46 | 1.21 | 2.34% | 27% |
| TGT | Target Corp. | 52.36 | 8.56% | 13.71 | 3.82 | 1.00 | 1.91% | 26% |
| FCBC | First Community Bancshares | 12.52 | 8.87% | 10.18 | 1.23 | 0.40 | 3.19% | 33% |
| CAG | ConAgra Foods, Inc. | 23.00 | 9.42% | 15.44 | 1.49 | 0.92 | 4.00% | 62% |
| NWN | Northwest Natural Gas Co. | 46.05 | 9.90% | 16.39 | 2.81 | 1.74 | 3.78% | 62% |
| KMB | Kimberly-Clark Corp. | 65.08 | 9.97% | 14.62 | 4.45 | 2.80 | 4.30% | 63% |
| WEYS | Weyco Group, Inc. | 24.58 | 10.27% | 21.37 | 1.15 | 0.64 | 2.60% | 56% |
| VLY | Valley National BanCorp. | 13.67 | 10.87% | 16.88 | 0.81 | 0.72 | 5.27% | 89% |
| 22 Companies | ||||||||
Watch List Summary
After topping our list two weeks ago, Abbott (ABT) rose 4.5%.
Top Five Performance Review
| Symbol | Name | 2010 Price | 2011 Price | % change |
| THFF | First Financial Corp. | 26.28 | 32.22 | 22.60% |
| XOM | Exxon Mobil Corp. | 65.00 | 85.34 | 31.29% |
| MON | Monsanto Co. | 70.65 | 72.21 | 2.21% |
| CWT | California Water Service | 35.88 | 35.13 | -2.09% |
| SRCE | 1st Source Corp. | 14.93 | 19.4 | 29.94% |
| Average | 16.79% | |||
| DJI | Dow Jones Industrial | 10,325.26 | 12,130.45 | 17.48% |
| SPX | S&P 500 | 1,104.49 | 1,319.88 | 19.50% |
Disclaimer
| Symbol | Name | Price | P/E | EPS | Yield | P/B | % from Low |
| CSCO | Cisco Systems, Inc. | $18.85 | 14.26 | $1.32 | 0 | 2.26 | 1.56% |
| AMGN | Amgen Inc. | $52.24 | 10.91 | $4.79 | 0 | 2.04 | 3.94% |
| CEPH | Cephalon, Inc. | $58.63 | 11.13 | $5.27 | 0 | 1.68 | 6.60% |
| TEVA | Teva Pharma. | $51.89 | 14.16 | $3.66 | 1.70% | 2.13 | 10.43% |
| ATVI | Activision Blizzard, Inc | $11.07 | 33.55 | $0.33 | 1.50% | 1.3 | 10.81% |
| CELG | Celgene Corp. | $53.47 | 28.44 | $1.88 | 0 | 4.79 | 11.35% |
| EXPE | Expedia, Inc. | $20.96 | 14.36 | $1.46 | 1.30% | 2.15 | 14.54% |
| MSFT | Microsoft Corp. | $27.06 | 11.55 | $2.34 | 2.40% | 4.72 | 19.05% |
| MICC | Millicom Intl. Cellular | $90.27 | 5.92 | $15.24 | 2.60% | 3.06 | 19.86% |
Watch List Performance Review
| Symbol | Name | 2010 | 2011 | Change |
| APOL | Apollo Group | $56.92 | $45.82 | -19.50% |
| ERTS | Electronic Arts | $16.75 | $19.28 | 15.10% |
| FSLR | First Solar | $116.00 | $168.22 | 45.02% |
| ATVI | Activision | $10.79 | $11.07 | 2.59% |
| PPDI | Pharma Prod. | $21.20 | $27.97 | 31.93% |
| SRCL | Stericycle | $54.30 | $87.38 | 60.92% |
| GENZ | Genzyme | $55.97 | $75.38 | 34.68% |
| GILD | Gilead | $48.84 | $39.30 | -19.53% |
| Average | 18.90% | |||
| NDX | Nasdaq 100 | 1823.32 | 2392.47 | 31.22% |