Author Archives: NLObserver Team

Something to Ponder About Investing: Case Study of H&R Block (HRB)

We at New Low Observer are constantly challenging our own method of investing. We often ask "how is it possible that a great stock like that can be down/up that big?" To answer that question, we looked at what could be a potential explanation and we turned to our trade on H&R Block (HRB).

Buy Recommendation from the "Pro" in 2008
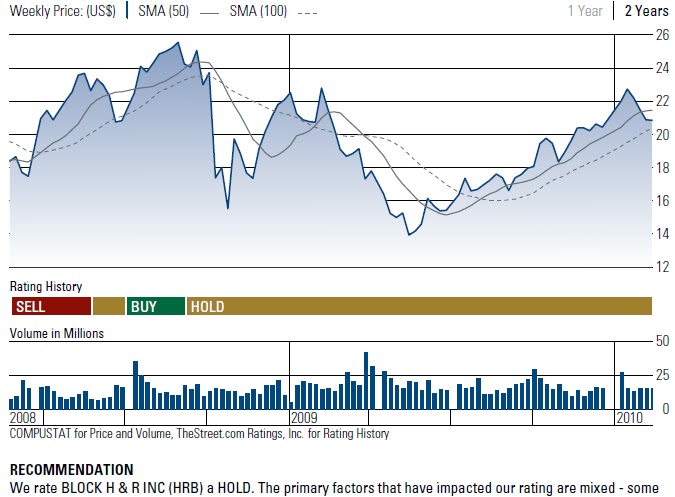
The chart below shows a buy recommendation from TheStreet.com. They upgraded HRB from hold to buy on July 1, 2008 at $21.08. Then TheStreet told investors to hold it on September 5, 2008 at $24.24. At the current price, it would take a 40% rise (from $17.20 to $24.24) to break-even.
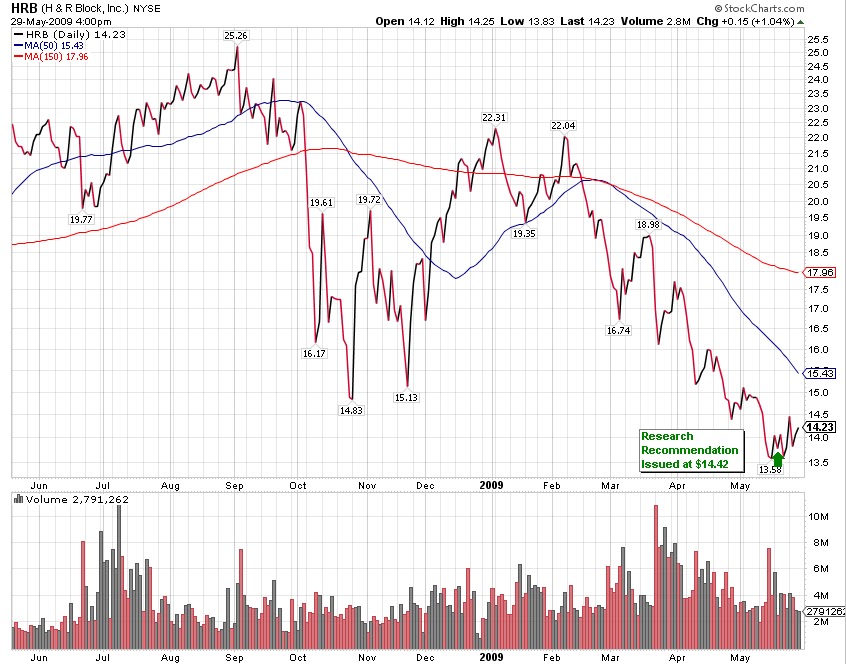
We began our coverage of HRB on May 19, 2009 when the stock was trading at $14.42 or 5% within the 52-week low of $13.73. Please see chart below.
Our article was published on Seeking Alpha which received less than welcomed comments. One reader stated:
"HRB's core business is doing tax preparation. People are moving to doing it via a computer. They are losing core business and been doing so for years. You sure you want to invest in a company losing its core?"
The other came from a former employee. He provided us with great insights:
"As a former employee, I can tell you that this ship has sailed. Every article you read that talks about an upside merely mentions shedding the toxic business, (Business that by the way doubled the profits for a number of years), but fails to mention the drop in repeat clients. If this any other retailer, the first thing you would look at is same store sales YOY and ignore entities that they no longer own. Same store sales are dismal and this year were down close to double digits. This year when they could have been the client's champian with wallets tight, they raised the average fee by nearly 9%. The 5.6% drop in clients includes a 10% increase in digital clients where the profit margin is razor thin.

Every year it is a push to pick up new clients and that is harder than ever. The clients they need to pick up are the thirty-somethings who grew up in the computer age and are very comfortable with a software solution. Good luck because they are also reluctant to pay $300.00 to have their taxes prepared by someone that they are not convinced is smarter than they are.

If you own it, hold it until Breedan sells the company and if you don't, don't."
Based on these comments, one might have considered HRB to be doomed. The stock had nowhere to go but down. But wait...
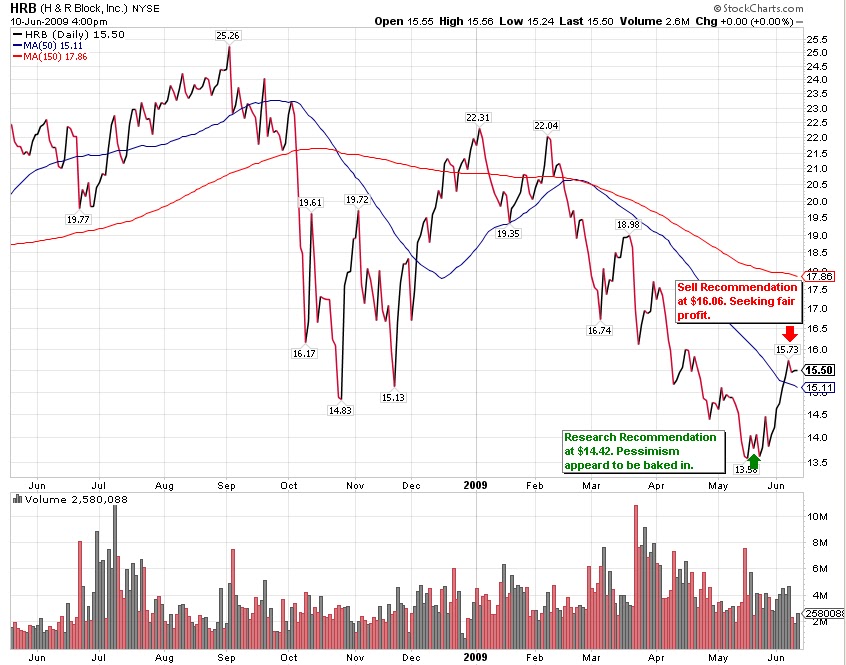
To our surprise, in just 17 days, HRB rose a little over 10% by June 5, 2009. We didn't expect to garner such a large profit in such a short period of time. Because our goal is "seeking fair profits" we had to recommend selling the shares.
Investors should be asking, how can HRB rise 10% during a period with no news and such a negative outlook based on comments above. Ironically, the company came through in Q4 beating the street on June 30, 2009.
The Current Situation
On February 24, 2010, H&R Block (HRB) reported their earnings which sank the stock price by more than 10%. How can this be when a great article was written on HRB on November 3, 2009? HRB shares should be approaching $40, not falling back below $20.
A Key Take Away
The key point here is not to say we are right or others are wrong. We simply felt that it was more luck than anything else that our article was published at or near the stocks' low. But remember our approach starts from the New Low Watch List which could explain a little about our "timing."
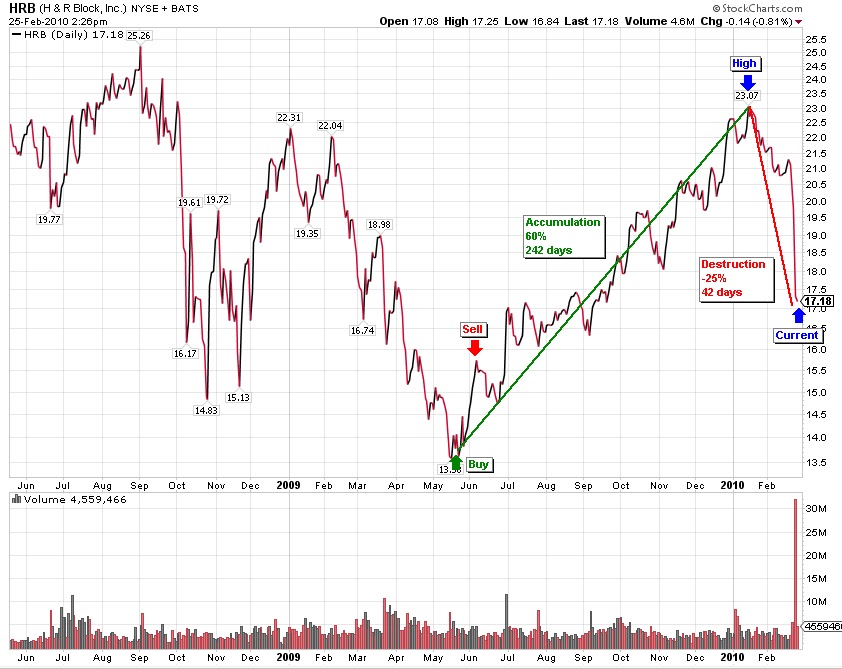
I have annotated the chart below to demonstrate what happened after our initial research recommendation of H&R Block (HRB). It's true that many people said we issued a sell recommendation too soon and missed out on the big upside (60%.) But one does not know that until after the fact. It took 242 days or nearly 8 months to accumulate a gain of 60%. But it only took 42 days or little over one month to wipe out half of that gain.
The current price of $17.20 is still above our sell recommendation. However, investors who are unwilling to accept the reality of gains (selling at higher prices) have to live with the reality of less gains or even losses. We are willing to accept any gain even if it is 16% of the 60% rise.
Going back to our initial question, how is it possible that a great stock like H&R Block (HRB) can be down/up so much? To which we answer, "we don't know." One person cannot justify the price rise or fall. Investors should be focused on the risk/reward of an investment opportunity rather than the reasons why. Of course, we only ignore the reason why with companies that have a proven track record of dividend increases.
During May 2009, the news and outlook for HRB was at its bleakest. However, bad news wouldn't likely move the stock down much further. But a glimmer of hope will shoot the stock up. The opposite occurred in early 2010. All the good news was baked in already. Any good news would no longer boost the price much higher, but a slight change in sentiment will crater the stock.
- Art

Sell Cardinal Health (CAH) at the Market

Since our write-up on Cardinal Health (CAH) on September 29, 2009 the stock has appreciated 23%. Purchasing the stock on 9/30/09 for $26.80 and selling it on 2/23/10 for $33 would yield an annualized return of 57%. This exclude two dividend payments.

Let's review the numbers. The table below shows the previous article's fundamentals compared to today's figures.

Date P/B F P/E P/CF Yield
9/29/2009 1.11 12.00 6.00 2.60%
2/23/2010 2.33 13.81 8.70 2.10%

As you can see, the valuation improved quite a bit given that nothing substantially materialized other than the company raising the profit outlook. Looking at the figures above, you can see that the price-to-book (P/B) ratio has more than doubled. This occurred because of the 2nd quarter results. Because of the recent changes, CAH is no longer the bargain we saw back in September 2009 when it was trading as if they didn't have any intangible assets. Remember, I stated that "given that all CAH competitors (ABC, MCK, and OMI) are trading at more than 2.3x book value, CAH is deeply discounted at 1.1." Now that CAH appears to be fully valued, I have to urge investors to search for safer alternatives.
A 23% profit may not seem like much, however it is a big accomplishment given the stock was held for nearly 5 months. Remember, we are only interested in "seeking fair profits". We at New Low Observer, feel that the risk/reward is no longer in our favor and we would rather take 23% in 147 days.
Investment Observations are intended to be a starting point for investigating a quality company at a reasonable price. It is hoped that after doing the background research, you can buy the stock at a lower price. Ideally the stock should be held in a tax deferred account and should not consist of less than 20% of your holdings. Personally, we prefer holding only 2-3 stocks at a time.

Sell recommendations are intended to deal with the short term reality of the market. The tracking of the Sell recommendations are the worst case scenario if you happen to have bought a stock at the time the Investment Observation was made (please avoid making this mistake.) We aim for mediocrity in our returns, therefore we are happy with 9-12% annual gains. However, since codifying this approach to investing in 2005, we have had annual returns of 20% and above every year since.

It is always recommended that when selling a stock, one should not place stop orders, limit orders or orders after hours. This leaves the seller in the position of being vulnerable to the whims of the market makers. Instead, place your sell orders only as a market order during market hours. Some would complain that a market order during market hours might leave some profits on the table. However, we would rather leave some money on the table rather than have it taken away from us by the trades that are placed by institutions and market makers.

- Art

Dow Theory Q & A

A reader writes:
 
"Without the Obama stimulus and intervention from the FED it would already be below 5000. The existing position is totally artificial, unsustainable and downright ephemeral. Any one that claims that this synthetic bull market is sustainable is full of it.
 
"It is interesting to note how much you can derive from the historical shape of a line with zero analysis of why it was that shape. You have not even quoted a single example of a similar pattern resulting in a similar outcome to your predictions. In other words, this is not a scientific approach. It not even a logical approach. I can only conclude that the sole purpose of such analysis is to influence the market in a desired direction. In other words it is a propaganda approach."
 
Our Response:
 
Manipulation is a factor of the market in the day-to-day movement. However, the long-term trend of the market cannot be manipulated as demonstrated from the writings of William Peter Hamilton, former editor of the Wall Street Journal.
 
Using Dow Theory, Hamilton called the top in the stock market on October 25, 1929 in a WSJ editorial titled “A Turn in the Tide.” It should be noted that the comments on manipulation made by William Peter Hamilton were done when it was well known who and when manipulation took place prior to the institution of the SEC.
 
In his book The Stock Market Barometer, Hamilton outlines many methods of manipulations as they took place and its relevance to the overall market. In his book, Hamilton says of manipulation:
 
  • “The market is always under more or less manipulation.” page 37.
  • “Even with manipulation, embracing not one but several leading stocks, the market is saying the same thing, and is bigger than the manipulation” page 42.
  • “Major Movements Are Unmanipulated-One of the greatest of misconceptions, that which has militated most against the usefulness of the stock market barometer, is the belief that manipulation can falsify stock market movements otherwise authoritative and instructive” page 49.
  • “These discussions [of manipulation] have been made in vain if they have failed to show that all the primary bull markets and every primary bear market have been vindicated, in the course of their development and before their close, by the facts of general business, however much over speculation or over-liquidation may have tended to excess, as they always do, in the last stage of the primary swing” page 50.
  • “It has been shown that, for all practical purposes, manipulation has, and can have, no real effect in the main or primary movement of the stock market, as reflected in the averages. In a primary bull or bear market the actuating forces are above and beyond manipulation. But in the other movements of Dow's theory, a secondary reaction in a bull market or the corresponding secondary rally in a bear market, or in the third movement (the daily fluctuation) which goes on all the time, there is room for manipulation, but only in individual stocks, or in small groups, with a well-recognized leading issue” page 73.
Hamilton, William Peter, The Stock Market Barometer, Wiley & Sons, New York, 1922.
Another great Dow Theorist, Richard Russell, editor of the Dow Theory Letter which has been published consistently since 1958, called the market bottom in October 1974 and called the top in November 2007 (read Barron's article here). The extensive history of reasonably accurate and well-documented calls of market direction make examining Dow Theory worthwhile. The purpose of showing Russell’s remarks on the topic of manipulation is to demonstrate that, although there is a distinct difference between the pre-1934 SEC market of Hamilton era and today, the rules, according to Dow Theory, remain the same.
 
In The Dow Theory Letters, Richard Russell reiterates the fact that:
 
“One of the most difficult concepts to get across to subscribers is the concept of primary trend of the market. This may be old hat to my veteran subscribers of 10 or 20 years, but the whole idea of the primary trend bears repeating now.
 
“There are three trends in the market, all working with each other simultaneously. There is the great primary trend, lasting usually a few years up to 15 years or even longer. There is the secondary trend lasting usually a few months up to a year. And there is the minor or daily trend lasting a few days to a few weeks or so.
 
“The minor trend of the market is open to manipulation. This shortest of trends may reflect a news event, a sudden scare, a sunny word from the president or any of a thousand other possibilities.
 
“The secondary trend often reflects a short-lived expansion or recession that the economy or some very major news event. The secondary trend is also open to manipulation, usually on the part of the Fed in that the Fed can make money tight or loose (the Fed can even bring on a recession by restricting credit or the Fed can see a boom by opening the money spigots wide).
 
“The primary trend is the great tidal trend of the market. When the tide is coming in we term it a bull market. When it is going out we call it a bear market. One of the basic tenets of Dow theory is that the primary trend of the market cannot be manipulated. That’s a point that every investor must understand. The primary trend is more powerful than the power of the Federal Reserve, Congress, and the president combined. When the primary trend of the market turns down (as it did early 1973) stocks will decline until the market discounts the worst that can be seen ahead. When the primary trend turns up (as they did in late 1974) the market will rise until the best that can be seen ahead is fully discounted in the price structure.
 
“But the point I want to get across to subscribers is that once the direction of the primary trend is set, the market will fully express itself in the primary direction. The primary trend may be held back for a while, secondary reactions may interrupt the primary trend, but ultimately the trend will run to conclusion, it will express itself fully.”
 
Russell, Richard, Dow Theory Letters, January 24, 1990, Letter 1035, 2
Keep in mind that Dow theory isn’t a cure all for investment success. As aptly stated by yet another great Dow Theorist Robert Rhea in his book “The Dow Theory," he states:
 
“The Dow theory is not an infallible system for beating the market. Its successful use as an aid in speculation requires serious study, and the summing up of evidence must be impartial. The wish must never be allowed to father the thought.”
 
Rhea, Robert, The Dow Theory, 1932, Barron’s Publishing, 26
Rhea is known for having called the market bottom in 1932 with the publishing of the book The Dow Theory as well as in his newsletter Dow Theory Comment. Despite the clarity in the fact that Dow Theory is not “infallible” the point is made that the use of Dow Theory has the significant value of synthesizing all current and foreseeable economic, political, and social information. Rhea quotes Hamilton with the following thoughts:
 
“The Averages Discount Everything -- The fluctuations of the daily closing prices of the Dow-Jones rail and industrial averages afford a composite of all the hopes, disappointments, and knowledge of everyone who knows anything of financial matters, and for that reason the effects of coming events (excluding acts of God) are always properly anticipated in their movements.”
 
Rhea, Robert, The Dow Theory, 1932, Barron’s Publishing, 19
For the fact that Dow Theory is supposed to include all information, there is little reason for me to speculate on the reasons why and how the market will do what I interpret the averages to be saying. Furthermore, the idea that Dow theory is about a bunch of lines is an unfair assessment at best. Suffice to say, Dow Theory is founded primarily on values then market sentiment and finally explained in a technical fashion (using lines.) Those wishing to understand the value component of the theory can find it throughout the New Low Observer website. However, keep reading for more insight on how value plays a role in your investment strategy.

Dow Theory

Although the markets have been relatively quiet in the last few weeks, according to Dow Theory, the Dow Jones Industrials Average and the Dow Jones Transports Average have been demonstrating classic conditions that would allow us to determine if the market will continue beyond the prior highs set in January or continue lower.
The Dow Jones Industrial Average is the measure by which everyone gauges “the market.” In the chart below, since the January 19th peak of the Industrials, the market declined until the February 8th bottom. After February 8th, the Industrials managed to exceed the rally high of 10,296.84. By exceeding the high of 10,296.84 and the 50% level of 10,368.83, the Industrials have demonstrated a bias towards going higher rather than lower.
For the Dow Jones Transportation Average, the peak of January 11th and the trough of February 8th gave us a decline of 469.97 points or 11.02%. When the index bottomed on February 8th, it was able to exceed the 3993.12 level, which is a classic Dow Theory indication that the index is going back to the old high of 4262.85. Ideally, in the chart below, if the index could stay above the 50% level (red horizontal line) and finally the 3993.12 (blue horizontal line) then we could expect the Transports to go back to the old high and possibly beyond 4262.85.
In order for Dow Theory to work, we need both the Industrials and the Transports to confirm the action of each other. So far, we’ve seen the Industrials confirm the decline started by the Transports on January 11th with a declining pattern on January 19th. After both indexes started trending downwards they both had significant rallies within the downward trend, which peaked at 10,296.84 and 3993.12. Both indexes bottomed on February 8th and moved above the rallying peaks and the 50% ranges within the previous downward trends. All of these confirming moves point to the prospect of a higher market.
The only holdout is that the Industrials went lower today (Feb. 22nd) while the Transports continued higher. From my experience, since the bottom in March 2009, I have noted that the Transports have led the way with the Industrials ultimately confirming the direction. However, this current move down, by the Industrials, while the Transports moved higher has to be taken into consideration. Any non-confirmation could lead to a major change in the trend.
The Industrials now need to stay above either the 10,368.83 or 10,296.84 while at the same time going above 10,402.34 in order to confirm the Transports’ move higher today. Alternatively, if the Industrials break down from here, falling below the 50% and rally peaks, then the Transports should follow in a similar fashion.
It should be noted that the current market action is dancing around my calculations of 10,302 being the 50% level for the Dow Industrials peak of October 2007 and the trough of March 2009 as indicated in my May 2009 posting. It is not surprising that we’re witnessing listless market action at this time. Market participants large and small are deciding if they should capitulate to the trends since March 9, 2009 or get out at a theoretical break-even point. Remember, the 50% level of the previous decline is an approximation of the average price paid by a majority of the current market participants. Is there enough momentum to keep the market going higher? Since March 9, 2009 the Transports have told us the answer to this question. We’ll have to see if this continues to be the case going forward.
-Touc

Nasdaq 100 Watch List

Below are the Nasdaq 100 companies that are within 21% of the 52-week low. This list is strictly for the purpose of researching whether or not the companies have viable business models or are about to go out of business. These companies are deemed highly speculative unless otherwise noted (view all.)

-Touc

Symbol Name Trade P/E EPS Yield P/B % from Low
Apollo Group
56.92
13.70
4.16
N/A
6.56
7.82%
Electronic Arts
16.75
N/A
-2.31
N/A
2.09
13.56%
First Solar
116.00
15.46
7.50
N/A
4.37
14.97%
Activision
10.79
125.47
0.09
1.39%
1.28
16.65%
Pharma Prod.
21.20
15.81
1.34
2.83%
1.87
17.97%
Stericycle
54.30
26.81
2.03
N/A
5.36
18.15%
Genzyme
55.97
31.91
1.75
N/A
1.94
18.86%
Gilead
48.84
17.31
2.82
N/A
6.84
20.24%

A Simple Way to Avoid Losing Money in Stocks

One of the easiest and most sure-fire ways to avoid losing money in stocks is to assume that every investment at some point will lose 50% or more. From this standpoint, all investments will be the most judicious and thoughtful. Transaction will not be entered into lightly.

Throughout my writing on the topic of investing, I have repeatedly stated that I always factor in losing 50% before buying a stock. Some readers have asked me, “Why in the world would you invest in something that you think could decline in value by 50%?” My response is always the same, if you haven’t accounted for the worst-case scenario then you aren’t really investing, instead you’re gambling.

I have found that by accounting for the downside risk of 50%, my mind is capable of assessing market declines with a more objective approach. Additionally, I am able to sleep soundly at night.

Below is a transcription of a BBC News interview of Charlie Munger who addresses the idea of accepting 50% loss in Berkshire Hathaway.

BBC News: How worried are you by the share price decline of Berkshire Hathaway?

Munger: Zero. This is the third time that Warren and I have seen our holdings in Berkshire go down, top tick to bottom tick, by 50%. I think it’s in the nature of long term shareholding with the normal vicissitudes and worldly outcomes and in markets, that the long term holder has his quoted value of his stock go down and then by say 50%. I think you can argue that if you’re not willing to react with equanimity to a market price decline of 50% two or three times a century you’re not fit to be a common shareholder and you deserve the mediocre result you’re going to get, compared to the people who do have the temperament who can be more philosophical about these market fluctuations.

It should be noticed that Munger mentions that he has experienced 3 instances of 50% declines in Berkshire Hathaway in the 42 years of its existence. This means that, on average, a portfolio is going to take a massive hit every 14 years or so. This assumes that you have the investment acumen of Warren Buffett and Charlie Munger. If you don’t have the investment savvy of Buffett and Munger, then the likelihood of losing 50% in your portfolio increases significantly.Now you know how easy it is to adhere to Warren Buffett’s rule number one, “don’t lose money.” After all, if you expect that your investments will lose 50% then you really start losing at 51%. Just be sure that you have the right strategy before you buy.

  • Before entering into a trade or investment, ask yourself if you’re willing to lose 50% or more.

Dividend Achiever Watch List

At the end of the week, my watch list contains 21 companies. Here is my watch list for February 19 , 2010.

Symbol Name Price % Yr Low P/E EPS Div/Shr Yield Payout Ratio
THFF First Financial Corp 26.42 4.30% 15.27 1.73 0.90 3.41% 52%
XOM Exxon Mobil Corp. 65.87 6.48% 16.55 3.98 1.68 2.55% 42%
WEYS Weyco Group, Inc. 22.19 10.34% 22.19 1.00 0.60 2.70% 60%
SRCE 1st Source Corporation 15.38 11.13% 19.47 0.79 0.60 3.90% 76%
SHEN Shenandoah Telecom 17.93 11.37% 28.92 0.62 0.32 1.78% 52%
CWT California Water Service 37.41 11.70% 18.71 2.00 1.19 3.18% 60%
BRO Brown & Brown, Inc. 16.72 11.84% 15.00 1.12 0.31 1.85% 28%
AWR American States Water 33.32 11.96% 20.57 1.62 1.04 3.12% 64%
UMBF UMB Financial Corp 37.88 12.57% 17.22 2.20 0.74 1.95% 34%
WTR Aqua America Inc 17.38 12.93% 22.87 0.76 0.58 3.34% 76%
FPL FPL Group, Inc. 46.88 13.02% 11.81 3.97 2.00 4.27% 50%
WMT Wal-Mart Stores, Inc. 53.49 13.81% 15.49 3.45 1.09 2.04% 32%
RBCAA Republic Bancorp, Inc. 16.59 15.45% 8.21 2.02 0.53 3.19% 26%
WGL WGL Holdings, Inc. 33.14 15.88% 14.73 2.25 1.47 4.44% 65%
MON* Monsanto Co. 77.75 16.79% 27.97 2.78 1.06 1.36% 38%
T AT&T Inc 25.10 17.02% 11.84 2.12 1.68 6.69% 79%
NWN Northwest Natural Gas 44.23 17.08% 15.30 2.89 1.66 3.75% 57%
SYBT S.Y. Bancorp, Inc. 21.47 17.39% 15.45 1.39 0.68 3.17% 49%
NTRS Northern Trust Corp 54.60 19.27% 17.12 3.19 1.12 2.05% 35%
UGI UGI Corp. 25.46 20.46% 11.52 2.21 0.80 3.14% 36%
BCR Bard (C.R.), Inc. 83.44 20.93% 18.14 4.60 0.68 0.81% 15%
21 Companies
*Although Monsanto (MON) isn't a Dividend Achiever, we feel that it has a good potential of becoming one.

The best performer from last week's list is Northern Trust (NTRS) which rose 9.2%. The worse performing stock is Weyco (WEYS) which fell 2.9%. Overall performance of last week's list is a gain of 2.9% - Art

John Maynard Keynes: Investor

Just as Charles H. Dow is the most unsung economist that ever lived, so too is John Maynard Keynes (JMK) the most unheralded speculator to "play" the markets. The following is our research into the investment style of JMK to determine what the thinking might have been behind the theories and strategies that were employed. Most of the investment style that was employed by JMK has been diluted down to the concept of value investing which consists of entering into transactions which investors expect to "buy-and-hold" stocks for the "long term" using "fundamental" analysis derived from the balance sheet of large and small publicly traded companies. Since we all know the mantra and conventional wisdom, we at New Low Observer, will try to take claim for playing the devil's advocate when interpreting what JMK meant when he said, "an investor...should be aiming primarily at long-period results." This exercise may stretch the realm of credulity. However, we believe learning begins where conventional wisdom ends.
As trained economists, we have read much of JMK's theories on money, credit and interest rates. We are also familiar with JMK's involvement in public policy both in the United States and in Britain. In the last 3 years we've had graphic examples of Keynesian economics in attempts to resolve credit crisis after credit crisis. We're aware of the "feuding" philosophies of Keynesians and the Austrian School of economics. However, never in our economic courses in college did we cover the topic of JMK as an investor. Why is this even important to us as investors? One good reason is that Keynes was resolutely known as one of the greatest investors of his time. Considering that if you halved the investment performance of Keynes during the period from 1927-1946 and compared it to the British stock market performance, he still would have beat the market by 600%.
The following is the first of (hopefully) many excerpts from books and journals on the topic of Keynes as an investor.
"More bad news, this time from wall street in late March, brought another slump in health for Maynard, who still had ‘a huge American position’. Lydia took it philosophically: ‘it is quite natural after so much work, change of weather, the world situation, Wall Street and life in general’.
"In the last fortnight in March he sold $40,000 to $50,000 worth of securities, steadily reducing his debt to Buckmaster and Moore, while preserving most of his liquid resources. In the year of ‘terrific decline’ which had started in the spring of 1937 he lost nearly two-thirds of his money. His net assets fell from $506,222 at the end of 1936 to $181,244 by the end of 1938, with his gross income cut by two-thirds, from $18,801 in 1937-8 to $6,192 in 1938-9.
"The institutions who’s investment policy he largely dictated- his College, the Provincial Insurance Company, the National Mutual- had also suffered heavy losses, and Keynes was driven to justifying his philosophy of ‘hanging on for a rise’ in lengthy letters and memoranda. To Francis Curzon, who chaired the weekly meetings of the board of the National Mutual in his absence, he wrote on 18 March: ‘I feel no shame at being found still owning a share when the bottom of the market comes…I would go much further than that. I should say that it is from time to time the duty of a serious investor to accept the depreciation of his holdings with equanimity and without reproaching himself. Any other policy is anti-social, destructive of confidence, and incompatible with the working of the economic system. An investor,..should be aiming primarily at long-period results, and should be solely judged by these.’ Curzon and the board were not convinced, and Keynes resigned his chairmanship in October 1938, explaining to Falk, ‘One naturally chooses [to give up] that part of one’s activities which one finds least satisfaction.’"
Skidelsky, Robert, John Maynard Keynes:Fighting for Freedom 1937-1946, Viking Press, 2000, 15
In reading this piece, I am fascinated by the fact that Keynes had lost 66% of the value of his assets in the bear market of 1937-1938. To lose so much, when the British stock market fell by -0.5% in 1937 and -16.1% in 1938, seems extreme. Mind you, this was Keynes' personal investment account, in the investment fund that he managed for King's College, the cumulative loss for the same period was -31.6%. It was said that Keynes was more aggressive with his own accounts than with the accounts of others that he managed at the same time. What is challenging for me to accept in this regard is that, if the losses were 66% then it would take a 300% increase in order to break even. With a loss of 31.6%, it would take a gain of 46.2% to break even. While the 46% gain seems plausible, the 300% gain seems extraordinary and something that is highly unlikely, in a reasonably short period of time.
The conventional wisdom dictates that portfolios with smaller concentration are likelier to have abnormal fluctionation in both good and bad markets. In Keynes' personal account, the decline of 66% percent possibly indicated that he held relatively narrow holdings (undiversified.) The same could be said for the funds that he managed for the university. Another possible explanation for the wide disparity in the losses in the period mentioned could lie in the selection of companies. A portfolio full of speculative, less than "investment grade" companies are prone to larger declines as the market trends lower. Finally, another explanation probably lies in the attribute that was not unusual for Keynes' investment style and that was with the use of large amounts of leverage. This explains why Keynes had to reduce his debt with Buckmaster and Moore.

I suspect that when Keynes said, "An investor,..should be aiming primarily at long-period results," what he meant was that the soundness of an investment approach should be judged based on the results over a long period of time and not based on short term losses or gains. By this I mean that Keynes might not necessarily intended for investments to be held for extended periods of time, basically forever as most people seem to think today. As proof of this possibility, we reference the following material:

"By the 1930s, though, Keynes had learned some existential lessons, for example, that it takes 'abnormal foresight' and 'super human skill' to buy and sell at the correct time. It is better to choose a small group of carefully selected securities (which Keynes refers to as 'pets') with the idea of holding them 'through thick and thin', perhaps for several years till they have fulfilled their promise or proven to be a mistake. On other occasions he recognized 'time and opportunity' did not allow one to have adequate knowledge of more that[n] a very limited number of investments, that 'continuous and anxious work on the telephone' (not half an hour in bed) is 'none too good for health', and that one is liable to lose one's 'sense of proportion' when he is
absorbed in market quotations."

Mini, Piero V., John Maynard Keynes, St. Martin's Press, 1994, 89

Let me re-emphasize that JMK was specific in that stocks should be held for "several years till they have fulfilled their promise or proven to be a mistake." In this context we can see that it is possible that Keynes never intended to hold a stock for an indeterminable period of time down the road. It is quite possible that Keynes literally meant that after 3 or 4 years, if they performed as expected, the stock should be sold and new ventures should be pursued.

This loose interpretation of JMK's thinking would fly in the face of most investors who say that they are invested for the long term only to find that the stocks they hold are "duds." To compound the bad decision of buy-and-hold for the long term, investors cannot justify selling a stock that they previously felt that they would hold forever. Finally, when the investor does end up selling the stock, far earlier than expected, they are forced to deal with the conflict of their investment strategy and its implementation. As an alternative, most investors tend to say to themselves, "I'm just going to invest in quality companies and forget about it until my retirement." This approach seems to be the preferred method for coping with a failed strategy.

Again, it is my view that JMK intended that the investment strategy or philosophy that is employed should be judged on it's long term performance. This is opposed to the idea that stocks individually should be held for a long period of time. I believe that new investors, as well as experienced investors, should have as a primary goal the appropriate selection of an investment strategy. Because we have an extended history of investment stategies and philosophies, we as investors should be selecting and testing those that have performed best in both bull and bear markets. This may explain why Warren Buffett selected JMK's philosophy and applied it to the Graham and Dodd method for selecting individual stocks. In the case of Mr. Buffett, it was his early adoption of the Keynes method which sets his investment performance apart from the rest.

-Touc

  • A stock should be held for several years or unless it has proven to be a failed venture

Wal-Mart To Report Tomorrow

Wal-Mart Stores (WMT) is set to report earnings tomorrow. What I will be paying attention to is not so much the earnings but the possible dividend announcement. Wal-Mart is a veteran when it comes to rewarding shareholders with dividends. They have been paying and increasing their dividends for roughly 35 years. Over the past 10 years, the compound annual growth rate of the dividend has been 18.5%! Over the same period, WMT's share price has not performed in a similar fashion, thus value has been building up. This may be the reason why Warren Buffett has been increasing his stake in the company.
Through the deepest and darkest hour of our economy, Wal-Mart managed to raise the dividend by 8% in 2008 and 15% in 2009. Given this track record, I would estimate that at least a 10% rise in dividend payment is likely. Click here for historical dividend and stock splits.
Would I be buying it now? It depends. The shares of WMT are not extremely expensive but since it ran up from the $50 range when I wrote about it in September 2009, I would suggest a pull back to that range before buying. If you are excited about this company and wish to buy right now, then I suggest you divide your buying in two parts. Buy the first portion now and wait for a 20% decline to buy the second half.
The key point is that quality companies that pay and increase dividends consistently tend to become great investments when they appear on our watch list. Not all companies are to be bought but our list is a great starting point for any conservative investor or aggressive trader. - Art

Q & A

Question:

Based on your February 12th article, what's the point of recommending dividend growth stocks if you're just going to recommend selling them once they appreciate by 10%?
In the case of MATW, you're recommending it at a higher price than where you previously recommended selling it. If you just would've held on to it, your position would be worth more and you wouldn't have interrupted your dividend stream.

Answer:

Companies that have a history of dividend increases transmit far more than just the ability to compound income. The purpose of recommending Dividend Achievers is because we believe that companies with a continuous history of dividend increases proves that they are “quality” companies. What is left for us to determine is at what price are we going to acquire quality companies.
As aptly stated by the great Dow Theorist Richard Russell, “Let's say you are compounding your assets (reinvesting your dividends and interest) beautifully until a full-fledged primary bear market comes along (1973-74 and again in 2008). Within a year or two your assets are cut in half, and all your compounding has gone to waste.” (Dow Theory Letters. July 24, 2009. Daily Commentaries. Paragraph 3.) Richard Russell makes this commentary despite his most famous article on the concept of compounding titled “Rich Man, Poor Man: The Power of Compounding.” For this reason, the possibility of compounding a stock’s income is only a last resort if we happen to be wrong about the direction of the stock price after the purchase has been made. Again, we only want to be wrong with “quality” companies since holding on for the long-term is all the more easier with a steady growing dividend.
In the case of MATW, the yield on the stock leaves a lot to be desired in terms of compounding at just 0.90%. In addition, knowing that the historical annual return on stocks, adjusted for inflation, has not exceeded 10% in any 30-year period means that 10% or more in four months should be acknowledged as an exceptional return. Because we don’t ascribe to the mantra of diversification (see our article “Diversification: It Really Doesn’t Matter”), our investments tend to be concentrated enough to justify the transactional costs that we’d incur to get in and out of a stock.
On our website, we clearly point out that only stocks with a designation of “Investment Observation” are companies that we feel strongly about the prospects. The reiteration of Matthews Corp. (MATW) was for the purpose of alerting interested parties to put the company through their own research regiment as the price declines.
For our August 4, 2009 sell recommendation of MATW, we indicated that, “selling this stock now also generates a return 11 times greater than the amount of the dividend yield if the stock was held for a whole year.” We consider the fact that your return on investment should demonstrate the capacity to exceed what would be received if held for a full year. We also compare the performance of the stock against what would have been received if the same funds were held in 30-year Treasuries or guaranteed investment vehicles.
Although our approach is for the purpose of trading stocks, we don’t take the idea lightly. In the description of our site we state clearly, “this website is intended to give new insights on a low risk approach to trading in dividend paying stocks for tax deferred accounts with the ability to buy and sell individual stocks. This website is not intended for regular or non-qualifying accounts however, the strategies and stocks mentioned can be used for non-qualifying accounts with the understanding of the consequences of potential short-term capital gains as well as the need for exceptional documentation for IRS purposes.”

I hope this give a little more insight about our approach. Thanks again for a great question.

-Touc

Upcoming Ex-Dividend Dates for Dividend Achiever Watch List

Below are the approximate ex-dividend dates for companies that appeared on our Dividend Achiever watchlist dated February 12, 2010. If you happen to be researching these companies for potential investment it would be advisable to consider the ex-dividend date prior to possible purchases. Owning the shares of the company that you're interested in before the ex-dividend date entitles you to the upcoming dividend payment. Owning the shares on or after the ex-dividend date means that you would have to wait at least three months before receipt of the next payment.

Please verify the ex-dividend date and payout ratio before committing funds to these stocks. Additionally, do not base your next long or short term purchase on the dividend payment or yield. Instead, get as much research in as you possibly can before the ex-dividend date "just in case." - Art

Name Symbol % from
Yr Low
Approx.Ex-
Dividend Date
MGE Energy Inc. MGEE 20.21% 2/25/2010
MARTIN MARIETTA MLM 16.36% 2/25/2010
UMB Financial Corp. UMBF 12.51% 3/9/2010
N J RESOURCES CP NJR 17.90% 3/11/2010
U G I CP UGI 16.46% 3/11/2010
Republic Bancorp, Inc. RBCAA 8.14% 3/17/2010
MONSANTO CO. MON 13.90% 4/7/2010

Nasdaq 100 Watch List

Below are the Nasdaq 100 companies that are within 21% of the 52-week low. This list is strictly for the purpose of researching whether or not the companies have viable business models or are about to go out of business. These companies are deemed highly speculative unless otherwise noted.

Symbol Name Trade P/E EPS (ttm) Yield P/B % from Low
Electronic Arts
16.06
N/A
-4.06
N/A
1.97
8.88%
Apollo Grp
59.22
14.25
4.16
N/A
6.23
12.18%
First Solar
115.10
15.34
7.50
N/A
3.94
14.07%
Stericycle
51.36
25.36
2.03
N/A
5.17
15.18%
Gilead Sci.
47.01
16.66
2.82
N/A
6.47
15.73%
Genzyme Corp.
55.73
31.77
1.75
N/A
1.93
18.35%
QUALCOMM
38.84
31.17
1.25
1.80%
2.98
19.00%
Pharma Product
21.65
13.70
1.58
2.80%
1.92
20.48%
Activision
11.11
45.35
0.25
1.40%
1.24
20.63%
Video game makers Electronic Arts (ERTS) and Activision (ATVI) seemed to be in a race to the bottom until ATVI announced that its earnings beat expectations and that they are going to pay a dividend for the first time. On the news, ATVI moved higher while ERTS continues to languish within 9% of a new low. However, the fact that ERTS is so low and isn't promoting "positive" news makes the company more attractive.
Pharamceutical Product Development (PPDI) is again edging back on to our new low list. As you'll note on my 2009 transaction overview, PPDI was one of my most successful ventures from the Nasdaq 100 Watch List. Although not yet a Dividend Achiever, the company has increased the dividend every year for 4 years in a row. The company has solid financials and carries no debt.
Apollo Group (APOL) has remained on the Watch List for 4 months now. Provided that APOL doesn't fall below the November lows, this company may be worth investigating. With return on assets around 25% and return on equity at around 50% it would be difficult to ignore this special situation. However, my primary concern would be on the issues of long-term debt and quality of reported earnings.
As a group, Genzyme (GENZ), Stericycle (SRCL), Gilead (GILD), and PPDI are all companies that I would invest in, to varying degrees. The healthcare sector, as well as the water utilities on the Dividend Achiever Watch List are demonstrating their relative undervaluation against the overall market.

-Touc

3 Stocks Back on the Dividend Achiever Watch List

There are three stocks that I wish to bring to your attention that are on our Dividend Achiver Watch List. The most important element of these three stocks is that they were individually recommended by our team in the past and are now worth re-examining at this time to verify their respective merits.
First on our list is Matthews International (MATW). Matthews International was initially recommended on March 31, 2009 near the lows of the bear market. At the time, according to Dow Theory, we felt that the company had upside targets of $31, $40, and $49. On August 4, 2009, we issued a sell recommendation of (MATW) when it was trading at $31.95. Subsequently, (MATW) was able to get within $0.50 of the $40 target. After hitting the $39 range, (MATW) has fallen to the current level of $32.50. (MATW) has increased the dividend for 14 consecutive years in a row.
According to Value Line, (MATW) has a book value of $14.32. If we assume the lowest quarterly earnings during the worst of the economic crisis from Q4 2007 to Q1 2009 and project those earnings (the most conservative estimate) into the future, we get a Q1 2011 P/E ratio of 16.92. Value Line also considers (MATW) at fair valuation around $41.86 or 13 times cash flow per share. Using the most optimistic scenario according to Dow Theory, (MATW) is considered fairly valued at $35.77.
The next company of interest on the Dividend Achiever Watch List is AquaAmerica (WTR). For what it is worth, our team recommended (WTR) at one of the lowest points in 2009 on October 31, 2009. Our December 16, 2009 sell recommendation achieved a gain of 10% in 46 days. After hitting the high of $17.89, (WTR) has fallen to the current level of $16.59.
According to Value Line, (WTR) is considered at fair valuation when it trades at $19.30. If we take the worst period of earnings during the market decline from Q4 2007 to Q1 2009 and project those earnings into the future, AquaAmerica would have a P/E ratio of 37.70. Again, we're seeking the worst case scenario in our future projections. This allows us to better assess the risks we are about to take. As long as WTR can stay above the $14 low of 2008, the fair value should be around $18.70.
Finally, the stock with the most potential among the three is Northwestern Natural Gas (NWN). NWN was recommended on October 3, 2009 when the stock was trading a $40.94. At the time the recommendation was made the stock was at a relative low and proceeded to move higher. In the research that I did on (NWN) I found that since 1970, the stock has typically bottomed in the first four months of the year 72% of the time. Additionally, NWN has bottomed in the month of February eleven of the last 39 years or 28% of the time. This makes the decline from December at the price of $46 all the more interesting. We issued a sell recommendation of NWN on December 21, 2009 when the stock was selling around $45.25.
According to Value Line, NWN is considered to be fairly valued at $36.66. This implies that (NWN) has further to fall. However, with the consistency of hitting bottom in the first quarter of the year, especially in February, NWN is worthy of consideration at these levels. Suffice to say, I am most tempted by NWN and will continue to follow this stock for ideal entry points.
-Touc

Dividend Achiever Watch List

At the end of the week, my watch list contains 27 companies. Here is my watch list for February 12 , 2010.

Symbol Name Price % Yr Low P/E EPS Div/Shr Yield Payout Ratio
THFF First Financial Cor 26.49 4.58% 14.48 1.83 0.90 3.40% 49%
XOM EXXON MOBIL CP 64.80 4.75% 16.28 3.98 1.68 2.59% 42%
CWT CALIFORNIA WATER 35.92 7.26% 17.96 2.00 1.19 3.31% 60%
AWR AMER ST WATER 32.05 7.69% 19.82 1.62 1.04 3.24% 64%
WTR AQUA AMERICA INC 16.59 7.80% 21.83 0.76 0.58 3.50% 76%
RBCAA Republic Bancorp, Inc. 15.54 8.14% 7.69 2.02 0.53 3.41% 26%
SRCE 1st Source Corp. 15.09 9.03% 19.10 0.79 0.60 3.98% 76%
NTRS Northern Trust Corp. 50.01 9.24% 15.68 3.19 1.12 2.24% 35%
FPL F P L GROUP INC 45.57 9.86% 11.48 3.97 1.89 4.15% 48%
WGL WGL HOLDINGS INC 31.75 11.05% 14.12 2.25 1.47 4.63% 65%
SHEN Shenandoah Telecom 17.98 11.68% 29.00 0.62 0.32 1.78% 52%
NWN NORTHWEST NAT GAS 42.15 11.77% 14.59 2.89 1.66 3.94% 57%
SYBT S.Y. Bancorp, Inc. 20.56 12.41% 14.79 1.39 0.68 3.31% 49%
UMBF UMB Financial Corp. 37.86 12.51% 17.21 2.20 0.74 1.95% 34%
WEYS Weyco Group, Inc. 22.82 13.48% 22.82 1.00 0.60 2.63% 60%
TMP TOMPKINS FINANCIAL 36.44 13.70% 13.55 2.69 1.36 3.73% 51%
WMT WAL MART STORES 52.90 13.81% 15.33 3.45 1.09 2.06% 32%
MON* MONSANTO COMPANY 75.82 13.90% 27.27 2.78 1.06 1.40% 38%
MLM MARTIN MARIETTA 78.25 16.36% 29.75 2.63 1.60 2.04% 61%
UGI U G I CP 24.62 16.46% 11.14 2.21 0.80 3.25% 36%
T AT&T INC. 25.07 16.93% 11.83 2.12 1.68 6.70% 79%
NJR N J RESOURCES CP 35.31 17.90% 55.00 0.64 1.36 3.85% 212%
BCR BARD C R INC 81.97 18.90% 17.82 4.60 0.68 0.83% 15%
PNY PIEDMONT NAT GAS CO 24.63 19.10% 14.73 1.67 1.08 4.38% 65%
MATW Matthews International 32.50 19.88% 16.58 1.96 0.28 0.86% 14%
MGEE MGE Energy Inc. 32.78 20.21% 15.46 2.12 1.47 4.48% 69%
SJW S J W CP 22.01 20.80% 24.46 0.90 0.68 3.09% 76%
27 Companies
*Although Monsanto (MON) isn't a Dividend Achiever, we feel that it has a good potential of becoming one.


New addition to this week's list is Matthews International (MATW).

Market Note
Berkshire B was added to the S&P 500 today thus attracting an unusual amount of volume. For more, click here. - Art

2009 Transaction Overview

After transaction costs, the total return in the portfolio for 2009 was 36%. The dividend yield received on the account was 5.26%, with the dividend accounting for 16.14% of the total change in the account value. I am open to questions about the rational for selecting a particular stock at a given time during 2009.

As you will notice, my best investment for 2009 was Helmerich & Payne (HP) with a 16% gain using 49% of the portfolio. The worst investment was American National Insurance (ANAT) which lost 22% with 23% of the portfolio. The best gain from the Nasdaq 100 Watch List was Pharmaceutical Products (PPDI) with a gain of 9.78% using 26.71% of the portfolio. Three trades Hythiam (HYTM), Evotec (EVTC) and YRCW(YRCW) were pure speculations with minor portions of the portfolio. The losses of HYTM and EVTC were easily offset by the gains of YRCW. As I've said many times before, gold and silver stocks act as perpetual options on the price of the precious metal. My postions in Agnico-Eagle Mines (AEM) and Hecla Mining (HL) were attempts to participate in the run-up in the metals. Each of the transaction with HL and AEM were completed within a month.

Symbol Close Date % Gain/Loss % of Portfolio
AEM 2/4/2009 4.51% 20.28%
HL 2/5/2009 -23.78% 4.55%
ANAT 2/23/2009 -22.57% 23.61%
SYY 2/23/2009 -6.69% 30.33%
HP 3/26/2009 16.06% 49.00%
MO 6/5/2009 13.22% 48.33%
VIVO 6/12/2009 13.71% 49.64%
CAH 7/30/2009 8.53% 27.32%
PPDI 8/5/2009 9.78% 26.71%
EVTC 9/16/2009 -5.90% 1.60%
HYTM 9/23/2009 -42.31% 0.53%
YRCW 9/24/2009 37.27% 1.37%
MO 10/9/2009 -2.10% 55.40%
BOH 10/23/2009 8.60% 50.13%
CEPH 11/2/2009 0.23% 26.70%
WTR 12/11/2009 5.31% 21.07%
NWN 12/11/2009 5.91% 27.25%
CAH 12/30/2009 0.93% 25.61%
My investment style is in no way an endorsement of the way to invest your money. All recommendations on which stocks to consider buying are listed as Investment Observations. I'm glad to hear your thoughts, questions and comments.
-Touc