Author Archives: nlo-admin

Dow Theory: 1910-1913

image

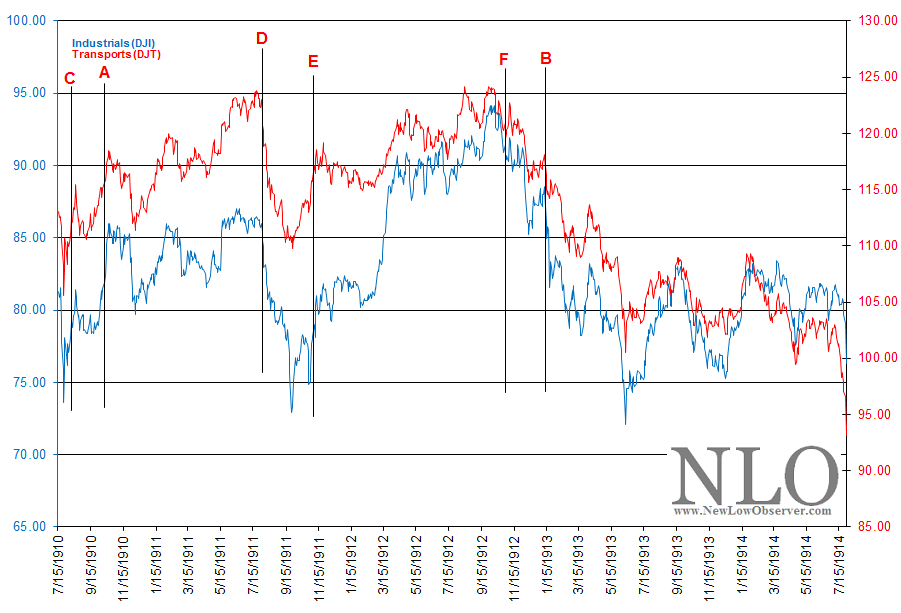
Bull market indication (A): According to the Edwards and Magee book Technical Analysis of Stock Trends, the Dow Theory bull market began on October 10, 1910 when the Dow Industrials and Transports exceeded the August 17, 1910 resistance levels of 81.41 and 115.47, respectively.  The NLO team believes that the bull market began at point (C) when the Dow Jones Industrial Average and Transportation Average exceeded the July 22, 1910 resistance levels of 77.78 and 110.51, respectively.  From the point (C) of the bull signal to the respective market tops, the DJI gained +10.61% and the DJT gained +11.98%.

We also believe that after a bear market signal was issued at point (D) on August 2, 1911, a new bull market indication was issued at point (E), on November 6, 1911, when the Dow Jones Industrial Average closed at 79, above the previous resistance level of 78.34 established on October 16,1911.  The Transportation Index had already gone above the previous resistance level of 114.13 set on October 20, 1911 by closing at 114.46 on October 31, 1911. From the point (E) of the bull signal to the respective market tops, the DJI gained +19.13% and the DJT gained +6.01%.

Bear market indication (B): According to Edwards and Magee, the bear market began on January 14, 1913.  At the time, the Dow Jones Industrial Average was at 84.96 while the Transportation Average was at 115.01. Edwards and McGee never indicated that in between October 10, 1910 and January 14, 1913 there are any other bull and bear signals according to Dow Theory.

However, in our view, as we mentioned above, we believe that a bear market indication was given on August 2, 1911 point (D) when the DJI and DJT were at 84.80 and 120.71, respectively.   The Industrials and Transports fell -13.98% and -9.03% from the August 2, 1911 levels.

After getting a second bull market indication at point (E), a second bear market indication was triggered on November 4, 1912 point (F) when the Dow Jones Industrial Average declined below 90.38 on September 11, 1912.  The Transportation Average had already given the bearish indication on October 25, 1912 by falling below 120.44.  From point (F) to the June 11, 1913 low, the Dow Jones Industrial Average declined –20.21% while the Dow Jones Transportation Average declined –16.55%.

Canadian Dividend Watch List: July 25, 2012

This is a list of Canadian dividend stocks that currently, or in the past, had a history of consecutive dividend increases. For those wishing to find the most complete fundamental information on these companies, we recommend visiting one of Canada’s leading financial websites, the Financial Post (found here). However, Yahoo!Finance probably has the better long-term charts and historical dividend data.

Symbol Name Price P/E EPS Yield Price/Book % from low
IAG.TO Industrial Alliance Insurance and Financial Services 20.74 18.52 1.13 4.60% 0.81 0.92%
PWF.TO Power Financial Corporation 24.2 9.49 2.53 5.80% 1.47 2.46%
IGM.TO IGM Financial Inc. 39.28 11.39 3.45 5.60% 2.26 2.91%
SJR-B.TO Shaw Communications, Inc. 19.58 13.05 1.52 5.00% 2.5 3.43%
TCL-A.TO Transcontinental Inc. 9.42 0 -1.48 6.20% 0.74 3.86%
CCA.TO Cogeco Cable Inc. 35.99 7.06 5.05 2.80% 1.64 4.47%
FFH.TO Fairfax Financial Holdings 376.57 33.21 0 2.70% 0 4.60%
EMP-A.TO Empire Company Limited 55.97 11.22 4.99 1.70% 1.13 4.71%
AGF-B.TO AGF Management Limited 11.29 11.88 1.02 9.60% 0.91 4.73%
GS.TO Gluskin Sheff + Associates, Inc. 13.9 10.22 1.27 4.70% 5.38 5.54%
POW.TO Power Corporation of Canada 22.21 9.1 2.42 5.20% 1.12 6.27%
BNS.TO The Bank Of Nova Scotia 50.61 11.25 4.51 4.30% 1.91 6.46%
CWB.TO Canadian Western Bank 25.78 11.36 2.19 2.50% 1.74 7.42%
CNQ.TO Canadian Natural Resources Limited 27.5 9.96 2.75 1.50% 1.3 7.51%
TRI.TO Thomson Reuters Corporation 28.34 0 -1.61 4.60% 1.42 8.58%
GWO.TO Great-West Lifeco Inc. 20.84 9.6 2.15 5.90% 1.64 8.83%

Watch List Summary

On our list this week is Industrial Alliance Insurance and Financial Services, Inc. (IAG.TO).  Yahoo!Finance indicates that IAG is a provider of  “…life and health insurance company, engages in the provision of various insurance products, savings and retirement plans, and other financial products and services in the United States and Canada.”

According to Dow Theory, IAG has the following downside targets:

  • $20.04
  • $16.90
  • $13.75

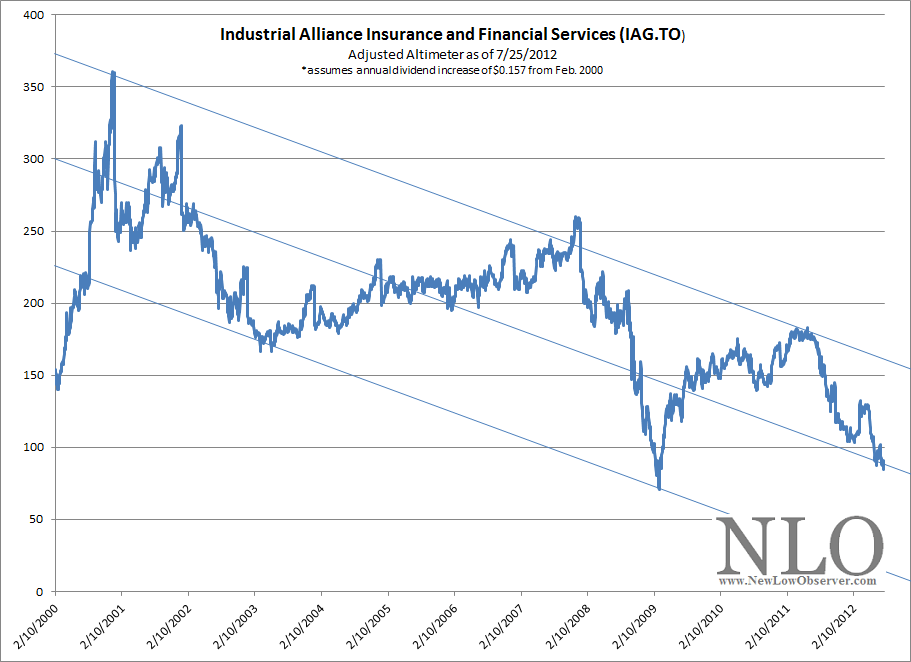
We also ran Edson Gould’s Altimeter on IAG and found that the dividend of the last few years distorted the indicator.  To adequately adjust for the distortions, we provided IAG with an annual dividend increase of $0.0157 from February 2000 to the present annual dividend of $0.98.  Using this adjustment provided us with the following downside targets:

  • $17.15
  • $12.25
  • $7.35

image

Our view is that $16.90 and below are appropriate levels to start acquiring IAG.  Even at the current price, the dividend of 4.60% allows for a slight downside cushion provided it is understood that the stock must be held for 1 year.

NUGT: A “buy” signal eminent

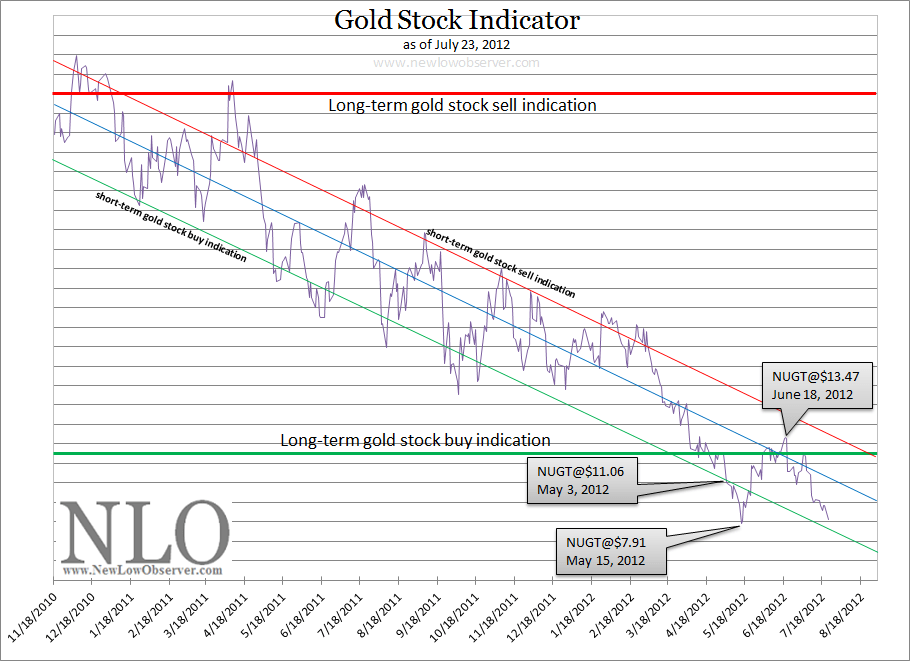
For those willing to speculate with a portion of their funds based on the movement of gold stocks, the Direxion Daily Gold Miners Bull 3X Shares (NUGT) is about to signal a short & long-term buy indication.  We believe this indication will be registered be when NUGT declines below $7.60.  The $7.60 figure seems approximate, however, may change based on market conditions.  Your best confirmation of what we think is an appropriate level to buy NUGT should be based on our Transaction Alert.

image

As we’ve indicated before, we believe that a decline of –30% or more would not be unexpected for NUGT before achieving the average gain of +20% from the initial “buy” signal.  Our strategy for this next indication is to set aside 1/3 of the amount for the initial signal to buy.  If NUGT declines by an additional -15% then we’d buy more shares of NUGT with the remaining 2/3 of available funds set aside.  An example of how this would play out with $3,000 set aside for this speculation from May 3, 2012 for a 20% rise above the initial “buy” signal is as follows:

  • buy $1,000 (1/3) at $11.06 sell and at 20% gain ($13.27)
  • buy $2,000 (2/3) at $9.40 or below then sell at $13.27
  • the average cost would be $9.90
  • a total gain of +34% would be possible if sold at $13.27, or 20% above the initial entry price.

Our purchase of the Direxion Daily Gold Miners Bull 3X Shares (NUGT) is strictly a speculation which we will sell soon after it has achieved our target amount.  Direxion’s DUST and NUGT ETFs are strictly for speculators (short-term) and should not be entered into for investment (long-term) purposes.

U.S. Dividend Watch List: July 20, 2012

Below are the 13 companies on our U.S. Dividend Watch List that are within 11% of their respective 52-week lows. Stocks that appear on our watch lists are not recommendations to buy. Instead, they are the starting point for doing your research and determining the best company to buy. Ideally, a stock that is purchased from this list is done after a considerable decline in the price and rigorous due diligence.

Symbol Name Price % Yr Low P/E EPS (ttm) Dividend Yield Payout Ratio
MATW Matthews International Corp.  28.96 2.15% 12.12 2.39 0.36 1.24% 15%
EXPD Expeditors International  37.05 2.43% 21.42 1.73 0.56 1.51% 32%
CHRW C.H. Robinson Worldwide  56.96 2.91% 21.25 2.68 1.32 2.32% 49%
UNM Unum Group 18.95 3.16% 24.93 0.76 0.52 2.74% 68%
FNFG First Niagara Financial Group  7.555 3.35% 12.59 0.6 0.32 4.24% 53%
JCI Johnson Controls Inc  25.28 4.08% 10.45 2.42 0.72 2.85% 30%
BDX Becton, Dickinson and Co. 74.79 7.47% 13.62 5.49 1.80 2.41% 33%
ANAT American National Insurance 71.09 8.19% 10.00 7.11 3.08 4.33% 43%
AMAT Applied Materials Inc. 10.51 8.35% 10.41 1.01 0.37 3.52% 37%
CAG ConAgra Foods, Inc. 24.13 8.69% 21.54 1.12 0.96 3.98% 86%
HRL Hormel Foods Corp. 28.3 9.39% 16.26 1.74 0.60 2.12% 34%
ABM ABM Industries, Inc. 18.99 9.83% 15.19 1.25 0.58 3.05% 46%
COP ConocoPhillips 55.99 10.61% 6.11 9.16 2.64 4.72% 29%
13 Companies              

Matthews International (MATW) reported earning that fell short of analysts’ expectation by $0.08 or roughly 10%.  In addition to the weak earning, they company guided next year’s earning in the range of $2.34 to $2.40, shy of the consensus expectation of $2.54.  As a result, the stock fell 8.4% on Friday and closed just 2.15% above the 52-week low.  Technical level of $28.50 will be an important level for the stock to hold.  Valueline estimated that the stock typically trades around 13x cash flow.  Currently, it is trading at 8.5x cash flow which tells us the stock is heavily undervalued.  Although dividend yield of 1.24% isn’t anything to brag about, it is extremely safe when the company pays out 15% of their earning.

Johnson Controls (JCI) took a hit this week as the company also reported earning that wasn’t at par with the street.  Analysts got to work right away and revised their price target for the stock. Deutsche Bank downgraded its rating on Johnson Controls from buy to hold, and lowered its price target from $35 (from April) to $32 (26% above current price).  Jefferies & Company reiterated its hold rating but lowered its price target from $28 to $26 (below current price).  UBS kept their rating at neutral and lowered the price target from $28 to $27.  Overall, the street appears to have mixed bag of opinion which range from $26 to $35.  Our proprietary model suggests a fair value of $31, a buy at $24, and a possible downside to $17 being the ultimate bargain bin.

We wanted to highlight the amazing performance of Walgreen (WAG) which rose 13% for the week after coming to term with Express Script.  Anyone lucky enough to scoop up the stock below $30 would have locked in a dividend yield of 3.6%!

Top Five Performance Review

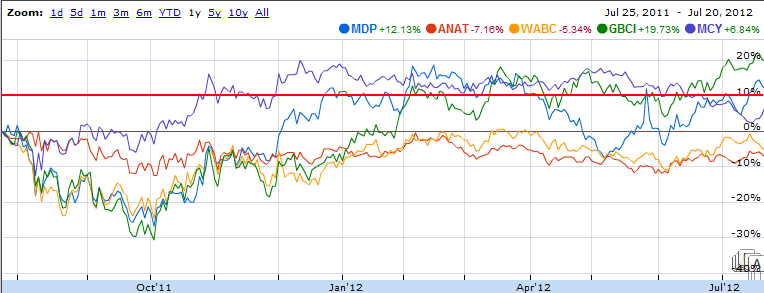
In our ongoing review of the NLO Dividend Watch List, we have taken the top five stocks on our list from July 22,  2011 and have check their performance one year later. The top five companies on that list can be seen in the table below.

Symbol Name 2011 Price 2012 Price % change
MDP Meredith Corp. 29.36 32.92 12.13%
ANAT American National Insurance 76.58 71.09 -7.17%
WABC Westamerica BanCorp.  48.57 45.97 -5.35%
MCY Mercury General Corp. 38.70 41.35 6.85%
GBCI Glacier BanCorp., Inc.  13.12 15.71 19.74%
      Average 5.24%
         
DJI Dow Jones Industrial 12,681.16 12,822.57 1.12%
SPX S&P 500 1,345.02 1,362.66 1.31%

NLO_2012.7.20

Our top five stocks outperformed the market by 4%.  Three out of five companies had a +10% gains within one year.

U.S. Dividend Watch List: July 13, 2012

Below are the 15 companies on our U.S. Dividend Watch List that are within 11% of their respective 52-week lows. Stocks that appear on our watch lists are not recommendations to buy. Instead, they are the starting point for doing your research and determining the best company to buy. Ideally, a stock that is purchased from this list is done after a considerable decline in the price and rigorous due diligence.

Symbol Name Price % Yr Low P/E EPS (ttm) Dividend Yield Payout Ratio
FNFG First Niagara Financial Group  7.61 4.04% 12.68 0.6 0.32 4.20% 53%
EXPD Expeditors International 37.67 4.15% 21.77 1.73 0.56 1.49% 32%
ABM ABM Industries, Inc. 18.19 5.21% 14.55 1.25 0.58 3.19% 46%
UNM Unum Group 19.42 5.72% 25.55 0.76 0.42 2.16% 55%
BDX Becton, Dickinson and Co. 74.42 6.94% 13.56 5.49 1.80 2.42% 33%
WAG Walgreen Co. 30.58 7.19% 10.51 2.91 1.10 3.60% 38%
AMAT Applied Materials Inc. 10.48 8.04% 10.38 1.01 0.36 3.44% 36%
PBI Pitney Bowes Inc  13.9 8.51% 4.06 3.42 1.50 10.79% 44%
COP ConocoPhillips 54.98 8.61% 6.00 9.16 2.64 4.80% 29%
CRR Carbo Ceramics, Inc. 77.8 8.72% 13.82 5.63 0.96 1.23% 17%
CHRW C.H. Robinson Worldwide  60.3 8.94% 22.50 2.68 1.32 2.19% 49%
UTX United Technologies Corp. 73.59 10.05% 15.49 4.75 2.14 2.91% 45%
ANAT American National Insurance 72.34 10.09% 10.17 7.11 3.08 4.26% 43%
APD Air Products & Chemicals 79.84 10.49% 14.39 5.55 2.56 3.21% 46%
BMS Bemis Co Inc 30.15 10.80% 17.95 1.68 1.00 3.32% 60%
15 Companies

New additions to our master database and appearing on our dividend list this week is Applied Materials (AMAT). SEMICON West was held in San Francisco this last week which set the stage for earnings release by companies in the semiconductor industry. Many semiconductor companies are going into the second half of the year more cautious than last year. Chip companies typically start ramping up for the Holiday season at about this time, however, the macro view is uncertain. This leads many companies to push back on their orders. Such push back causes the earnings to be very cyclical for equipment makers such as Applied Materials. Strong balance sheets as well as high dividend yields provide a good opportunity to do research on these firms. Readers may remember that we owned AMAT last year and have taken profits. Another entry point is near and we are getting bullish on AMAT.

A New York based bank, First Niagara Financial (FNFG), topped our list this week after falling -2% during the week.  While the yield of 4.18% and payout ratio of 53% appears to be a sure thing, a quick glance at the balance sheet tells a different story.  The company has $430M in cash and $11B in total debt.  If the economy continued to falter and the market falls further, the bank would likely have to raise capital.  The valuation appears attractive but anyone attempting to purchase the stock should view this as a speculation.

Walgreen (WAG) closed above $30 for the first time in weeks.  We have written commentary on Walgreen on June 21st and nothing material has changed s0 we urge readers to visit that post for our bullish view on the stock.

Top Five Performance Review

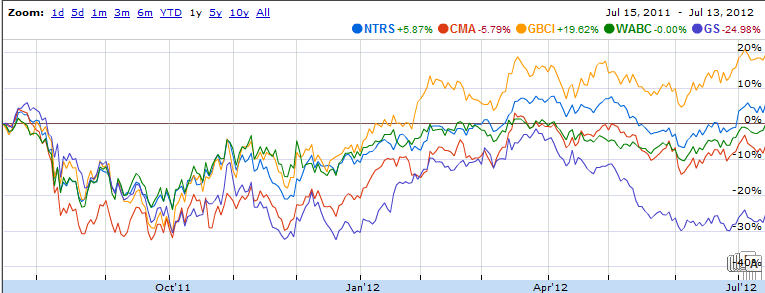
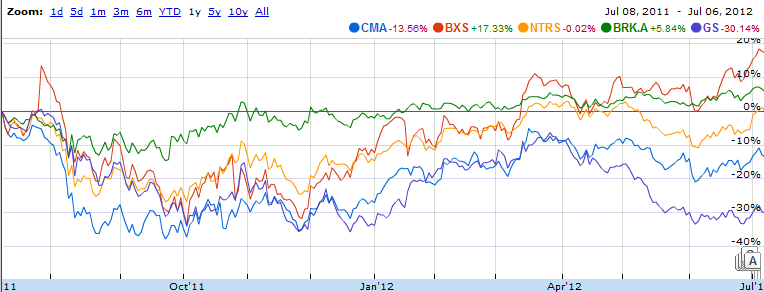
In our ongoing review of the NLO Dividend Watch List, we have taken the top five stocks on our list from July 8,  2011 and have check their performance one year later. The top five companies on that list can be seen in the table below.

Symbol Name 2011 Price 2012 Price % change
NTRS Northern Trust Corp.  44.29 47.05 6.23%
CMA Comerica, Inc. 32.59 30.69 -5.83%
GBCI Glacier BanCorp., Inc.  12.89 15.61 21.10%
GS Goldman Sachs Group, Inc.  130.16 97.43 -25.15%
WABC Westamerica BanCorp.  48 48.22 0.56%
Average -0.62%
DJI Dow Jones Industrial 12,479.73 12,777.09 2.38%
SPX S&P 500 1,316.14 1,356.78 3.09%

NLO_2012.7.13

Our top five stocks underperformed the market by roughly 2-3%.  Only Glacier BanCorp (GBCI) reached our goal of +10% gains within one year.

NUGT: Where to Now?

After posting our Gold Stock Indicator article on April 4th (found here) and suggesting that a low would be achieved between April 4th and June 7th, the actual low was hit on May 15th. This was well within the indicated date range that a major low would be achieved.

The run-up from the low was on April 15th and generated gains of +67%. Additionally, from when the short-term buy indication was first hit on May 3, 2012, the gain was +21%. We weren't savvy enough to get all of the gains from the indicated low, however, the Gold Stock Indicator appears to be hitting its marks with ease.

At the current pace, our Gold Stock Indicator has a tentative downside target for NUGT of $6.00 before it crosses simultaneously below both the long-term and short-term buy indications, as seen in the chart below. The estimated time-frame for this downside target is approximately 1 and 1/2 months from now.

image

We expect that the conservative gain of +21% should be expected from NUGT once it first crosses below the short-term buy indication line. Significant downside movement would still remain as was the case after the May 3rd crossing below the short-term buy indication. The amount of decline after the May 3rd indication was -28%, however, the subsequent gains of +21% was achieved in 35 calendar days while the bottom on May 15th achieved gains of 67% in exactly 30 calendar days.

As a caveat, in the same April 4th article, we indicated that “our worst case scenario for a bottom in gold stocks is the period between June 15, 2012 and August 21, 2012.”  Presently, it appears that we are on course to achieve such a worse case situation based on the reversal of the rising trend of the Gold Stock Indicator. Our definition of worse case means a gold price of $1,200 to $1,300 and a NUGT price of $4 or less.

U.S. Dividend Watch List: July 6, 2012

Below are the 15 companies on our U.S. Dividend Watch List that are within 11% of their respective 52-week lows. Stocks that appear on our watch lists are not recommendations to buy. Instead, they are the starting point for doing your research and determining the best company to buy. Ideally, a stock that is purchased from this list is done after a considerable decline in the price and rigorous due diligence.

Symbol Name Price % Yr Low P/E EPS (ttm) Dividend Yield Payout Ratio
FNFG First Niagara Financial Group  7.66 2.96% 12.77 0.6 0.32 4.18% 53%
WAG Walgreen Co. 29.62 3.82% 10.18 2.91 1.10 3.71% 38%
EXPD Expeditors International  38.28 4.25% 22.13 1.73 0.56 1.46% 32%
UNM Unum Group 19.2 4.52% 25.26 0.76 0.42 2.19% 55%
CRR Carbo Ceramics, Inc. 75.29 5.21% 13.37 5.63 0.96 1.28% 17%
ANAT American National Insurance 69.66 6.01% 9.80 7.11 3.08 4.42% 43%
PG Procter & Gamble Co.  61.28 6.46% 18.80 3.26 2.25 3.67% 69%
BDX Becton, Dickinson and Co. 75.14 7.98% 13.69 5.49 1.80 2.40% 33%
COP ConocoPhillips 54.75 8.16% 5.98 9.16 2.64 4.82% 29%
CHRW C.H. Robinson Worldwide  60.51 9.32% 22.58 2.68 1.32 2.18% 49%
MCD McDonald's Corp.  89.66 9.33% 16.76 5.35 2.80 3.12% 52%
BMO Bank of Montreal 56.03 9.97% 9.88 5.67 2.76 4.93% 49%
APD Air Products & Chemicals 79.82 10.46% 14.36 5.56 2.56 3.21% 46%
ABM ABM Industries, Inc. 19.11 10.53% 15.29 1.25 0.58 3.04% 46%
UTX United Technologies Corp. 74.09 10.80% 15.60 4.75 2.14 2.89% 45%
15 Companies

A New York based bank, First Niagara Financial (FNFG), topped our list this week after falling -2% during the week.  While the yield of 4.18% and payout ratio of 53% appears to be a sure thing, a quick glance at the balance sheet tells a different story.  The company has $430M in cash and $11B in total debt.  If the economy continued to falter and the market falls further, the bank would likely have to raise capital.  The valuation appears attractive but anyone attempting to purchase the stock should view this as a speculation.

Walgreen (WAG) continued to struggle below the $30 mark.  We have written commentary on Walgreen on June 21 and nothing material has changed thus we urge reader to visit that post for our bullish view on the stock.

Top Five Performance Review

In our ongoing review of the NLO Dividend Watch List, we have taken the top five stocks on our list from July 8,  2011 and have check their performance one year later. The top five companies on that list can be seen in the table below.

Symbol Name 2011 Price 2012 Price % change
CMA Comerica, Inc. 33.79 30.59 -9.47%
NTRS Northern Trust Corp.  45.87 46.49 1.35%
BXS BanCorp.South Inc. 12.01 14.75 22.81%
GS Goldman Sachs Group, Inc.  134.08 95.47 -28.80%
BRK-A Berkshire Hathaway Inc. CL 'A' 115,050 123,897.57 7.69%
Average -1.28%
DJI Dow Jones Industrial 13,074.75 12,772.47 -2.31%
SPX S&P 500 1,343.80 1,354.68 0.81%

NLO_2012.7.6

Our top five stocks underperformed the market by roughly 1%.  Only BanCorp (BXS) reached our goal of +10% gains within one year.

Insurance Watch List: July 3, 2012

The following is one of our personal favorite watch lists. We started tracking the insurance industry in January 2011 and we’re very impressed with the results so far.

Anyone who wishes to be successful in insurance stocks should read the book The Davis Dynasty by John Rothchild. The book starts with Shelby Collum Davis investing approximately $50,000 to $100,000 that ultimately grew to $900 million after 47 years. The strategies employed by Davis seem more accessible to average investors as opposed to Warren Buffett’s leveraged strategies and education from Benjamin Graham.

Symbol Name Price P/E EPS Yield P/B % from low div/share payout ratio
MIG Meadowbrook Insurance 8.75 12.24 0.72 2.3 0.76 5.80% $0.20 27.78%
UNM Unum Group 19.58 25.76 0.76 2.2 0.68 6.59% $0.42 55.26%
WSH Willis Group Holdings 36.8 16.45 2.24 2.9 2.39 11.38% $1.08 48.21%
ORI Old Republic International 8.17 0 -0.5 8.7 0.55 14.27% $0.71 -142.00%
TWGP Tower Group Inc. 21.63 15.83 1.37 3.6 0.78 14.44% $0.75 54.74%
MFC Manulife Financial Corp 11.28 78.88 0.14 4.8 0.86 14.87% $0.52 371.43%
PRU Prudential Financial, Inc. 49 11.81 4.15 3 0.65 15.43% $1.45 34.94%
AIZ Assurant Inc. 35.61 5.94 5.99 2.4 0.61 16.18% $0.84 14.02%
FFG FBL Financial Group Inc. 29.17 39.8 0.73 1.4 0.7 19.06% $0.40 54.79%
XL XL Group plc 21.17 0 -0.23 2.1 0.68 19.67% $0.44 -191.30%

Watch List Summary

The first company on our watch list is Meadowbrook Insurance (MIG).  According to Yahoo!Finance, “…Meadowbrook Insurance Group, Inc., through its subsidiaries, operates as a specialty commercial insurance underwriter and insurance administration services company in the United States.”

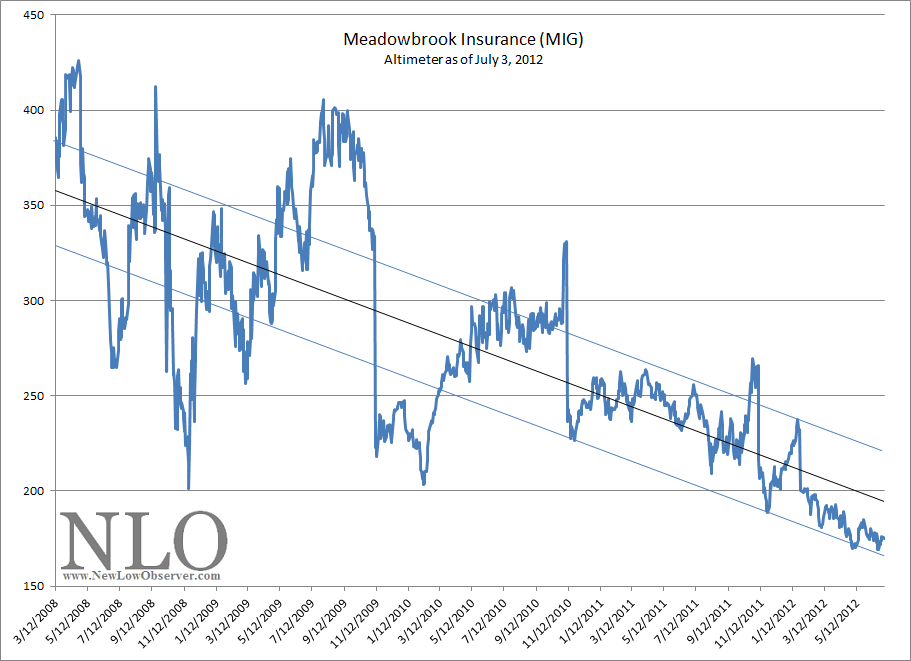
Meadowbrook has had a checkered dividend history.  However, since the reintroduction of the dividend in 2008, Meadowbrook has displayed a declining Altimeter with consistent buy and sell indications.  Below is the Altimeter since March 12, 2008:

image

Again, even though the Altimeter is in a declining trend the more important feature is the consistency of the decline.  Below is the buy and sell indications using this approach:

Date Close altimeter buy/sell % change
4/29/2008 7.45 373 sell -17.18%
6/20/2008 6.17 309 buy 20.58%
9/4/2008 7.44 372 sell -29.44%
10/9/2008 5.25 263 buy 32.76%
1/21/2009 6.97 349 sell -15.49%
2/13/2009 5.89 295 buy 16.30%
5/6/2009 6.85 343 sell -2.34%
11/10/2009 6.69 223 buy 34.38%
6/15/2010 8.99 300 sell 0.67%
11/23/2010 9.05 226 buy 9.94%
10/21/2011 9.95 249 sell -4.62%
11/23/2011 9.49 190 buy 21.92%
1/18/2012 11.57 231 sell -28.26%
estimate 8.3 166 buy 24.70%
estimate 10.35 207 sell  

From the table above we can see that all “buy” indications resulted in an average gain of +22.65%.  The average decline based on sell signals was not as consistent in helping investors avoid major losses as in the case of May 6, 2009 and June 15, 2010.  So far, it appears that if Meadowbrook declines to $8.30 and below it is considered a “buy.”   Based on the declining trend of the Altimeter, the next sell price would be at $10.35 and above.  This would result in a gain of +24.70% if acquired at the $8.30 price.

Meadowbrook has displayed a consistently growing book value since 2008.  Value Line Investment Survey indicates that Meadowbrook (MIG) has a 5-year growth rate of book value at 10.5%.  Although MIG has increased the book value nearly 100% since 2003, the shares outstanding has grown by approximately 80% in the same period of time.   With long-term debt at relatively low levels, Meadowbrook appears to be a reasonable purchase as long as the stock does not exceed 10% of portfolio value.  We are also drawn to MIG’s low payout ratio which allows for some wiggle room in case earnings decline.

Those interested in Unum Group (UNM) will find our view on the company at the following link.  We believe that UNM is a strong buy at $15.54 and below.

The next stock on our list is Willis Holdings Group Plc (WSH).  According to Yahoo!Finance, Willis Group Holdings is “…provides a range of insurance brokerage, reinsurance, and risk management consulting services to its clients worldwide.”

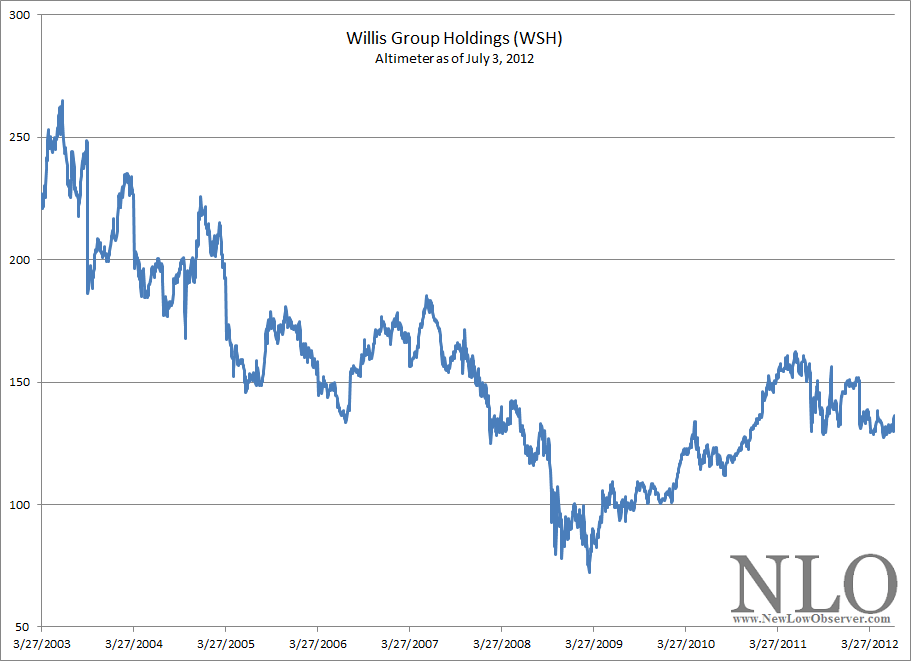
Below is the Altimeter for WSH:

image

Initially, there is very little to make of the movements in the Altimeter for Willis Group Holdings.  For this reason, we’ve applied Dow Theory to the 2009 low to the 2011 high.  According to Dow Theory, the downside targets, based on the Altimeter, are:

  • $35.64
  • $31.59 (fair value)
  • $27.54
  • $19.44

Willis Group Holdings’ ability to stay above the $35.64 would be very constructive.  However, at the current trading price of $37.64, we wouldn’t be surprised to see the stock decline to the $31.59 level before re-testing the $36.90 level.  According to Morningstar.com, Willis Group Holdings has had a steady dividend payment with reasonable increases in the last few years.  We would consider acquiring WSH at levels below $31.59.

Gold Stock Indicator Update

Our Gold Stock Indicator, as seen below, is going on an interesting ride.

image

On May 27, 2012 (found here), we did an appraisal of the gold situation and said the following:

“…in all instances of an initial ‘short-term buy indication’ [green arrow] (except August 8, 2011), the Gold Stock Indicator was followed by a second opportunity to buy [red arrow] NUGT, sometimes at lower levels.”

In the chart above, we show a red arrow between May 3rd and June 28th.  It is important to take note of the fact that even though the Gold Stock Indicator is currently at the exact same level as on May 3rd, the price of NUGT is more than $1.00 below the May price.

So far, it appears that NUGT is on course to provide us with the second opportunity to take a position, as we have anticipated.  In prior moves from the short-term buy indication to the short-term sell indication, the Gold Stock Indicator has “double dipped.”  By double-dip we mean that the price of NUGT has declined the short-term buy indication a second time before making an assault on the long-term sell indication.

Our only question at this time is how far must NUGT fall before it reaches the short-term buy level.  If the most recent comparison between May 3rd and June 28th is any indication, then it is possible that NUGT could decline as low as $6.

U.S. Dividend Watch List: June 21, 2012

Below are the 34 companies on our U.S. Dividend Watch List that are within 11% of their respective 52-week lows. Stocks that appear on our watch lists are not recommendations to buy. Instead, they are the starting point for doing your research and determining the best company to buy. Ideally, a stock that is purchased from this list is done after a considerable decline in the price and rigorous due diligence.

Symbol Name Price % Yr Low P/E EPS (ttm) Dividend Yield Payout Ratio
UNM Unum Group 19.17 1.05% 25.22 0.76 0.42 2.19% 55%
WAG Walgreen Co. 29.15 2.17% 10.02 2.91 1.10 3.77% 38%
CHRW C.H. Robinson Worldwide  57.83 3.49% 21.58 2.68 1.32 2.28% 49%
PG Procter & Gamble Co.  59.75 3.80% 18.33 3.26 2.25 3.77% 69%
COP ConocoPhillips 52.76 4.23% 5.76 9.16 2.64 5.00% 29%
EXPD Expeditors Int'l 38.67 4.63% 22.35 1.73 0.56 1.45% 32%
BMO Bank of Montreal 53.37 4.75% 9.46 5.64 2.75 5.15% 49%
CRR Carbo Ceramics, Inc. 75.7 5.79% 13.45 5.63 0.96 1.27% 17%
BDX Becton, Dickinson 73.73 5.95% 13.43 5.49 1.80 2.44% 33%
TR Tootsie Roll Industries 22.93 6.01% 30.57 0.75 0.32 1.40% 43%
CWT California Water Service 17.7 6.31% 20.58 0.86 0.63 3.56% 73%
NFG National Fuel Gas Co. 44.29 6.54% 17.44 2.54 1.46 3.30% 57%
NJR N.J. Resources 42.5 7.32% 14.21 2.99 1.52 3.58% 51%
TDS TDS 20.61 7.34% 10.79 1.91 0.49 2.38% 26%
MCD McDonald's Corp.  87.64 7.52% 16.38 5.35 2.80 3.19% 52%
APD Air Products & Chemicals 77.86 7.75% 14.00 5.56 2.56 3.29% 46%
THFF First Financial Corp. 28.12 7.95% 10.34 2.72 0.94 3.34% 35%
MUR Murphy Oil Corp. 43.65 8.02% 9.49 4.6 1.10 2.52% 24%
ANAT American Nat'l Insurance 71.1 8.20% 10.00 7.11 3.08 4.33% 43%
MATW Matthews Int'l  30.94 8.30% 12.95 2.39 0.36 1.16% 15%
TMP Tompkins Financial Corp. 36.44 9.20% 11.75 3.1 1.44 3.95% 46%
SRCE 1st Source Corp.  21.21 9.56% 10.61 2 0.64 3.02% 32%
AROW Arrow Financial Corp.  23.57 9.63% 12.60 1.87 1.00 4.24% 53%
MSEX Middlesex Water 18.21 10.30% 23.05 0.79 0.74 4.06% 94%
CTWS Connecticut Water  27.33 10.38% 21.86 1.25 0.95 3.48% 76%
PPL PP&L Corporation 27.63 10.52% 9.76 2.83 1.44 5.21% 51%
WEYS Weyco Group, Inc.  23.02 10.57% 16.21 1.42 0.68 2.95% 48%
SJW SJW Corp. 23.09 10.64% 20.25 1.14 0.71 3.07% 62%
CAH Cardinal Health, Inc.  41.54 10.68% 14.08 2.95 0.95 2.29% 32%
MGRC McGrath RentCorp.  23.92 10.69% 11.96 2 0.94 3.93% 47%
EGN Energen Corp. 41.2 10.69% 13.38 3.08 0.56 1.36% 18%
LM Legg Mason, Inc.  24.77 10.78% 16.08 1.54 0.44 1.78% 29%
ERIE Erie Indemnity  69.37 10.78% 23.44 2.96 2.21 3.19% 75%
HNZ HJ Heinz Co. 53.41 10.88% 18.74 2.85 2.06 3.86% 72%
34 Companies

Topping our list is Unum Group (UNM) which provides disability, life, and financial protection benefits.  The stock is trading at a 33% discount to its book value.  Our Altimeter study of UNM shows that the stock, while not at its low, UNM is approaching an ideal buy point.  The model shows that $15.54 or below is the best purchase price.

Walgreen (WAG) reported earning along with news that it will be acquiring 45% stake in the U.K.’s largest drugstore-chain, Alliance Boots.  While the weakness in the Euro zone had all the analysts in panic mode, we believe this an amazing deal for Walgreen.  Boots broad exposure in different countries will help diversify the revenue stream for Walgreen.  The company raised its 2013 earnings outlook as a result of the integration.  For all the critic of Walgreen buying a European company at the time that there is upheaval, this is precisely the moment blood is running in the streets. Remember that in January 2012, the greatest investor, Warren Buffett, raised his stake in another UK retail firm, Tesco.  The biggest news for Walgreen, however, is the announcement of a dividend hike.  The company now will pay out $1.10 per share annually, which is a 22% increase from $0.90.  Take the current stock price of $29 and you get a 3.8% yield with wide margin for safety.  We believe Walgreen is a steal at any price below $30.

The C.H. Robinson (CHRW) Altimeter suggests that the stock valuation is close to a bottom.  The five-year dividend yield averages 1.5% but the current yield of 2.2% points to undervalution.  Looking at all other factors, the company is trading at a deep discount (source Morningstar).  Our only concern is the current Dow Theory bear market sentiment which could push the transportation stocks down even further.  If the 2.2% yield provides good compensation, one might want to start dipping their toe into this stock.

Procter & Gamble (PG) also reported earnings that failed to meet analysts’ expectations partly because of the slowdown in Europe.  Currency risk also plays a part in the decline of earnings.  With cosumers trading down to generic brand, it would hurt Procter & Gamble.  However, this may create a great entry point for anyone looking to get into this blue-chip name at bargain price.  IQTrend estimated that Procter is undervalued at 2.5%yield.  The current yield of 3.7%, then, is a good starting point to consider.

Top Five Performance Review

In our ongoing review of the NLO Dividend Watch List, we have taken the top five stocks on our list from June 24, 2011 and have check their performance one year later. The top five companies on that list can be seen in the table below.

Symbol Name 2011 Price 2012 Price % change
NTRS Northern Trust Corp.  44.98 43.29 -3.76%
SYBT S.Y. BanCorp., Inc.  22.5 22.48 -0.09%
TGT Target Corp. 46.33 57.4 23.89%
WEYS Weyco Group, Inc.  22.37 23.02 2.91%
GBCI Glacier BanCorp., Inc.  12.97 14.54 12.10%
Average 7.01%
DJI Dow Jones Industrial 11,934.58 12,573.57 5.35%
SPX S&P 500 1,268.45 1,325.51 4.50%

NLO_2012.6.22

Our top five outperformed the market 2-3%.  Two of the five company fail to reach the 10% mark within a year.

Nasdaq 100 Watch List: June 20, 2012

Below are the Nasdaq 100 companies that are within 10% of their respective 52-week lows. Stocks that appear on our watch lists are not recommendations to buy. Instead, they are the starting point for doing your research and determining the best company to buy. Ideally, a stock that is purchased from this list is done after a considerable decline in the price and rigorous due diligence.

Symbol Name Price P/E EPS Yield Price/Book % from Low
EA Electronic Arts Inc. $12.66 55.04 0.23 0 1.65 3.77%
DELL Dell Inc. $12.30 7.02 1.75 0 2.29 5.31%
CHKP Check Point Software $50.55 19.08 2.65 0 3.14 5.78%
SYMC Symantec Corporation $15.03 9.57 1.57 0 2.12 5.85%
CHRW CH Robinson Worldwide $59.31 22.12 2.68 2.2 7.8 6.14%
INFY Infosys Ltd. $43.95 14.65 3 1.8 3.84 6.16%
MRVL Marvell Technology Group $12.01 12.86 0.93 2 1.38 6.95%
CTRP Ctrip.com International Ltd. $17.54 16.78 1.04 0 2.19 7.94%
RIMM Research In Motion Limited $10.33 4.65 2.22 0 0.55 7.94%
TEVA Teva Pharmaceutical Industries $37.78 11.74 3.22 2.1 1.44 7.94%
EXPD Expeditors Int'l of Washington $39.90 23.06 1.73 1.4 4.08 7.95%
SPLS Staples, Inc. $13.03 9.35 1.39 3.5 1.25 9.13%
WYNN Wynn Resorts Ltd. $104.89 22.24 4.72 2 47.38 9.47%
APOL Apollo Group Inc. $33.96 7.39 4.6 0 3.79 9.80%

Watch List Summary

In our last summary dated June 8, 2012 (found here), we referred to the struggle that we were having in not purchasing NVIDIA (NVDA).  Since that posting, NVDA is up +9.24% (all within the last 3 days) on news that their chips will power Microsoft’s new tablet PC.  We’re not sure that the latest news is going to catapult NVDA as high as the last 120% run after being on our list, however, we believe the chip stocks on the Nasdaq 100 should be closely followed and accumulated over time.

Marvell Technology (MRVL) is another chip manufacturer that is on our radar.  According to Yahoo!Finance, Marvell, “…designs, develops, and markets analog, mixed-signal, digital signal processing, and embedded and standalone ARM-based microprocessor integrated circuits. It offers mobile and wireless products comprising communications processors; modem processors; Wi-Fi and other communication protocols, including Bluetooth and/or FM; mobile computing products; and connected home computing products.”

Dow Theory suggests that the following are the downside targets for Marvell:

  • $10.61
  • $7.54
  • $4.47

So far, Marvell has fallen within 6% of the $10.61 target, however, it has not breached that point thus far.  We’d be buyers of the stock at $8.25 with little regard for downside risk at that point in time.

In a follow-up to a previous piece on Wynn Resorts (WYNN), dated January 20, 2012 (found here), we indicated that Wynn, at $115.47, was likely to decline to $74. 76.  So far, WYNN has managed to decline to the $105 level.  Although the path hasn’t been straight down we are confident that this stock will come through on our downside projections.

Watch List Performance Review

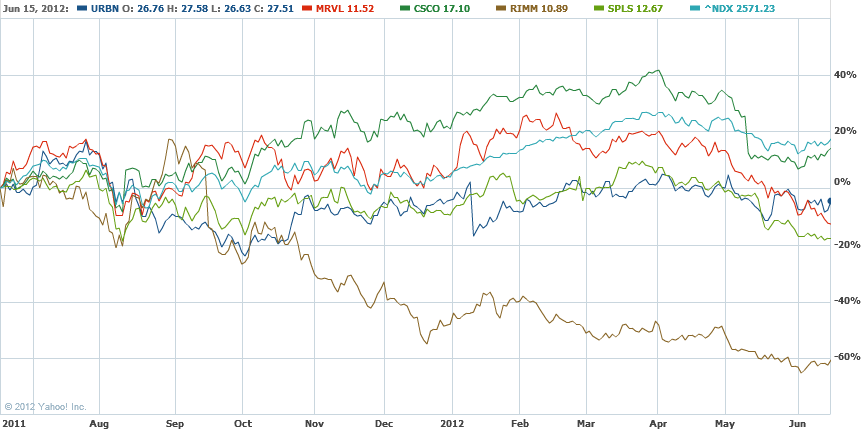
In our ongoing review of the Nasdaq 100 Watch List, we have taken the top 5 stocks from our June 17, 2011 Nasdaq 100 Watch List (found here). The top 5 companies from the watch list are provided below with the closing price from June 17, 2011 to June 17, 2012.

Symbol
Name 2011 2012 % change
URBN Urban Outfitters, Inc. 28.27 27.51 -2.69%
MRVL Marvell Technology 13.79 11.46 -16.90%
CSCO Cisco Systems, Inc. 15.05 17.1 13.62%
RIMM Research In Motion 35.33 10.89 -69.18%
SPLS Staples, Inc. 15.05 12.67 -15.81%
Average -18.19%

image

The top five from our watch list from last last year got blown away by the Nasdaq 100 Index, in the end.  The index went up while the stocks, as a group, went down.  The Nasdaq 100 index outperformed the top 5 by 36.78%.  Amazingly, the top five achieved our minimum goal of +10% gains within the first three months.

Unum Group (UNM) is Closing in on New Low

The latest insurance stock that has caught our eye is Unum Group (UNM) which is closing in on a 3-year low.  Prior to 1998, Unum Group had a dividend increasing history of 11 years at a compounded annual growth rate of 17.66% according to Moody’s Handbook of Dividend Achievers.  After 1998, Unum was challenged significantly resulting in a deep reduction of the dividend.  Most important to investors is the fact that after the -50% reduction of the dividend in 2003, the annual dividend remained at $0.30 for six years until 2009.  Since 2009, UNM has increased the dividend each year thereafter.  The handling of the dividend policy is important for several reasons:

  1. Cutting the dividend in 2003 was an accurate move by management since the book value declined -31% from the 2002 high to the 2008 low.
  2. As a financial services company, keeping the dividend the same through the financial crisis of 2007 to 2009 meant that the management team believed that stability had returned to the company.
  3. Raising the dividend after the financial crisis means that the management team believed the prospects for the company were improving.  After 2008, the book value for UNM has increased +51% which supports management’s decision.

We welcome a dividend cut when appropriately applied, even if the conditions that brought on the cut were based on management’s prior “bad” decisions.  In our view, the true test of any management team is not always generating blowout earnings but handling errors in an appropriate fashion.  UNM’s management has done all the right things at all the right times relative to the economic backdrop that we’ve experienced.

However, while we favor the actions of the management at Unum Group, we also need a sense of perspective on the most opportune time to actually buy the stock.  Two things that never change regarding the historical information on a stock is the dividend paid and the stock price.  This is why we prefer to look at Edson Gould’s Altimeter which reflects the stock price relative to the dividend that is paid.

image

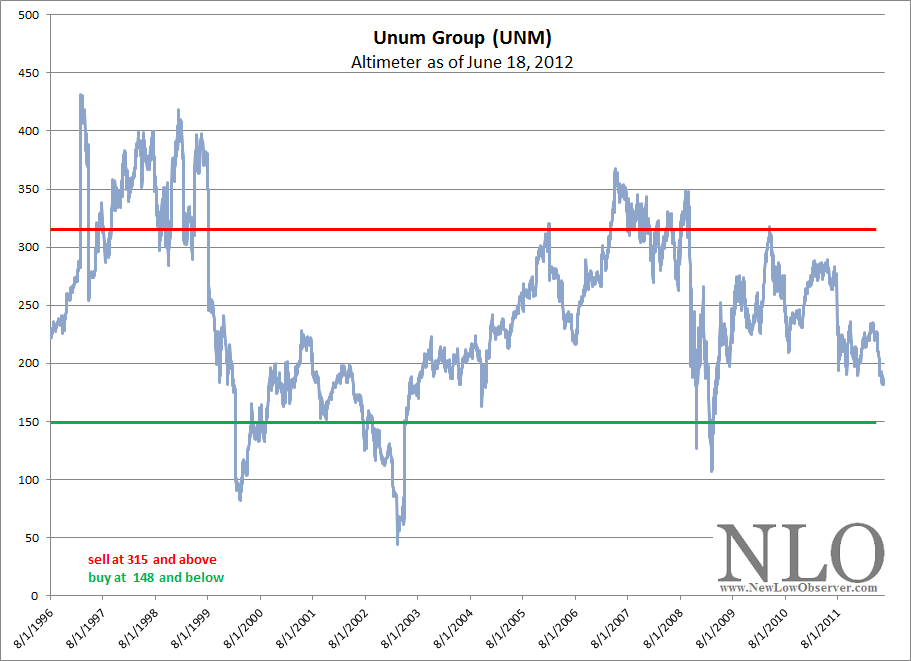
From our perspective, the movements of Gould’s Altimeter indicate that the stock should be bought at or below 148 and sold above 315.  Each time UNM has traded below or above the respective range, the following increase or decline followed:

Date Altimeter stock price buy/sell % change
2/25/1997 431.69 39.5 sell -59.97%
2/10/2000 106.82 15.81 buy 52.12%
1/27/2006 320.67 24.05 sell -60.58%
11/20/2008 126.40 9.48 buy 178.59%
4/14/2010 318.19 26.41 sell ????????
????????? 148.00 15.54 buy  

While we can’t be certain that UNM will replicate prior declines, a decline to the projected level of $15.54 seems well within reach as the stock currently trades at $19.26.  This would only be a decline of -41%, which is far less than previous Altimeter lows of –59% and –60% in 1997 and 2006, respectively.

According to Dow Theory, UNM would reach the 50% level at a price of $17.33.  Typically, the 50% level is the “make or break” level in the stock’s price.  If the stock can manage to stay above $17.33, then a majority of the shareholders since the 2009 low would be satisfied enough not to abandon the stock.  However, if the stock falls materially below the $17.33 level (say $17 or $16.50) then it would mean that most “long-term” holders of the stock are experiencing a loss and are seriously contemplating selling the stock.  The Dow Theory downside targets are as follows:

  • $14.08
  • $10.84
  • $7.60

Although UNM could be bought at $15.54 based on Gould’s Altimeter, it should be understood that there are likely to be further declines.  Therefore, an investor should not become disenfranchised with Dow Theory downside targets.  Instead, investors need to allocate appropriate amounts of capital and break up the intended purchase into 2 or 3 transactions.

U.S. Dividend Watch List: June 15, 2012

Below are the 21 companies on our U.S. Dividend Watch List that are within 11% of their respective 52-week lows. Stocks that appear on our watch lists are not recommendations to buy. Instead, they are the starting point for doing your research and determining the best company to buy. Ideally, a stock that is purchased from this list is done after a considerable decline in the price and rigorous due diligence.

Symbol Name Price % Yr Low P/E EPS (ttm) Dividend Yield Payout Ratio
UNM Unum Group 19.51 2.85% 25.67 0.76 0.42 2.15% 55%
CHRW C.H. Robinson Worldwide, Inc.  58.56 4.80% 21.85 2.68 1.32 2.25% 49%
TR Tootsie Roll Industries Inc  22.76 5.22% 30.35 0.75 0.32 1.41% 43%
FNFG First Niagara Financial Group  8.06 5.50% 13.43 0.6 0.32 3.97% 53%
BDX Becton, Dickinson and Co. 73.59 5.75% 13.40 5.49 1.80 2.45% 33%
BMO Bank of Montreal 53.98 5.95% 9.62 5.61 2.73 5.06% 49%
ANAT American National Insurance 70.08 6.65% 9.86 7.11 3.08 4.39% 43%
WAG Walgreen Co. 31.8 6.71% 10.85 2.93 0.90 2.83% 31%
EXPD Expeditors International 39.48 6.82% 22.82 1.73 0.56 1.42% 32%
CWT California Water Service 17.85 7.21% 20.76 0.86 0.63 3.53% 73%
JW-A John Wiley & Sons Inc. 44.95 7.30% 14.27 3.15 0.80 1.78% 25%
THFF First Financial Corp. 27.96 7.33% 10.28 2.72 0.94 3.36% 35%
NFG National Fuel Gas Co. 44.64 7.39% 17.57 2.54 1.46 3.27% 57%
TMP Tompkins Financial Corp. 36.25 8.63% 11.69 3.1 1.44 3.97% 46%
PG Procter & Gamble Co.  62.88 9.24% 19.29 3.26 2.25 3.58% 69%
COP ConocoPhillips 55.46 9.56% 6.05 9.16 2.64 4.76% 29%
MATW Matthews International Corp.  31.32 9.63% 13.10 2.39 0.36 1.15% 15%
APD Air Products & Chemicals, Inc. 79.48 9.99% 14.29 5.56 2.56 3.22% 46%
SRCE 1st Source Corp.  21.3 10.02% 10.65 2 0.64 3.00% 32%
WEYS Weyco Group, Inc.  23.05 10.71% 16.23 1.42 0.68 2.95% 48%
NJR New Jersey Resources Corp. 43.9 10.86% 14.68 2.99 1.52 3.46% 51%
21 Companies

Watch List Summary

Unum Group (UNM) provides disability, life, and financial protection benefits.  The stock is trading at a 33% discount to its book value.  Our Altimeter study  of UNM displays a noticeable trading range and suggest that we are currently at the middle of that range.

The C.H. Robinson (CHRW) Altimeter suggests that the stock valuation is close to a bottom.  The five-year dividend yield averages 1.5% but the current yield of 2.2% points to undervalution.  Looking at all other factors, the company is trading at a deep discount (source Morningstar).  Our only concern is the current Dow Theory bear market sentiment which could push the transport stock down even further.  If the 2.2% yield provides good compensation, one might want to start dipping their toe into this stock.

Of all these companies, Matthews International (MATW) provide the largest margin of safety with a 15% dividend payout ratio.  Typically, the stock trades at 13x cash flow.  Cash flow estimates are $3.75 and $4.05 for 2012 and 2013, respectively.  Matthews International's fair value calculation is $48.75 for 2012 and $52.65 for 2013.

Top Five Performance Review

In our ongoing review of the NLO Dividend Watch List, we have taken the top five stocks on our list from June 15, 2011 (not published) and have check their performance one year later. The top five companies on that list can be seen in the table below.

Symbol Name 2011 Price 2012 Price % change
HGIC Harleysville Group Inc.  30.41 59.9 96.97%
TGT Target Corp. 46.53 58.5 25.73%
ANAT American National Insurance 74.84 70.08 -6.36%
SYBT S.Y. BanCorp., Inc.  22.96 22.94 -0.09%
BRK-A Berkshire Hathaway Inc. CL 'A' 113,250.00 123,375.00 8.94%
Average 25.04%
DJI Dow Jones Industrial 12,004.36 12,767.17 6.35%
SPX S&P 500 1,271.50 1,342.84 5.61%

NLO.2012.6.15

Our top five outperformed the market by a wide margin thanks to the acquisition of Harleysville (HGIC).  Berkshire (BRK-A) is on our dividend watch list even though it doesn’t pay dividend.  Because Berkshire is a large beneficiary of dividend paying companies we believe it is wise to track it the stock.  As such, you can see that it outperformed the market by 2-3%.

Buckle (BKE): A Review

The following is a review of Buckle (BKE) using Edson Gould’s Altimeter.

image

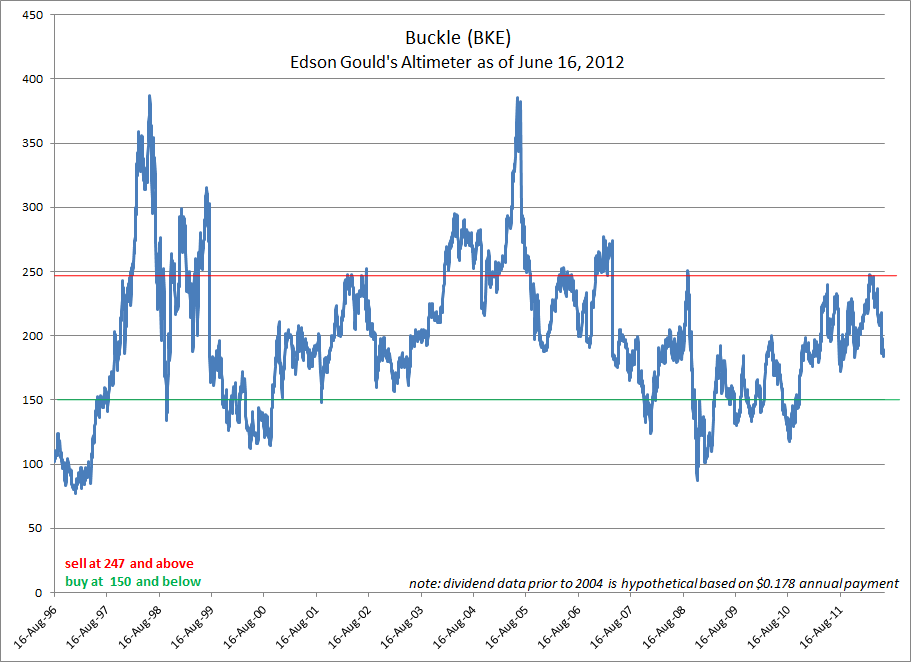
Below is the performance of the buy and sell indications of Edson Gould’s Altimeter based on periods when the indicator first cross below 150 for buy indication, and above 247 for sell indications.

Date Price Altimeter buy/sell % change $1 invested
6/12/1997 6.57 148 buy 69% $1.69
1/28/1998 11.13 250 sell -47%  
10/8/1998 5.95 134 buy 85% $3.13
11/6/1998 11.01 248 sell -41%  
11/4/1999 6.51 146 buy 69% $5.30
3/19/2002 11.01 248 sell 120%  
11/19/2007 24.26 146 buy 72% $9.13
9/18/2008 41.78 251 sell -43%  
10/23/2008 23.94 144 buy 107% $18.90
3/9/2012 49.56 248 sell -39%  
????????? 30 150 buy ?????????  

The consistency of the indicator is amazing.  Only the sell indication of March 19, 2002 resulted in an outcome that was contrary to the desired result.  Even so, A person who only bought BKE based on the buy signal and sold based on the sell indication would have resulted in a gain of 1,890% from June 12, 1997 to the present.  This is compared to the buy and hold total return with reinvestment of dividends (including special dividends) of 766.21%.  Based on capital appreciation alone, the price of BKE rose 498% since June 12, 1997.

  • +1,890% (buy/sell Altimeter)
  • +766% (dividends reinvested)
  • +498% (based on price change only)

In the table above, the section in blue is the tentative estimate of when the next buy signal will be registered and the amount of decline necessary to get to the signal.  It appears that based on the sell indication from March 9, 2012 to the price of $30, BKE would have to decline -39% using the Altimeter.  Such a decline is well within the prior successful sell indications that resulted in losses.

We are very interested in this stock at the right price.  We believe that BKE will be a buy at $30 and below.  However, prior price movement based on Gould’s speed resistance lines indicated that the conservative downside target is $24.47 and the extreme downside target of $16.68.

Historically, based on prior Altimeters, a buy indication does not mean that the price decline has actually ended. Therefore, if the buy indication is triggered then be prepared by making your purchase of the stock in, at least, two stages. Once at the trigger price and again at any desirable price lower than the trigger level.

Investment Observation: Markel (MKL) at $433.72

According to Value Line Investment Survey, “Markel Corp. markets and underwrites specialty insurance products and programs to a variety of niche markets.” When reviewing the Value Line tear sheet on Markel, there are a couple of items that make the stock very compelling.

First, Value Line indicates that the company has a fair value of 1.5 times the book value. Using the most conservative full year data from 2011 provided by Value Line, Markel has a fair value of $528.15 which is a 20% premium above the current market price of $439.77. Value Line estimates that by 2017, Markel would have a book value of $447. This implies a fair value of $670.50. Assuming that Markel only achieves half of the projected growth in the book value, the fair value would be at $599. Considering that Markel typically trades above fair value, the prospects are reasonably favorable.

Next, Markel has increased their book value from $49.16 in 1996 to $352.10 in 2011. With Markel having the ability to consistently increase their book value at double digit rates is phenomenal in our view. As an added benefit, Markel has only increased the number of shares outstanding from 5.46 million to 9.62 million in the period from 1996 to 2011. This suggests that the growth of the company has not come at the expense of the shareholders.

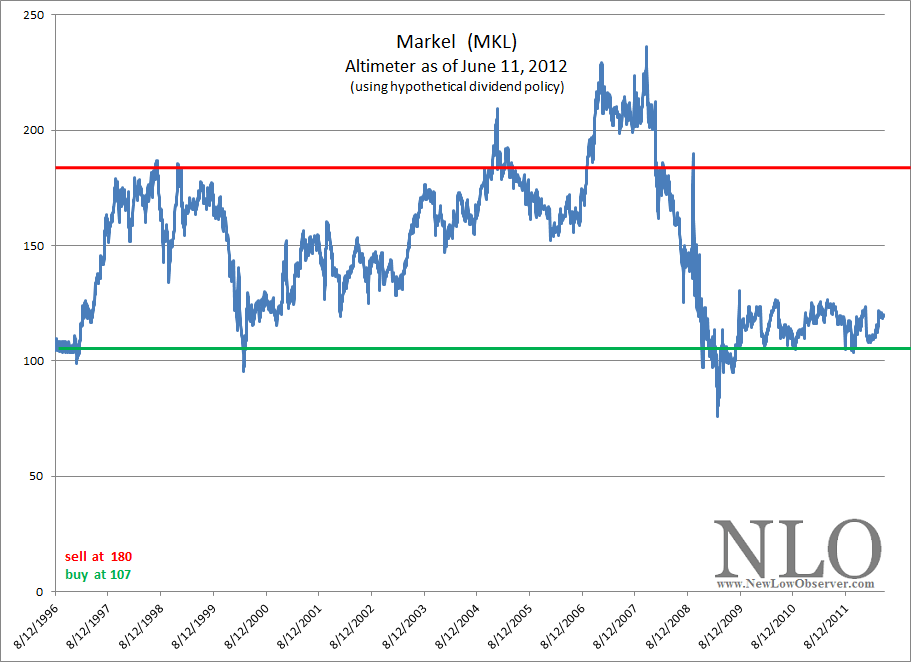
We have constructed an Altimeter for Markel (MKL) that is based on a hypothetical dividend assuming an average payout from earnings of 13%  and a compounded annual growth rate (CAGR) of the dividend at 9.9%.

image

Although hypothetical, our assumptions of a dividend policy is the most conservative possible.  We believe that, if compelled, Markel could easily maintain such a dividend policy while increasing the book value.  Whenever, the Altimeter is above 180, the stock should be sold and whenever it is below 107, MKL should be bought.  Below is the performance of the stock price when it falls within the parameters previously noted.

Date Price Altimeter buy/sell % change
2/23/1996 87 106 buy 106.61%
6/8/1998 179.75 182 sell -31.99%
3/6/2000 122.25 103 buy 157.67%
10/5/2004 315 181 sell -22.14%
11/20/2008 245.25 97 buy ????????

An alternative strategy, for investors with a long-term perspective, could be to accumulate the shares of Markel at or below 107 on the Altimeter (currently $395.90) without consideration of selling.  We feel this would be a prudent stance since the declines experienced by the stock at the “sell” indications are not meaningful enough to warrant actually selling the stock by the time the next “buy” indication is given.

Finally, our concern for the worst case scenario is always in the back of our mind.  For this reason, we assume that the lows of 2009 will be revisited and ask ourselves are we able to handle such a situation.  If based on the Altimeter low of 2009, Markel could decline as low as $281.20.  Our hope is that such a low is not visited again.  However, with the aid of Dow Theory, we are prepared to accumulate additional shares when, and if, such an opportunity arises.