Author Archives: nlo-admin

Nasdaq 100 Watch List: June 8, 2012

Below are the Nasdaq 100 companies that are within 10% of their respective 52-week lows. Stocks that appear on our watch lists are not recommendations to buy. Instead, they are the starting point for doing your research and determining the best company to buy. Ideally, a stock that is purchased from this list is done after a considerable decline in the price and rigorous due diligence.

symbol Name Price P/E EPS Yield P/B % from Low
SYMC Symantec Corporation 14.57 9.28 1.57 - 2.06 2.17%
DELL Dell Inc. 12.12 6.92 1.75 - 2.28 2.71%
CHRW CH Robinson Worldwide Inc. 57.92 21.6 2.68 2.3 7.51 3.65%
EA Electronic Arts Inc. 13.47 58.57 0.23 - 1.75 4.74%
INFY Infosys Ltd. 43.62 14.54 3 1.3 3.81 5.36%
NVDA NVIDIA Corporation 12.12 14.8 0.82 - 1.72 5.67%
GMCR Green Mountain Coffee Roasters 23.13 11.11 2.08 - 1.76 6.25%
EXPD Expeditors Int'l of WA 39.36 22.75 1.73 1.4 3.95 6.49%
CTRP Ctrip.com Int'l 18.66 17.86 1.04 0 2.38 6.63%
SPLS Staples, Inc. 12.86 9.23 1.39 3.4 1.24 7.71%
LRCX Lam Research 37.62 16.65 2.26 - 1.72 8.07%
NFLX Netflix, Inc. 65.64 22.22 2.95 - 5.41 8.14%
WYNN Wynn Resorts Ltd. 104.21 22.1 4.72 1.9 46.53 8.76%
NTAP NetApp, Inc. 30.33 19.2 1.58 - 2.65 9.14%
MCHP Microchip Technology Inc. 32.01 19.4 1.65 4.4 3.08 9.25%
VOD Vodafone Group 26.58 12.6 2.11 7.5 1.1 9.34%
MRVL Marvell Technology 12.28 13.15 0.93 2 1.4 9.35%
ORCL Oracle Corporation 27.16 14.23 1.91 0.9 3.16 9.87%
CTSH Cognizant 58.85 19.81 2.97 - 4.14 9.92%

Watch List Summary

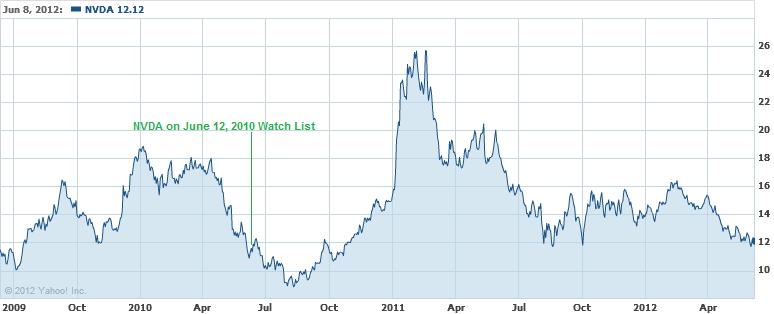
Of interest on our watch list is NVIDIA (NVDA).  According to Yahoo!Finance, “NVIDIA Corporation provides graphics chips for use in smartphones, personal computers (PC), tablets, and professional workstations markets worldwide.”  As we’ve described in the past, we have a strong interest in chip sector stocks and believe that the long-term prospects for companies in the chip industry is very appealing.

NVDA first appeared on our watch list on June 12, 2010.  At that time, NVDA was trading at $11.61.  By February 18, 2011, NVDA was trading as high as $25.68 which was a gain of over +120%.  We’re not certain that NVDA’s decline has ended.  According to Edson Gould’s Speed Resistance Lines, NVDA has already declined below the conservative downside target of $17.87 based on the February 2011 high.  The persistence of the current decline suggests that the stock could decline to the extreme downside target of $8.67.  We’re doing everything we can to hold off buying this stock at the current time.
image

Watch List Performance Review

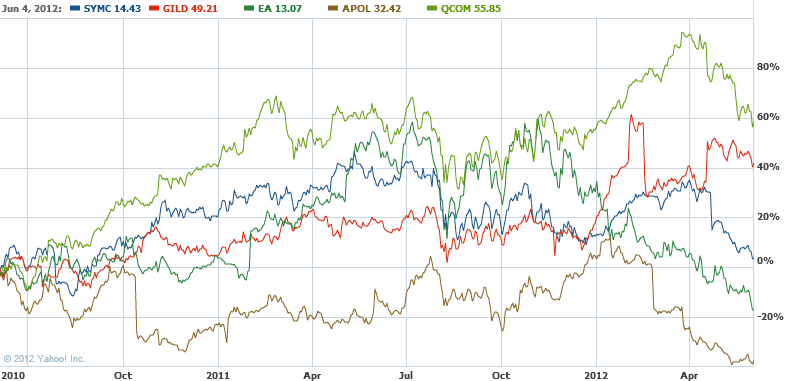
The following is a performance review of the top five Nasdaq 100 Watch List from June 4, 2010.  Keep in mind that this is a 2 year performance review instead of a 1 year review.

Symbol
Name 2010 2012 % change
GILD Gilead Sciences, Inc. $34.71 49.21 41.77%
SYMC Symantec Corporation $13.92 14.43 3.66%
ERTS Electronic Arts Inc. $15.81 13.07 -17.33%
APOL Apollo Group, Inc. $51.48 32.42 -37.02%
QCOM QUALCOMM $35.30 55.85 58.22%
average 9.86%
NDX Nasdaq 100 1,832.04 2,478.13 35.27%

As can you can see, the list of top five stocks significantly underperformed the Nasdaq 100 (NDX), mainly due to Apple Inc. (AAPL) having an outsized impact on the index.  However, underneath the static 2-year performance data is a story to be told, which is the basis of our New Low investment strategy.

In the chart below, take note of the period around July 2011.  At that time, Qualcomm had gains of +60%, Electronic Arts had gains of +55%, Symantec had gains of +42% and Gilead Sciences had gains of +21%.  Only Apollo Group had losses to compare against the other stocks.
image

In the case of Symantec and Electronic Arts, they have come full circle after a 2-year period. This cycle is not unusual for most of the stocks that we track. Even when the stock does not approach the prior low of a watch list, many stocks attain a 52-week low after 2 to 2.5 years (as in the NVDA example above). Be on the lookout for stocks that have similar cycles like EA, SYMC and NVDA since their ability to replicated such moves adds to the prospect that they could pull a repeat performance.

U.S. Dividend Watch List: June 8, 2012

Below are the 23 companies on our U.S. Dividend Watch List that are within 11% of their respective 52-week lows. Stocks that appear on our watch lists are not recommendations to buy. Instead, they are the starting point for doing your research and determining the best company to buy. Ideally, a stock that is purchased from this list is done after a considerable decline in the price and rigorous due diligence.

Symbol Name Price % Yr Low P/E EPS (ttm) Dividend Yield Payout Ratio
CRR Carbo Ceramics, Inc. 73.17 2.25% 13.00 5.63 0.96 1.31% 17%
BMO Bank of Montreal 52.66 3.36% 9.44 5.58 2.73 5.18% 49%
CHRW C.H. Robinson Worldwide 57.92 3.65% 21.61 2.68 1.32 2.28% 49%
UNM Unum Group 19.79 4.32% 26.04 0.76 0.42 2.12% 55%
WAG Walgreen Co. 31.16 4.56% 10.63 2.93 0.90 2.89% 31%
FNFG First Niagara Financial 7.99 4.58% 13.32 0.6 0.32 4.01% 53%
BDX Becton, Dickinson and Co. 73.26 5.27% 13.34 5.49 1.80 2.46% 33%
TR Tootsie Roll Industries 22.8 5.41% 30.40 0.75 0.32 1.40% 43%
TDS TDS 20.4 6.25% 10.68 1.91 0.49 2.40% 26%
EXPD Expeditors International 39.36 6.49% 22.75 1.73 0.56 1.42% 32%
JNJ Johnson & Johnson  62.98 6.60% 17.25 3.65 2.44 3.87% 67%
COP ConocoPhillips 53.97 6.62% 5.89 9.16 2.64 4.89% 29%
ANAT American Nat'l Insurance 70.29 6.97% 9.89 7.11 3.08 4.38% 43%
CWT California Water Service 17.85 7.21% 20.76 0.86 0.63 3.53% 73%
JW-A John Wiley & Sons Inc. 45.02 7.47% 14.29 3.15 0.80 1.78% 25%
NFG National Fuel Gas Co. 44.97 8.18% 17.70 2.54 1.42 3.16% 56%
MATW Matthews Int'l Corp.  30.91 8.19% 12.93 2.39 0.36 1.16% 15%
THFF First Financial Corp. 28.36 8.87% 10.43 2.72 0.94 3.31% 35%
PG Procter & Gamble Co.  62.75 9.02% 19.25 3.26 2.25 3.59% 69%
MCD McDonald's Corp.  87.75 9.16% 16.40 5.35 2.80 3.19% 52%
TMP Tompkins Financial Corp. 36.7 9.98% 11.84 3.1 1.44 3.92% 46%
NJR New Jersey Resources 43.56 10.00% 14.57 2.99 1.52 3.49% 51%
APD Air Products & Chemicals 79.62 10.19% 14.32 5.56 2.56 3.22% 46%
23 Companies

Watch List Summary

Carbo Ceramics (CRR) tops our list and continues to trade lower.  With the current technical picture, the $60 level would be an important support level.  Analysts have taken the CRR earning estimate down since April when they projected Carbo Ceramics will grow by +31%, or $8.28.  The stock has fallen -18% since our April list.  Growth estimates of 25% is a bit rich for us but we will wait and see how the stock holds up at these levels.

Bank of Montreal (BMO) continues to struggle and remains at the 52-week low. We’ve made our “bullish” case for BMO on our June 7th post.  We think that $51.80 and below would be the right price to start accumulating shares.

McDonald’s (MCD) has appeared our list this week.  IQTrends (www.iqtrends.com) estimates that MCD is undervalued when it has a dividend yield of3.6%.  Our model places fair value at $104 but it is considered undervalued at $58.

Given the bearishness of the market, we believe that there a significant chance of MCD moving towards $58 before getting to the $104 fair value level.  The slowdown in China and greater Asia in general should hit the bottom line as consumers seek alternatives.

Walgreen's trading at its historically cheapest level.  That fact hasn’t convinced Morningstar.com to rate this stock favorably.  Morningstar.com suggests that investors buy the shares at the $21 range even though the stock has a fair value at $35.  The analyst at Morningstar.com is concerned about the competitive edge Walgreen has to face with consolidation in the industry.  As such, they see margin contraction coming soon.  Value Line Investment Survey also cites some of the same issues but they placed a more favorable view on Walgreen based on market size and its ability to generate cash flow.  Value Line expects Walgreen to trade around 11.5x cash flow.  With 2013 estimated cash flow per share of $4.30, Value Line has a fair value at $49.45.  That figure is in line with our valuation model.

Top Five Performance Review

In our ongoing review of the NLO Dividend Watch List, we have taken the top five stocks on our list from June 10, 2011 and have check their performance one year later. The top five companies on that list can be seen in the table below.

Symbol Name 2011 Price 2012 Price % change
WEYS Weyco Group, Inc.  22.32 23.22 4.03%
TRH Transatlantic Holdings, Inc. 44.01 61.5 39.74%
CHFC Chemical Financial Corp.  18.13 19.9 9.76%
TGT Target Corp. 46.7 59.2 26.77%
SFNC Simmons First National Corp.  24.38 23.4 -4.02%
Average 15.26%
DJI Dow Jones Industrial 11,637.45 12,554.20 7.88%
SPX S&P 500 1,269.75 1,325.66 4.40%

NLO.2012.6.10

Transatlantic Holdings (TRH) was acquired by Alleghany (Y) after a feeble and failed attempt to acquire by Warren Buffett.  Our top five returned an average of +15% over the last year.  Additionally, the top five easily achieved our minimum target return of +10% within the one year time frame.

Cimarex (XEC) at a New Low

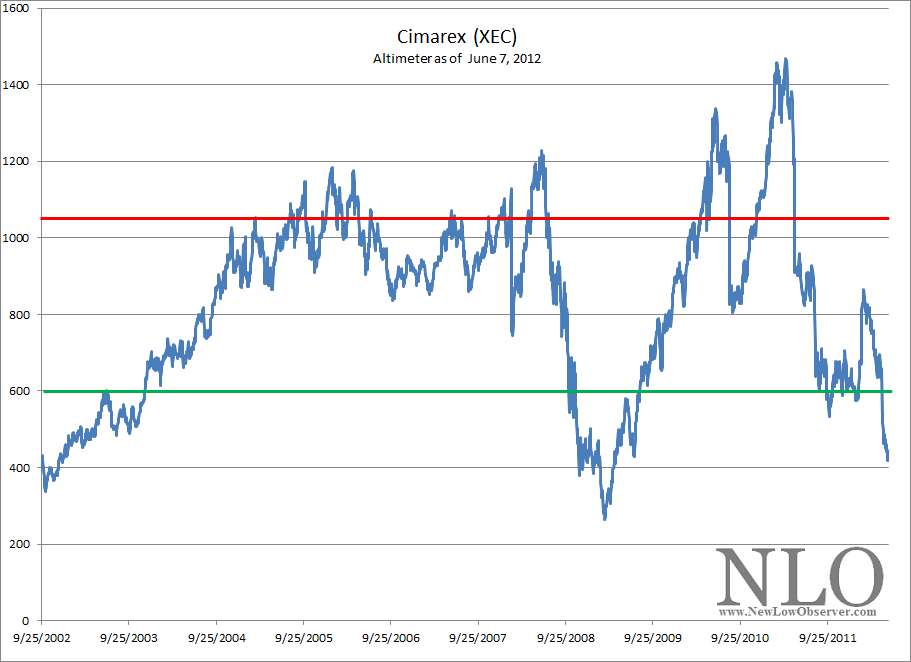
Today, Cimarex (XEC) hit a new 1 and 2-year low as the energy sector continues to fall apart.  We like Cimarex (XEC) because it is a spin-off from Helmerich & Payne (HP) which has had a tremendous dividend increasing history.  Additionally, we have been very fortunate in being able to call most of the peaks and troughs in the price of Helmerich & Payne found at the links below:

Cimarex appears to be willing to continue the conservative management style that got Helmerich & Payne through hard times in the oil drilling industry during the 1980’s and 1990’s.  Therefore, we believe that Cimarex should be on your watch list as well.

Below is the Altimeter for Cimarex since being spun off from Helmerich & Payne:

image

note: dividend data prior to 2006 is hypothetical based on $0.04 quarterly payment

We believe that whenever the Altimeter is trading at or above 1032 the stock should be sold.  Additionally, whenever Cimarex’s Altimeter is trading at 600 or below, the stock should be considered for acquisition.  Below is the performance of buy and sell indications based on the Altimeter levels just mentioned:

Date Price Altimeter buy/sell % change
6/26/2003 23.96 599 buy 72.29%
3/3/2005 41.28 1032 sell -47.25%
10/10/2008 32.66 544 buy 90.02%
3/11/2010 62.06 1034 sell -42.18%
8/22/2011 59.81 598 buy ??????????

Our expectation is that Cimarex may decline as low as, and possibly lower, than the 2009 level on the Altimeter.  That would equal a price of $31.80, or -30% from the current price.  A purchase of the stock at this time may be warranted, based on the Altimeter.  However, be prepared to buy more at lower prices.

Investment Observation: Bank of Montreal (BMO)

Today’s Investment Observation is Bank of Montreal (BMO).  According to Yahoo!Finance, Bank of Montreal “…provides various retail banking, wealth management, and investment banking products and services in North America and internationally.”

While there is considerable attention to the ability of Canadian banks to grow in spite of the travails of American banks, the premise of our interest in Bank of Montreal is only based on the fact that the company has a solid dividend history, near a new low and has an easily discernable Altimeter.

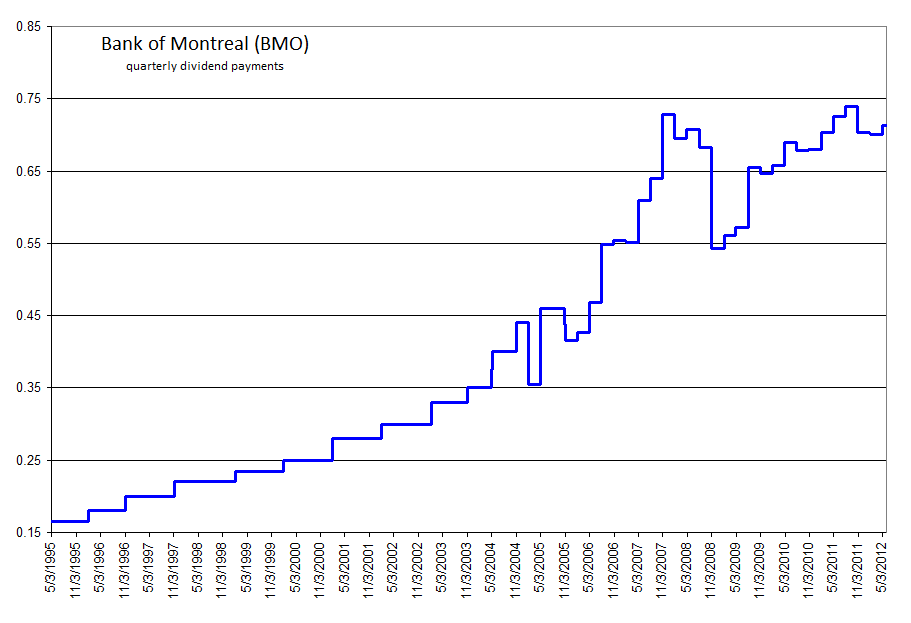
Bank of Montreal has a stellar dividend history which we believe the company has the ability to maintain.

image

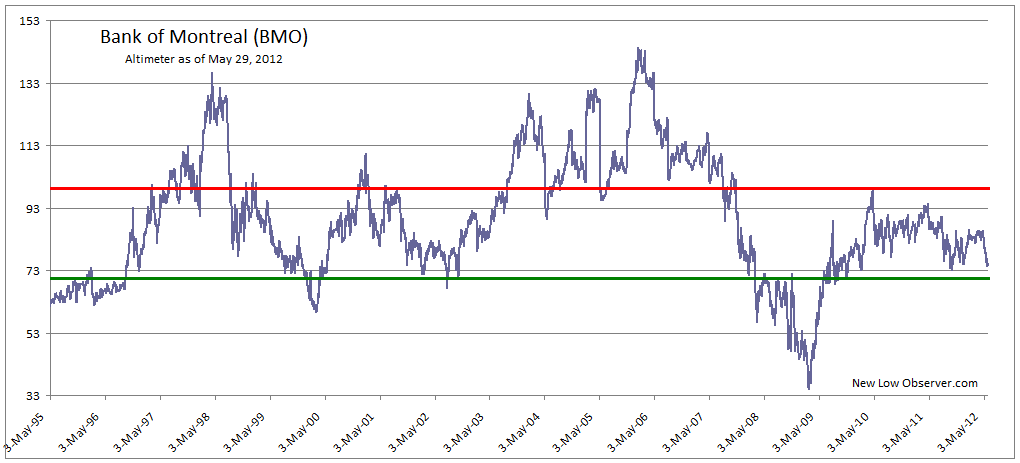
Using Edson Gould’s Altimeter, as seen below, we find that BMO is bouncing along the lower end of the range which would suggest that the stock is approaching the undervalued range.

image

Whenever BMO trades above 99.24 on the Altimeter the stock should be considered for selling and anytime the stock declines below 73 it should be considered for acquisition.  Below is the track record for this indication since 1996:

Date Close Altimeter buy/sell %change
2/5/1996 12 72.73 buy 67.67%
3/10/1997 20.12 100.6 sell -15.81%
8/10/1999 16.94 72.09 buy 48.29%
12/8/2000 25.12 100.48 sell -14.21%
2/6/2002 21.55 71.83 buy 52.25%
8/26/2003 32.81 99.42 sell 61.20%
1/17/2008 52.89 72.65 buy 23.46%
4/26/2010 65.3 99.24 sell -17.53%
10/4/2011 53.85 72.87 buy ?????

In only one instance, August 26, 2003, when a sell indication was given, did the stock rise when it was expected to fall before another Altimeter buy indication was given.  The average gain after a buy indication was +47%.  This excludes any instance where the holder of the stock could have sold at much higher levels other than when the sell indication kicked in.

Dow Theory indicates that BMO has a fair value of $44.85.  This means that BMO is trading approximately 22.83% above fair value.  Our assessment of the Dow Theory fair value is based on the the trading high of 2010 and the trading low of 2009.  From the current price, BMO has the following Dow Theory downside targets:

  • $51.80
  • $37.90
  • $24.00

These downside targets are a broad overview of the potential downside risk, as each target is met we will be glad to provide intermediate and short-term downside targets.

According to Value Line Investment Survey, BMO is considered to be at fair value when the stock is trading 10.5 times earnings.  Using the most conservative figures available, full year 2011 reported earnings of $5.26, BMO would be trading at a fair value of $55.23.  From 1996 to 2011, Value Line indicates that BMO has increased the number of shares outstanding by only 23%.  This is significant because any bank that has managed to get through the banking crisis of 2006 to 2011 with such a “small” increase of shares is in a relatively stable condition.

We are reticent to recommend any kind of banking institution due to the many unexpected risks that occur outside of the purview of regulators and accountants.  However, Bank of Montreal is a reasonable banking investment if bought at the right price.  We believe that the right price begins at $51.80 and below.

Precious Metal Myths: A Metal “Standard” Promotes Economic Stability

As precious metals investors since 1996 (long only) and speculators since 2008 (long and short), we readily admit that when the right price appears we’re going to sell a large portion of our physical inventory.  We have written numerous articles on gold and silver highlighting both the good and the bad associated with investing in precious metals.  We feel that a balanced view of both the risks and rewards of precious metals investment and speculation is critical to the longer term goal of wealth accumulation.

Unfortunately, there is a contingent of precious metal marketers that would rather stretch the truth or even promote myths to inspire undue hope, fear, and reckless optimism.  A common myth by these marketers is that if we have a gold “standard” instead of a U.S. dollar based financial system, our debt laden society would become stable.  Unfortunately, promoters of this claim have not carefully examined a period when there was a gold “standard.”

Below is a chart of gold and silver in the period from 1846 to 1895, this to set the stage for the level of stability that was experienced by most Americans.

image

The chart above is drawn from an article titled “The Relative Stability of Gold and Silver” by Edward Sherwood Meade in the Annals of the American Academy of Political Social Science, 1899.  In the period from 1851 to 1873, there was a bimetallic “standard,” where both gold and silver were used as a monetary base in some countries.  At the same time, either gold or silver was used in other countries as a form of a monetary “standard.”  After the period of 1873, the silver “standard” was abandoned due to “…legislative and industrial” reasons according to Meade.

Unfortunately, both gold and silver “standards” are constructs of legislative actions (fiat) and subject to industrial supply and demand constraints, just as the U.S. dollar is subject to fiscal and monetary policies (etc.).  It should be noted that although gold and silver were the “standards” for a given monetary system, there was still a decline of nearly –33% in the value of gold and silver from 1851 to 1873.  The subsequent dramatic rise of both gold and silver from 1873 and beyond only demonstrates just how little stability there actually was in having gold and silver as the anchor for the monetary system.

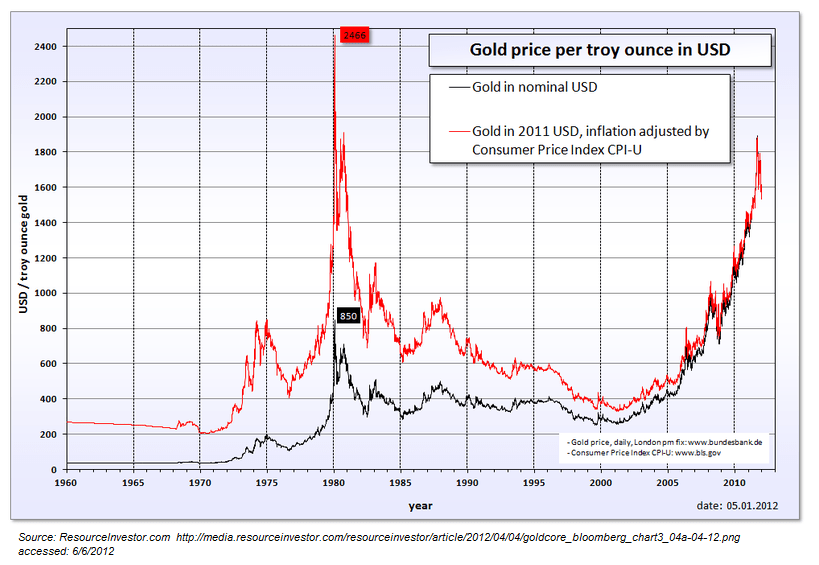
Adding insult to injury, it took 33 years for gold to achieve parity after the decline from 1851.  This is eerily similar to the 31 years it has taken gold to achieve the inflation-adjusted equivalent of 1980 when gold peaked at $1,900 an ounce in 2011.

image

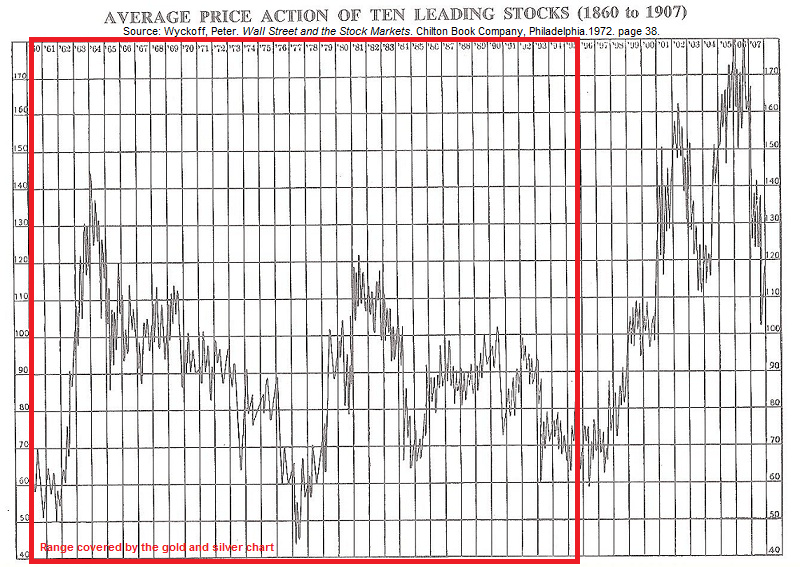
While gold and silver was vacillating wildly as a “standard” in the 1800’s, the stock market, represented by the chart below, was demonstrating its characteristic fluctuations.

image

The stock market increased nearly +300% and declined over -50% on two separate occasions in the period from 1860-1895.  Having a gold and silver “standard” promoted greater volatility in the market since it would take a government edict (fiat) to mitigate massive gains or losses in the price of gold and silver.  Additionally, cornering of the market was much easier then than it is today.

At the same time that the stock market was experiencing wide gyrations, the U.S. economy experienced widespread panics and depressions in the period from 1857 to 1895.  Below are the National Bureau of Economic Research (NBER) dates for economic recessions from 1857 to 1895:

Peak Trough Contraction                                                (peak to trough in months)
June 1857(II) December 1858 (IV) 18
October 1860(III) June 1861 (III) 8
April 1865(I) December 1867 (I) 32
June 1869(II) December 1870 (IV) 18
October 1873(III) March 1879 (I) 65
March 1882(I) May 1885 (II) 38
March 1887(II) April 1888 (I) 13
July 1890(III) May 1891 (II) 10
January 1893(I) June 1894 (II) 17

Amazingly, 47% of the time from 1857 to 1895 was spent in periods of recession with a large dose of panics and crashes mixed in.   The most notable of the U.S. economic contractions started with the panic of 1873 which, spawned by years of railway speculation in the U.S. but sparked by the collapse of banking giant Jay Cooke & Co.,  led to a global economic depression that lasted well beyond 1878 in many other countries.  The panic of 1873 was the longest lasting recession/depression based on NBER data.

Currently, the monopoly role (corner of the market) that government has on monetary and fiscal policy allows investors and speculators a better chance to align their interests within the context of the known.  What we know is that the purchasing power of the dollar will never increase under the current regime.  If governments are allowed to set artificial “standards” then investors and speculators would not know when the policy will be changed/ended.

Again, anyone who feels that the current system is out of whack should carefully consider the prospects of the “legislative and industrial” whims that a gold and silver “standard” could bring.  We believe that whether dollar, gold, yen, silver, yuan, or pesos, the only constant is change itself.

Planning accordingly for the prospects of change is what makes for successful investment and speculation in the precious metals market.  Those marketers who rely on fear and the propagation of myths only serve to ensure the maximum number of unsuccessful speculators.

Note: In terms of gold and silver, the word “standard” following each metal is really a pseudonym for price control, price fixing and propping the market for whatever the “standard” may be.  This means that the market value for whatever the “standard” is will not be realized in the open market in the period that a “standard” is used. 

There is nothing more oxymoronic than the word “standard” being applied to either gold, silver, or the U.S. dollar since the origins of the word “standard” is rooted in the meaning to “stand fast or firm.”  This is something that could never occur in a world that is always seeking a price, unless mandated by government that price seeking is illegal.

Market Outlook: Mixed Signals

On February 7, 2012, we wrote an article on the topic of gold titled “Gold Stock Indicator Points Down” (found here).  In that article, the very last sentence said the following:

“based on the current trajectory, we have May/June 2012 as our tentative reversal period.”

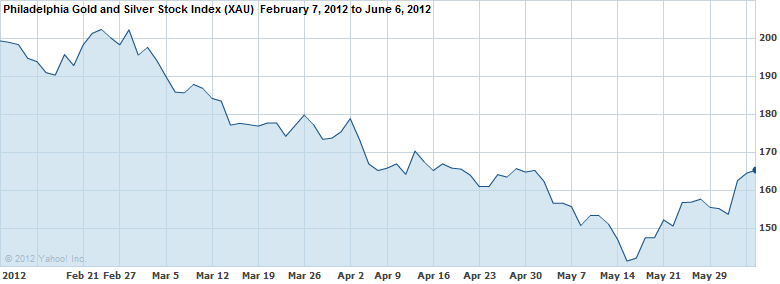
Well, the month of May has passed and we’ve seen an amazing plunge in gold stocks since the posting of our February 7th article, as reflected in the chart below:

image

Since February 7, 2012, the XAU gold stock index declined -28.95% to the May 15th low.  As we had anticipated, the “May/June” bottom was reached, for now. Ordinarily, this would be the time to buy gold stocks, especially those that pay a dividend.  However, in our May 27th transaction review of NUGT (found here), we said that, based on our Gold Stock Indicator, there would be a second opportunity to buy gold stocks at a considerable value.

The recovery in the XAU index has been even more spectacular than the plunge.  Historically, such rapid increases in a stock or index would require a decline of at least -50% of the most recent rise, even if the trend is still higher.  Therefore, based on the most recent price of 168.71 in the XAU index, there should be a decline to the 154.56 level or half of whichever the most recent peak might be.  We’d consider buying dividend paying gold stocks at half of the highest point achieved or lower.  (Please, if you have any questions about this paragraph we’d be more than glad to explain further if we were not clear in any way.)

For now, the direction for gold stocks is up based on our Gold Stock Indicator, until proven otherwise.  However, at the same time the Gold Stock Indicator is pointing up, we have a Dow Theory bear market indication as outlined in our May 19th article (found here) suggesting that stocks in general are supposed to decline.  Our vast amount of research on the topic suggests that if the general stock market were to have a decline of 10%-15% or more, then gold stocks would decline by a greater percentage.  As an example, in 2008, when the general stock market declined –37% as reflected in the S&P 500 (full year decline), the XAU gold stock index declined -66% within the period from March 2008 to October 2008.

We don’t know which indication will take precedence.  Therefore, we are opting for the most conservative stance possible.  We’re waiting for the stock market to confirm the Dow Theory bear market indication or quickly come up with a bull market indication.  We’re holding out for the possibility that gold stocks will provide the second opportunity to buy as has been indicated in our May 27th transaction review.

Questions or thoughts?  Let us know, we’ll do our best to provided a thoughtful response.

U.S. Dividend Watch List: June 1, 2012

Below are 42 companies on our U.S. Dividend Watch List that are within 11% of their respective 52-week lows. Stocks that appear on our watch lists are not recommendations to buy. Instead, they are the starting point for doing your research and determining the best company to buy. Ideally, a stock that is purchased from this list is done after a considerable decline in the price and rigorous due diligence.

Symbol Name Price % Yr Low P/E EPS (ttm) Dividend Yield Payout Ratio
CHRW C.H. Robinson 56.89 0.12% 21.23 2.68 1.32 2.32% 49%
UNM Unum Group 19.3 0.21% 25.39 0.76 0.42 2.18% 55%
FNFG First Niagara 7.74 0.26% 12.90 0.6 0.32 4.13% 53%
BMO Bank of Montreal 52.02 0.37% 9.32 5.58 2.72 5.23% 49%
WAG Walgreen Co. 29.93 0.44% 10.22 2.93 0.90 3.01% 31%
TDS Telephone & Data 19.45 0.62% 10.18 1.91 0.49 2.52% 26%
COP ConocoPhillips 51.19 1.05% 5.59 9.16 2.64 5.16% 29%
EXPD Expeditors International 37.45 1.33% 21.65 1.73 0.56 1.50% 32%
TR Tootsie Roll Industries Inc  21.96 1.53% 29.28 0.75 0.32 1.46% 43%
CRR Carbo Ceramics, Inc. 75.73 1.54% 13.45 5.63 0.96 1.27% 17%
NFG National Fuel Gas Co. 43.14 2.76% 16.98 2.54 1.42 3.29% 56%
ANAT American National Insurance 67.53 2.77% 9.50 7.11 3.08 4.56% 43%
AMAT Applied Materials Inc. 10.01 3.14% 9.91 1.01 0.36 3.60% 36%
BDX Becton, Dickinson and Co. 72.2 3.75% 13.15 5.49 1.80 2.49% 33%
THFF First Financial Corp. 27.09 3.99% 9.96 2.72 0.94 3.47% 35%
CWT California Water Service 17.36 4.26% 20.19 0.86 0.63 3.63% 73%
JNJ Johnson & Johnson  61.78 4.57% 16.93 3.65 2.44 3.95% 67%
MATW Matthews International Corp.  29.99 4.97% 12.55 2.39 0.36 1.20% 15%
NJR New Jersey Resources Corp. 41.63 5.13% 13.92 2.99 1.52 3.65% 51%
APD Air Products & Chemicals, Inc. 76.88 6.39% 13.83 5.56 2.56 3.33% 46%
PG Procter & Gamble Co.  61.55 6.93% 18.88 3.26 2.25 3.66% 69%
SRCE 1st Source Corp.  20.565 7.67% 10.28 2 0.64 3.11% 32%
UTX United Technologies Corp. 72.02 7.70% 15.16 4.75 1.92 2.67% 40%
JW-A John Wiley & Sons Inc. 45.16 7.81% 14.34 3.15 0.80 1.77% 25%
CAH Cardinal Health, Inc.  40.53 7.99% 13.74 2.95 0.95 2.34% 32%
MCD McDonald's Corp.  86.71 8.39% 16.21 5.35 2.80 3.23% 52%
LM Legg Mason, Inc.  24.27 8.54% 15.76 1.54 0.44 1.81% 29%
WEYS Weyco Group, Inc.  22.67 8.89% 15.96 1.42 0.68 3.00% 48%
TMP Tompkins Financial Corp. 36.35 8.93% 11.73 3.1 1.44 3.96% 46%
HNZ HJ Heinz Co. 52.51 9.01% 18.42 2.85 2.06 3.92% 72%
MSEX Middlesex Water Company  18.03 9.21% 22.82 0.79 0.74 4.10% 94%
OMI Owens & Minor, Inc. 28.33 9.51% 15.57 1.82 0.88 3.11% 48%
SJW SJW Corp. 22.91 9.77% 20.10 1.14 0.71 3.10% 62%
IBKC IBERIABANK Corp.  46.67 9.79% 23.45 1.99 1.36 2.91% 68%
STBA S&T BanCorp., Inc.  16.7 9.80% 12.28 1.36 0.60 3.59% 44%
SYY Sysco Corp. 27.55 9.80% 14.13 1.95 1.08 3.92% 55%
AROW Arrow Financial Corp.  23.62 9.86% 12.63 1.87 1.00 4.23% 53%
PPL PP&L Corporation 27.47 9.88% 9.71 2.83 1.44 5.24% 51%
GS Goldman Sachs Group, Inc.  92.64 9.93% 13.70 6.76 1.84 1.99% 27%
CLX Clorox Co. 69.36 9.99% 17.21 4.03 2.56 3.69% 64%
BMS Bemis Co Inc 30.11 10.66% 17.92 1.68 1.00 3.32% 60%
CAG ConAgra Foods, Inc. 24.59 10.77% 13.15 1.87 0.96 3.90% 51%
42 Companies

Watch List Summary

CH Robinson (CHRW) tops our list again this week. We will continue to stress the weakness in the Transportation index because of the bear market signal as noted from our call on May 19th.  As such, anyone interested in purchasing this stock needs to allocate at least three stage purchases at each 10% decline.

Bank of Montreal (BMO) has broken its 52-week low based on the closing price.  The company is of particular interest to us and will be updating our reader on its altimeter this week.  Based on IQ Trend, anytime the stock breach the 4.7% yield mark, it is deem undervalued.  Current yield of 5.23% suggest that the company is undervalue by 11%.  More on Bank of Montreal in last week’s list.

There’s no need to introduce Walgreen (WAG).  The company is at its historically cheapest level.  That fact alone hasn’t convinced Morningstar.com to rate this stock favorably.  The research firm suggests that investor to buy the shares at the $21 range but has a fair value at $35.  The analyst at Morningstar.com is concerned about the competitive edge Walgreen has to face with consolidation in the industry.  As such, they see margin contraction coming.  Value Line Investment Survey also cited some of the same issues but they placed a more favorable view on Walgreen based on market size and its ability to generate cash flow.  Value Line expects Walgreen to trade around 11.5x cash flow.  With 2013 estimated cash flow per share of $4.30, we have a fair value at $49.45.  That figure is in line with our valuation model.

Carbo Ceramics (CRR) continue to struggle and we expect it to keep trading down.  Our Altimeter study shows that stock could hit $62.40 which would make a great buying opportunity.

We’ve added Applied Materials (AMAT) because we view this company as a dividend contender.  The company started paying dividends in 2005 and has been raising that at 21% annually.  While that rate of increase isn’t sustainable, we believe that the 3.6% yield provides a good cushion for such a cyclical stock.  We do expect more weakness in the name and could easily see the price fall to the $7-8 range.  Semiconductor equipment is in a cyclical downturn and we are closer to the bottom in sales growth.  The dividend payout ratio of 35% suggests a good margin of safety.

Top Five Performance Review

In our ongoing review of the NLO Dividend Watch List, we have taken the top five stocks on our list from June 3, 2011 (not published) and have check their performance one year later. The top five companies on that list can be seen in the table below.

Symbol Name 2011 Price 2012 Price % change
HTLF Heartland Financial USA, Inc.  13.49 18.12 34.32%
CHFC Chemical Financial Corp.  18.31 19.31 5.46%
TGT Target Corp. 47.4 57.2 20.68%
WABC Westamerica BanCorp.  47.53 43.68 -8.10%
BXS BanCorp.South Inc. 11.75 12.85 9.36%
Average 12.34%
DJI Dow Jones Industrial 12,151.26 12,118.57 -0.27%
SPX S&P 500 1,300.16 1,278.04 -1.70%

NLO_20120601

As has been typical of our U.S. Dividend Watch List, the performance in the last year was stellar.  Our top 5 stocks gained more than +12% on both the Dow Jones Industrial Average and S&P 500.  All but one company reached our goal of gaining +10% within one year.

Dow Jones Industrial Average: Where To Now?

Dow Theory Review

  • On August 2, 2011 (article here), we said that a new bear market had begun.
  • On August 9, 2011 (article here), we announced that, based on the closing price of August 8, 2011, a bear market rally would ensue (stock prices would rise.)  That call was 2 months ahead of the ultimate market bottom set in October 2011 and off the actual low by 1.43%.
  • On March 16, 2012 (article here), we warned about the lack of participation of most stocks in the rise of the stock market from the 2009 low.  Additionally, we cited the divergence between the Dow Jones Industrial Average and Dow Jones Transportation Average as confirmation that we were still in a bear market.  This was less than 1% from the actual top in the market.
  • On May 19, 2012 (article here), we pronounced that the bear market rally had ended.  This call came 7.41% below the actual peak in the market on May 1, 2012.

Charting a Path for the Dow

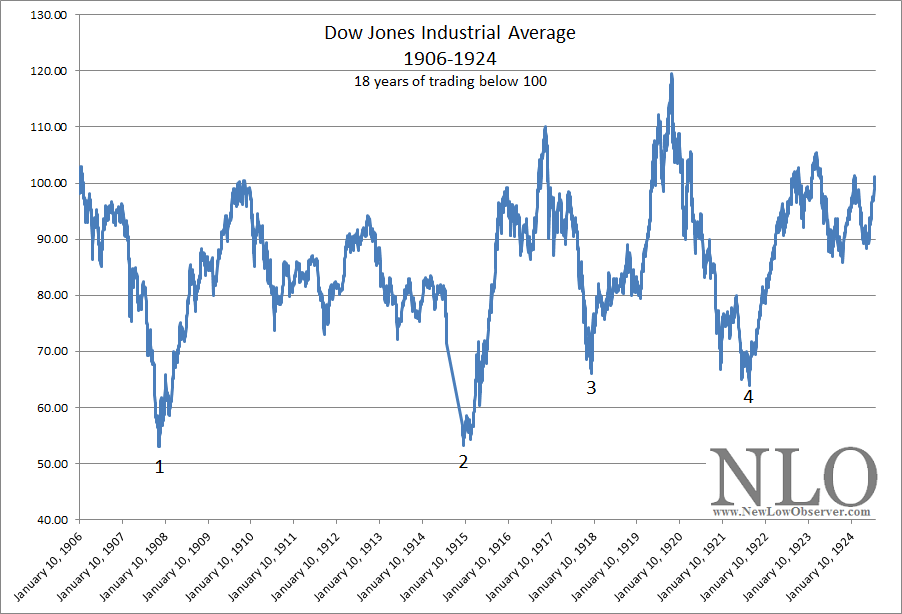
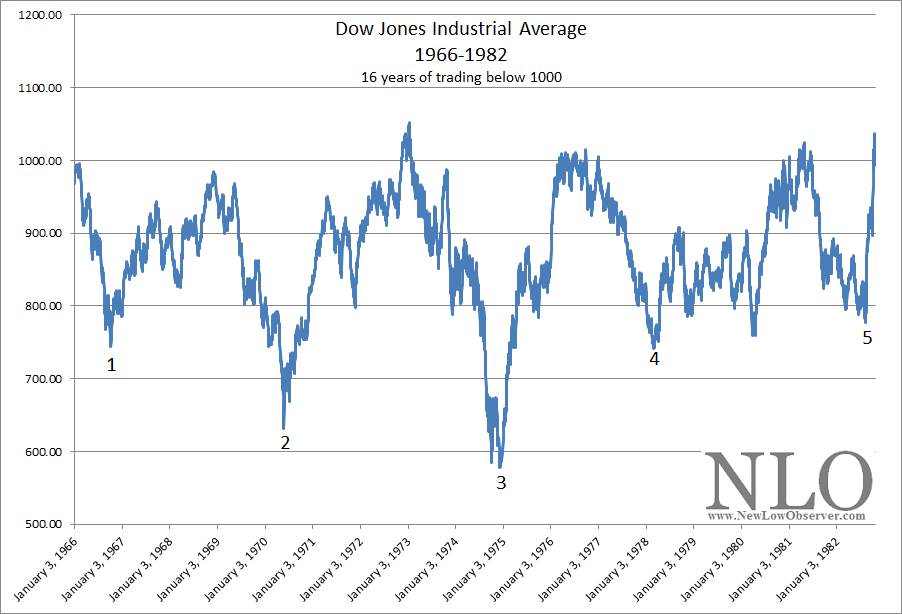
Now comes the challenge of determining the downside targets for the Dow Jones Industrial Average.  To accomplish this task, we’ve gone back to the secular bear markets of 1906-1924 and 1966-1982 for some insight as to what might occur going forward.  It is important to understand that the signature of a secular bear market is that it will not increase very much above the initial peak and declines significantly below the initial peak multiple times.

In the chart below, we have the price action of the Dow Jones Industrial Average from 1906 to 1924.

image

In the chart below, we have the price action of the Dow Jones Industrial Average from 1966 to 1982.

image

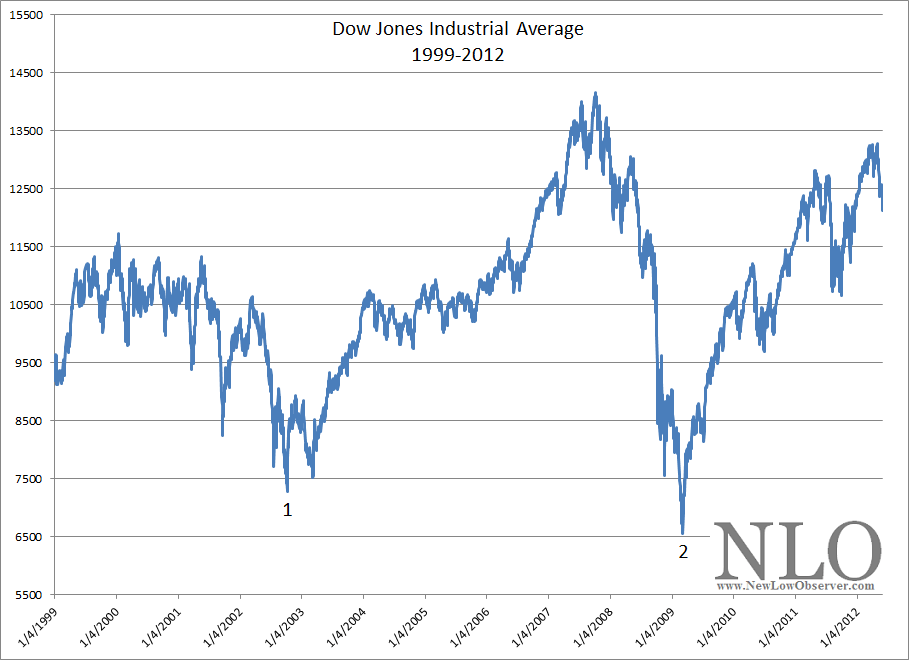
There is considerable debate about where the peak of the current secular bear market began.  Although we believe that the secular trend began at the 2007 peak,  we’re being conservative by considering that the most recent secular bear market began at the 2000 peak, as represented in the chart below.

image

Beneath each trough is the number corresponding to the major declines within the secular bear market. In each chart there are at least three major market declines while the peaks remain in close proximity to the original market peak.

It is our view that the first decline of the Dow Jones Industrial Average in the secular bear market trend later becomes a minimum downside target.  In the current market, we believe that the Dow Jones Industrial Average will revisit the 8,200 level.  If the Industrials were to revisit the 8,200 level, the total decline would be approximately -32% from the closing price of June 1, 2012.

Carbo Ceramics Altimeter

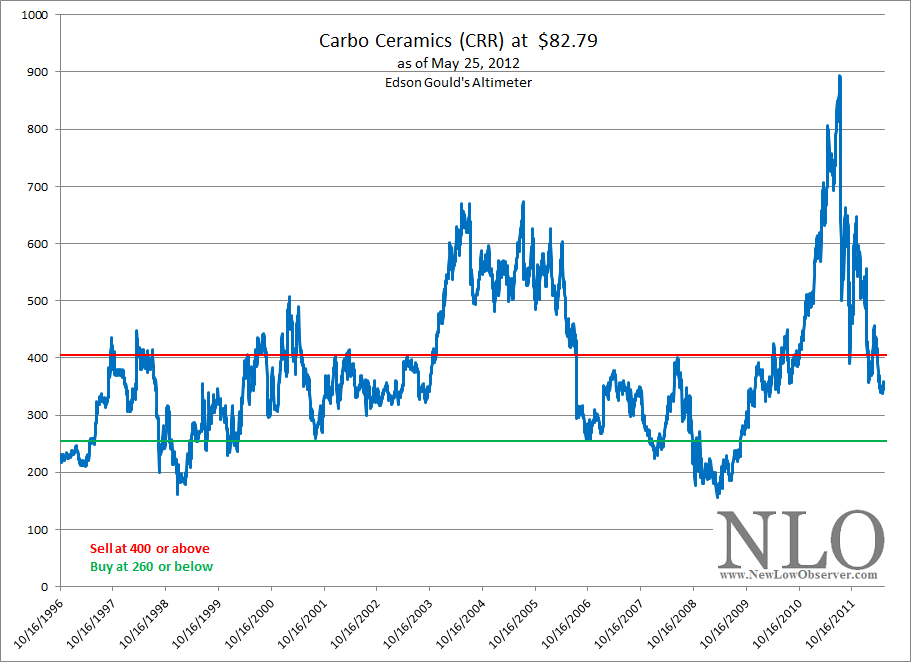
Below is the Altimeter for Carbo Ceramics (CRR) which is ranked number 7 on our May 25, 2012 U.S. Dividend Watch List (found here).  Using Edson Gould’s Altimeter, we have arrived at the conclusion that Carbo Ceramics (CRR) should be bought (green line) any time the Altimeter declines to 260 and below and should be sold (red line) whenever the Altimeter rises to 400 and above.

image

Below is a table which outlines the actual price and date when Carbo Ceramics’ Altimeter rises or falls to the indicated levels.

Date Altimeter level stock price buy/sell % change
6/13/1997 257.40 12.87 buy 59%
10/2/1997 410.80 20.54 sell -41%
8/27/1998 239.00 11.95 buy 67%
4/24/2000 399.60 19.98 sell -22%
8/20/2001 258.33 15.50 buy 56%
1/3/2002 403.00 24.20 sell 27%
10/3/2006 256.16 30.74 buy 82%
6/23/2008 401.50 56.21 sell -21%
10/6/2008 258.35 43.92 buy 65%
4/15/2010 403.55 72.64 sell ????????
???????? 260.00 62.40 buy  

Based on the current dividend for Carbo Ceramics, we have anticipated that the stock price will decline to $62.40 before the next buy indication is triggered.  However, as we’ll describe below, there are some careful considerations of what you give up when deciding to buy Carbo Ceramics based on Edson Gould’s Altimeter.

First, it is important to note that in all except one instance, January 3, 2002, Carbo Ceramics had reasonable gains when a buy indication was triggered and avoided losses when the sell indication was triggered.

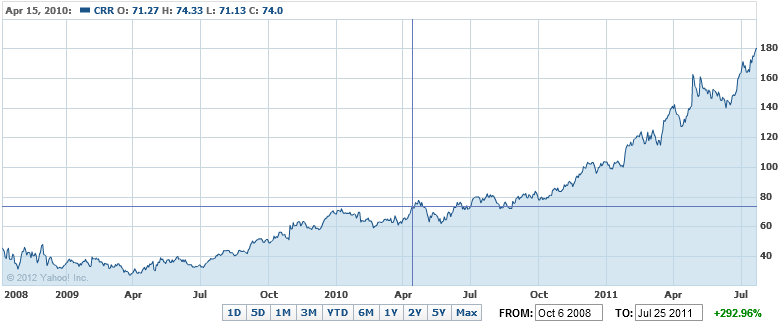
As an example, if you bought in October 6, 2008 and sold on April 15, 2010 (at crosshair below), you only gained 65% and you would have missed the additional 143% rise in the stock’s price, as seen in the following chart:

image

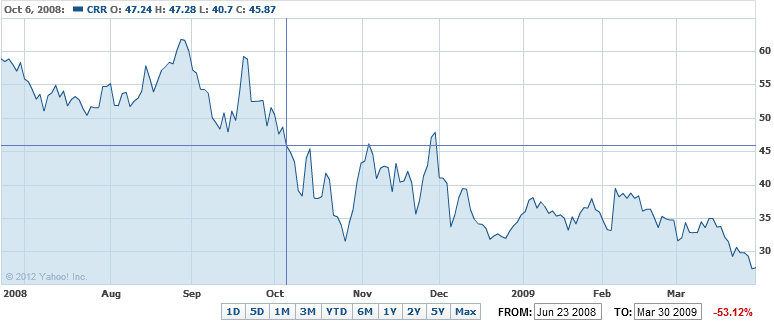
Likewise, the June 23, 2008 sell signal at $56.21 didn’t account for the –53% decline that occurred afterwards.  Instead,  Carbo Ceramics declined -21% from the $56.21 level by the time the next buy signal was indicated on October 6, 2008 (at crosshairs below).

image

So what does all this mean, “buy at the 160 level” and “sell at the 400 level” in the Altimeter?  For the New Low Team, it means that if we can gain an average of +60% in 1-1/2 years with each buy and sell cycle then we will do quite well if we can avoid all of the huge losses, at the expense of missing the huge gains.

Who is Edson Gould?

“Edson Gould spent over 60 years working in and studying financial markets. Gould studied the arts at Princeton, engineering at Lehigh (from where he graduated in 1922), and finance at New York University. In 1922, after working for a short time at Western Electric, he joined Moody’s Investor Service as an analyst and later was editor of Moody’s Stock Survey, Bond Survey, and Advisory Reports. In 1948, he began at Arthur Wiesenberger & Company, where he developed and edited the well-known Wiesenberger Investment Report and became a senior partner. He also was Research Director at E. B. Smith (which later became Smith Barney), and worked for Nuveen.”

(source: Market Technicians Association. Gould, Edson Beers, Knowledge Base. Accessed April 26, 2012. link MTA reference.)

“Market technician Edson Gould always laughed at the idea of having a significant influence on the stock market, but his predictions were the most precise around. He pinpointed major bull markets and prophesied bottom-out markets as if he had his own peephole into the future. But in place of a crystal ball and wacky off-the-cuff schemes, his were smart, intensely researched and time-tested theories that made him a legend in the investment community.”

(source: Fisher, Kenneth L.. 100 Minds That Made the Market. Business Classics, Woodside, CA. 1993. page 320.)

Transaction Review on NUGT, A Simple Lesson Learned

This posting is in response to a great question posted by Sandesh.  On May 25th, Sandesh asked, “Any update on NUGT now that it is recovered?”  The chart below should say it all:

image

Our May 3rd transaction alert (found here) informed readers that we had taken a position in NUGT based on our Gold Stock Indicator falling below both the short and long term buy indications.  In our initial transaction alert, we set the parameters when we would buy more and/or sell our position.  Then, on May 6th, we revised and expanded the parameters to buy and sell (found here), based on our confidence of the indicator and the investment product.

Our revised parameters said the following:

  1. 50% of the amount we wish to invest now (done)
  2. 50% of the amount we wish to invest after a decline of -20%
  3. we’re exiting the transaction after a total loss of -40% or greater
  4. we’re exiting the transaction when the next short-term signal buy DUST is indicated.

We entered NUGT at $11.13.  If we followed our rules, as laid out in our revised parameters, we would have bought more NUGT at $8.96 and sold out of the transaction if the ETF fells as low as $6.65.  Our average gain would have been +13%.  Had we remained in the position without buying additional amounts then we’d have a gain of +3.14%.

We believe that we have learned the lessons from our speculative forays with NUGT.  The first lesson is, “stick to the plan.”  We expect to implement the same parameters in our next transaction for both NUGT or DUST. 

Note: Thanks go to Sandesh for initiating our response.

Our Current Gold Stock Indicator Analysis:

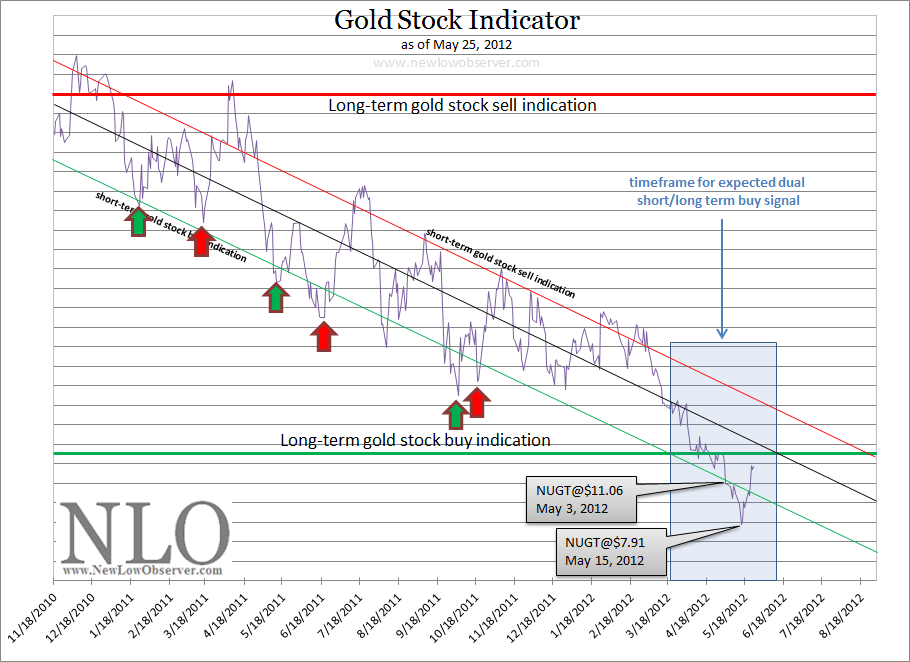
In the chart below, you will notice that in all instances of an initial “short-term buy indication” [green arrow] (except August 8, 2011),  the Gold Stock Indicator was followed by a second opportunity to buy [red arrow] NUGT, sometimes at lower levels.

image

It is important to note that our assessment of a second opportunity to buy NUGT only occurs when the indicator does not immediately go to the short-term gold stock sell indication.  We believe that, due to our Dow Theory indication that the bear market rally has ended (found here), we are on the cusp of a major stock market decline. 

As we’ve stated many times in the past, gold and gold stocks generally cannot move higher in the face of a declining stock market.  Therefore, we believe that gold and gold stocks are enjoying a temporary advance and will ultimately succumb to the forces of general decline in stock market.  Therefore, we’re willing to accept the lesson of our latest NUGT transaction for either the second signal to buy NUGT or the next signal to buy DUST.

Note: In the chart above, we first calculated the expected downside target back in our Feb. 7, 2012 posting (found here).  We’re surprise that, at least for now, that our assessment was correct.  We’re hopeful that our analysis of a “double bottom” is correct as well.

U.S. Dividend Watch List: May 25, 2012

Below are 26 companies on our U.S. Dividend Watch List that are within 11% of their respective 52-week lows. Stocks that appear on our watch lists are not recommendations to buy. Instead, they are the starting point for doing your research and determining the best company to buy. Ideally, a stock that is purchased from this list is done after a considerable decline in the price and rigorous due diligence.

Symbol Name Price % Yr Low P/E EPS (ttm) Dividend Yield Payout Ratio
CHRW C.H. Robinson 59.69 1.63% 22.27 2.68 1.32 2.21% 49%
UNM Unum Group 20.13 2.08% 26.49 0.76 0.42 2.09% 55%
BMO Bank of Montreal 52.99 2.24% 9.41 5.63 2.85 5.38% 51%
NFG National Fuel Gas 43.37 2.65% 17.07 2.54 1.42 3.27% 56%
COP ConocoPhillips 52.11 2.86% 5.69 9.16 2.64 5.07% 29%
TDS TDS 19.89 2.90% 10.41 1.91 0.49 2.46% 26%
CRR Carbo Ceramics 82.79 3.18% 14.71 5.63 0.96 1.16% 17%
WAG Walgreen Co. 31.36 3.36% 10.70 2.93 0.90 2.87% 31%
EXPD Expeditors Int'l 38.47 3.47% 22.24 1.73 0.56 1.46% 32%
TR Tootsie Roll Industries 22.51 4.07% 30.01 0.75 0.32 1.42% 43%
ANAT American Nat'l Insurance 68.95 4.93% 9.70 7.11 3.08 4.47% 43%
MATW Matthews Int'l 30.08 5.29% 12.59 2.39 0.36 1.20% 15%
CWT California Water Service 17.61 5.77% 20.48 0.86 0.63 3.58% 73%
JNJ Johnson & Johnson  62.51 5.81% 17.13 3.65 2.44 3.90% 67%
BDX Becton, Dickinson 74.42 6.94% 13.56 5.49 1.80 2.42% 33%
JW-A John Wiley & Sons 45.01 7.45% 14.29 3.15 0.80 1.78% 25%
NJR New Jersey Resources 42.58 7.53% 14.24 2.99 1.52 3.57% 51%
OMI Owens & Minor, Inc. 27.93 7.96% 15.35 1.82 0.88 3.15% 48%
PG Procter & Gamble Co.  62.49 8.56% 19.17 3.26 2.25 3.60% 69%
AMAT Applied Materials Inc. 10.541 8.66% 10.44 1.01 0.36 3.42% 36%
UTX United Technologies 73.02 9.20% 15.37 4.75 1.92 2.63% 40%
THFF First Financial Corp. 28.61 9.83% 10.52 2.72 0.94 3.29% 35%
PPL PP&L Corporation 27.52 10.08% 9.72 2.83 1.44 5.23% 51%
MSEX Middlesex Water  18.21 10.30% 23.05 0.79 0.74 4.06% 94%
WEYS Weyco Group, Inc.  22.97 10.33% 16.18 1.42 0.68 2.96% 48%
CLX Clorox Co. 69.59 10.36% 17.27 4.03 2.56 3.68% 64%
26 Companies

Watch List Summary

CH Robinson (CHRW) tops our list this week. But we caution against this name as well as the sector because of the Dow Theory trend (indicated here). We briefly stated our case for the Transportation Index in our May 18 Nasdaq Watch List.

ConocoPhillips (COP) rose 4% over the week after the split off their chemical division.  We’d expect the dividend to be relatively safe but we questioned the growth potential of the exploration and production business.  As the resource pool shrinks (oil), more pressure will be placed on the company to build up its reserves.  Morningstar.com placed a fair value at $58 which is 11% above its current price.  More on ConocoPhillips and Phillips 66 in this article.

Carbo Ceramics (CRR) remain under pressure. Its earning estimate for 2012 has been revised downward by Valueline.  They are now expect to earn $6.10 per share versus previously estimated of $7.55.  Fair value however is estimated to be at 20x cash flow per share (CF).  Valueline estimate 2012 Price/Cash Flow to come in around $7.70 which places the fair value at $154.  The Morningstar.com figures show that Carbo Ceramics is currently trading at 17x CF which is about a 10% discount to fair value.

Canadian & American investors should be made aware of Bank of Montreal (BMO), currently #3 on our list, which is featured in the latest edition of Bloomberg Markets article titled "World's Strongest Banks", which says following the say:

"Bank of Montreal (BMO), Canada’s fourth-largest lender, also ramped up its presence in the U.S. by buying Marshall & Ilsley Corp., a Milwaukee-based bank, last year for $4.19 billion. Prior to that, its main U.S. asset had been the small Chicago-based Harris Bank franchise it bought in 1984."

Bank of Montreal's acquisition of Marshall & Ilsley (MI) is significant because MI had a 36-year history of dividend increases before being taken over.  This suggest that BMO has aquired a significant asset at a severely undervalued price.  Even before the financial crisis, we never had much interest in a banking stock.  However, high quality banks like Bank of Hawaii (BOH) and Bank of Montreal (BMO) must be considered at the right price.  Our transaction alerts will tip you off to when we begin our campaign of buying BMO.

Top Five Performance Review

In our ongoing review of the NLO Dividend Watch List, we have taken the top five stocks on our list from May 27, 2011 and have check their performance one year later. The top five companies on that list can be seen in the table below.

Symbol Name 2011 Price 2012 Price % change
HTLF Heartland Financial USA, Inc.  14.09 19.13 35.77%
TGT Target Corp. 49.37 57.62 16.71%
CHFC Chemical Financial Corp.  19.29 20.89 8.29%
ANAT American National Insurance 76.74 68.95 -10.15%
WABC Westamerica BanCorp.  49.87 45.32 -9.12%
Average 8.30%
DJI Dow Jones Industrial 12,441.58 12,454.83 0.11%
SPX S&P 500 1,331.10 1,317.82 -1.00%

NLO_Div_2011.5.27

We highlighted Heartland Financial (HTLF), Target (TGT), and American National Insurance (ANAT).  Our strong conviction in American National didn’t pan out as we expected and the stock fell -10%.  Including the dividend of 4%, the net loss for American National Insurance would be -6%.  Heartland Financial was trading at a 7% discount to its book value but traded up to 1.1x book value.  Target never traded up to 1% yield mark that we anticipated.  However, the gain of +16.7% was greatly appreciated. Ironically, Pershing Square's exit from Target marked the bottom of the stock's price.

Three out of the five companies, Heartland Financial, Target, and Chemical Finance, achieved our goal of +10% within one year.

In the News: May 27, 2012

Why Intel Deserves Another Look at Barron’s

GMCR Director Steps Down; Company Shrinks Board at Barron’s

NetApp Off 13%: FBN Ups to Buy on Cash, Takeout Value at Barron’s

Buybacks Pressuring Investment-Grade Companies at Barron’s

Southwest’s International Adventure Wins Fans at Barron’s

Harry’s Dented ETF To Shut Down at Barron’s

Germany to the Euro: Drop Dead at The Atlantic

'What if Facebook Debuted at $15 and Popped to $35? Nobody Would Complain' at The Atlantic

The Best Way to Tell If People Are Smack-Talking Your Company on Twitter at The Atlantic

The Right Way to Debate Someone on the Internet at The Atlantic

Smack! The BRICs Hit a Wall of Their Own Making at The Atlantic

Why the Internet Makes It Impossible to Stop Giant Wall Street Losses at The Atlantic

Does It Matter Where You Go to College? At The Atlantic

How the Professor Who Fooled Wikipedia Got Caught by Reddit at The Atlantic

The Wacky World of Prices: Rental Cars, Hollywood, and HBO at The Atlantic

Timeshare Prices Plummet to $1 at SmartMoney

Skepticism grows around Medco/Express Scripts deal at Reuters

Without its PBM Partner, Walgreen is a Sell: Citi at Barron’s

JP Morgan to Settle Overdrafting Case at Barron’s

What a Quarter for GMCR! Can it be Repeated? at Barron’s

Facebook gets an “A” in Financial Reporting at Grumpy Old Accountants

Pimco: Foreclosure Deal Cheap for Banks at Bloomberg

I Didn't Tell Facebook I'm Engaged, So Why Is It Asking About My Fiancé? at The Atlantic

IRS to Mom and Pop: Drop Dead at The Atlantic

Why Professional Licenses Are a Barrier to Growth at The Atlantic

Authors of Kindle Singles Are Raking in Tens of Thousands of Dollars at The Atlantic

The 400% Man at Smart Money

The Financial Consequences of Too Many Men at University of Minnesota


Canadian Dividend Watch List: May 25, 2012

This is a list of Canadian dividend stocks that currently, or in the past, had a history of consecutive dividend increases. For those wishing to find the most complete fundamental information on these companies, we recommend visiting one of Canada’s leading financial websites, the Financial Post (found here). However, Yahoo!Finance probably has the better long-term charts and historical dividend data.

Symbol Name Price P/E EPS Price/Book % Chg Low Go to FP
AGF-B.TO AGF Management Limited $11.65 8.97 1.13 0.95 0.95%
SJR-B.TO Shaw Communications, Inc. $19.52 18.86 1.44 2.59 2.90%
IGM.TO IGM Financial Inc. $40.10 12.17 3.45 2.35 3.59%
IAG.TO Indu'l Alliance Insur. and Finan'l Services $25.83 8.58 1.13 0.97 4.36%
TCL-A.TO Transcontinental Inc. $9.76 6.9 0.23 0.67 4.50%
EMP-A.TO Empire Co. Ltd. $56.00 10.24 4.39 1.15 6.54%
BNS.TO The Bank Of Nova Scotia $50.95 11.19 4.74 2.02 7.17%
CCA.TO Cogeco Cable Inc. $45.88 - 0.24 1.95 8.00%
PWF.TO Power Financial Corporation $25.66 11.53 2.53 1.57 8.64%
HCG.TO Home Capital Group Inc. $43.03 7.63 5.74 1.8 8.83%
CWB.TO Canadian Western Bank $26.18 12.64 2.16 1.81 9.08%

Watch List Summary

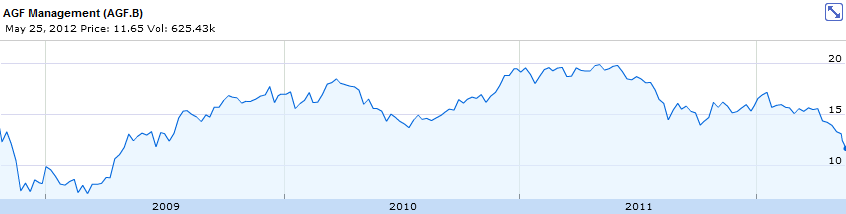
AGF Management (AGF.B): (According to the Financial Post, “AGF Management Limited is a wealth management corporation whose principal subsidiaries provide mutual fund management and distribution, trust products and services, investment advisory services and third-party fund administration services for clients.”

AGF is skating on thin ice with a dividend payout ratio of 94%.  This means that if the company were to experience any decline in earnings (likely) then there is the prospect of the company cutting the dividend.  Currently, AGF has a dividend yield of 9.30% which suggests that a dividend cut isn’t too far away if things don’t improve soon.

Currently, $11.13 is the point that will either make or break the stock price. If AGF.B cannot stay above $11.13 then there is a good chance that the stock will revisit the prior low of $6.46, a decline of –42%.  According to Dow Theory, AGF has the following downside targets:

  • $11.13
  • $9.58
  • $8.03
  • $6.46

image

Industrial Alliance Insurance and Financial Services (IAG.TO):  According to Yahoo!Finance, IAG.TO is “a life and health insurance company, [which] engages in the provision of various insurance products, savings and retirement plans, and other financial products and services in the United States and Canada.”

IAG.TO has a dividend yield of 3.80% and a payout ratio of 89%.  Again, with such a narrow margin of safety, in terms of the dividend payout ratio, investors should not be surprised if a dividend cut were to take place.   According to Dow Theory, IAG.TO has the following downside targets:

  • $32.55
  • $23.20
  • $13.85

With IAG.TO trading at $25.83, the $23.20 price is a critical support level for the stock.  This stock would be considered for purchase by us when, and if, it reaches the $18.50 level.  According to Dow Theory, IAG.TO has a fair value of $27.87.

Watch List Performance Review

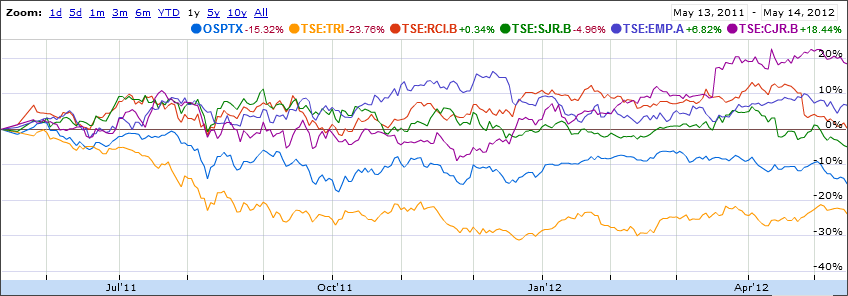
In our ongoing review of the NLO Canadian Dividend Watch List, we have taken the top five stocks from our May 13, 2011 list (found here) and have checked their performance, approximately one year later, as compared to the S&P/TSX Composite index. The top five companies from that list can be seen in the table below.

Symbol
Name 2011 2012 % change
TRI Thomson Reuters 37.78 28.51 -24.54%
RCI.B Rogers Comm. 35.82 35.5 -0.89%
SJR.B Shaw Comm. 20 19.11 -4.45%
EMP.A Empire Co. Ltd. 54.45 57.83 6.21%
CJR.B Corus Ent. Inc. 20.44 23.64 15.66%
      Average: -1.60%
         
S&P/TSX Toronto Stock Exchange     -15.32%

image

While our watch list was in the negative at the end of the year, it did well compared to the Toronto Stock Exchange over the same period.  In fact, 4 of the five stocks on our list were able to achieve our goal of gains of +10% in less than 6 months.

NetApp: Dow Theory Gets It Right

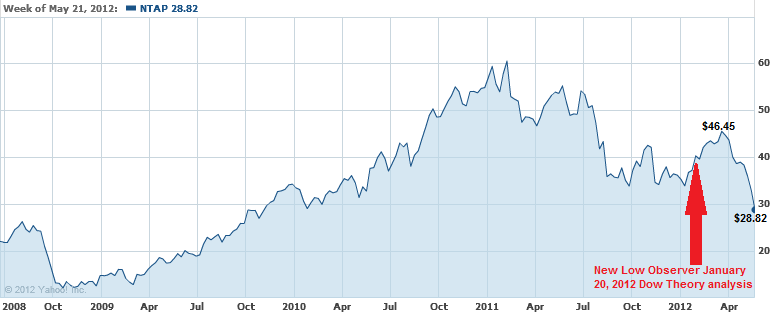
On May 24, 2012, NetApp (NTAP) was hammered down –12.29% after it was announced that the company forecasted lower earnings.  The decline of NetApp comes as no surprise to us as we ran our analysis of the company in our January 20, 2012 Nasdaq 100 Watch List (found here).  In our Dow Theory analysis of NTAP, we said the following:

“According to Dow Theory, the current downside targets are $28.02, $22.52 and $17.02. Based on the current price of $36.85, NTAP could fall by 53% in the worst case scenario. According to Dow Theory, NTAP has upside targets of $44.52, $50.02 and $55.52.

The Punchline: After a 39% decline in price, NetApp (NTAP) is a prime candidate for a two transaction purchase. The first purchase should take place starting at $30. The second purchase should take place around $23.47. Based on the market capitalization, NTAP may actually be a buyout candidate.”

Dow Theory set accurate parameters for the upside and downside targets.  After our January 20, 2012 posting, NTAP rose as high as $46.45 and has retrenched as low as the current closing price of $28.82.  Although we said that NTAP is a buy at prices below $30, as indicated above, our macro view on the markets are negative at the present time as found in our May 19, 2012 (found here) Dow Theory analysis.

image

It appears that NTAP will easily achieve the Dow Theory downside target of $22.52 and may achieve a rebound at the $20 level.  However, because Dow Theory suggests that the overall market will decline further, we believe that the first purchase of NTAP could reasonably take place at $22.52 or below, instead of $30 or below.

We will reassess NTAP in terms of the general market when, and if, the price declines to the $22.52 price.

Nasdaq 100 Watch List: May 18, 2012

Below are the Nasdaq 100 companies that are within 10% of their respective 52-week lows. Stocks that appear on our watch lists are not recommendations to buy. Instead, they are the starting point for doing your research and determining the best company to buy. Ideally, a stock that is purchased from this list is done after a considerable decline in the price and rigorous due diligence.

Symbol Name Price P/E EPS Yield Price/Book % from Low
FSLR First Solar, Inc. 13.66 - -7.01 0 0.4 0.08%
GMCR Green Mountain Coffee 24.05 11.56 2.08 0 1.74 0.17%
CHRW CH Robinson Worldwide 58.88 21.96 2.68 2.2 7.78 0.26%
EXPD Expeditors Int'l of Washington 37.32 21.57 1.73 1.5 3.8 0.38%
SYMC Symantec Corporation 14.74 9.39 1.57 0 2.12 0.41%
CTRP Ctrip.com International Ltd. 18.91 18.01 1.05 0 2.59 0.53%
SNDK SanDisk Corp. 31.52 8.81 3.58 0 1.12 0.59%
WYNN Wynn Resorts Ltd. 101.94 21.62 4.72 2 46.03 0.91%
RIMM Research In Motion Limited 10.99 4.95 2.22 0 0.58 0.92%
INFY Infosys Ltd. 42.87 14.29 3 1.3 3.69 0.97%
NTAP NetApp, Inc. 33.06 22.01 1.5 0 3.07 0.98%
FOSL Fossil, Inc. 70.28 14.99 4.69 0 3.9 1.02%
EA Electronic Arts Inc. 14.1 61.3 0.23 0 1.91 1.95%
APOL Apollo Group Inc. 32.02 6.97 4.6 0 3.54 3.52%
ORCL Oracle Corporation 25.61 13.42 1.91 0.9 3.05 3.60%
MCHP Microchip Technology Inc. 30.49 18.48 1.65 4.5 3 4.06%
VMED Virgin Media, Inc. 21.48 53.17 0.4 0.7 7.83 4.68%
GOLD Randgold Resources Limited 76.45 16.63 4.6 0.5 3.06 4.86%
NVDA NVIDIA Corporation 12.08 14.75 0.82 0 1.82 5.32%
AMAT Applied Materials Inc. 10.36 10.23 1.01 3.5 1.55 6.80%
VOD Vodafone Group plc 26.1 12.08 2.16 3.6 1.01 7.36%
LRCX Lam Research Corporation 37.57 16.62 2.26 0 1.73 7.93%
ALTR Altera Corp. 33.23 16.45 2.02 1 3.46 9.35%
SPLS Staples, Inc. 13.07 9.39 1.39 3.3 1.29 9.46%

Watch List Summary

We’d like to address the first four companies on our list with a rating of AVOID or SELL for the following reasons:

  • First Solar (FSLR):  We never believed in the attributes of the solar industry despite all the claimed benefits to the environment.  If a detailed examination of the solar industry was done for the period of 1970 to 1980, you would find that the reasons for the lack of success then is re-emerging today.  FSLR might be a great speculation, however, anyone wishing to buy the stock should be willing to accept 100% loss or avoid the stock altogether.  As was the case in the 1970’s, the “top tier” solar companies will probably get acquired by the major oil companies.  However, the timing of such an acquisition is too difficult for us to predict.  Therefore, the safest postures is to assume more downside risk with little sustainable upside opportunity.
  • Green Mountain Coffee Roasters (GMCR):  We’ve had a history of calculating the downside risk associated with GMCR.  On October 25, 2011 (found here), we published Edson Gould’s Speed Resistance Lines [SRL] which indicated that the downside risk for the stock was between $59.93 and $37.21 (at the time GMCR was trading at $64.75).  In that same posting we said that if GMCR were to fall below $37.21, then the next downside target is the absurdly low level of $3.  Even if $3 is never achieved, falling from the current price of $24.05 to $12.02 is too much pain to accept.
  • C.H. Robinson (CHRW) and Expeditors International of Washington (EXPD): Our recent Dow Theory (found here) indication pointing to an end to the bear market rally with the joint decline of the Dow Jones Industrial Average and Dow Jones Transportation Average means that large declines may lie ahead.  Since the Transportation Index has led the way up, it stand to reason, and experience, that the index will lead the way down.  We believe that CHRW and EXPD are in for more pain and faster than most other stocks because they are in the business of freight forwarding and logistics.

Companies that we’re excited to see on our watch list are as follows:

  • Microchip Technology (MCHP):  Microchip Technology first appeared on our watch list on March 20, 2010 (found here) at the price of $28.25.  Afterwards, MCHP rose as high as $41 by May 10, 2011.  On July 15, 2011, after the stock declined nearly -22% from the high, we suggested that MCHP would be too hard to ignore at such a high dividend yield. This recommendation was within 9% of the current 1-year low.  We will become serial acquirers of MCHP as the stock price declines further.
  • Applied Materials (AMAT), NVIDIA (NVDA), Altera (ALTR):   These chip stocks are runners-up in the chip stock sweepstakes.  We feels that accumulating of chip stocks with high ROA, ROE, profit margins, operating margins and low debt will prove highly profitable in both the intermediate and long term.

Watch List Performance Review

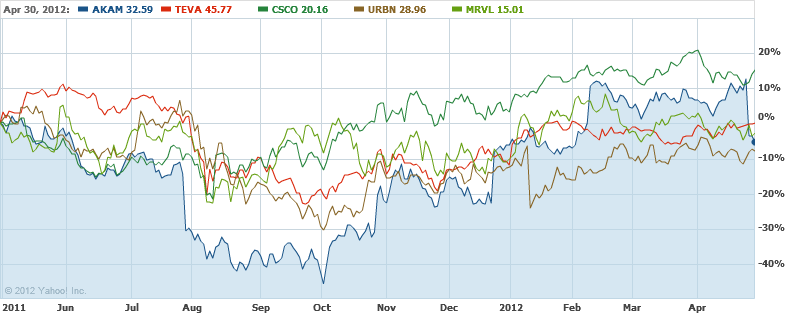
In our ongoing review of the NLO Nasdaq 100 Watch List, we have taken the top five stocks on our list from April 29, 2011 and have check their performance one year later. The top five companies on that list can be seen in the table below.

Symbol Apr-11 Apr-12 change
AKAM 34.43 32.59 -5.34%
TEVA 45.73 45.77 0.09%
CSCO 17.52 20.16 15.07%
URBN 31.47 28.96 -7.98%
MRVL 15.43 15.01 -2.72%
    Average -0.18%
       
Nasdaq 100     15.31%

image

No two ways about it, the stocks on our watch list got hammered big time.  The Nasdaq 100 index gained 15.31% while our top five stocks went nowhere.  However, three of the five stocks our goal of at least 10% within a year.  TEVA gained 10% in the first month before declining –20%.  CSCO gained +10% in six months while AKAM gained +10% in 9 months.