Author Archives: nlo-admin

U.S. Dividend Watch List: May 18, 2012

Watch List Summary

The stock market seems to be in a full bear mode now that the Dow and the Transport have breached its recent low. Despite better than expected housing starts and industrial production, the market fell for a 3rd week. The biggest internet IPO, Facebook (FB), couldn’t spur more buying on Friday. As such, our watch list expanded to include 35 companies that are within 11% of the low.

With current market re-entering bear mode, there is still investment values to be had. We keep going back to Walgreen (WAG) for the same reasons, its risk/reward profile is at historic low levels. The stock is trading just 3.2% above the low and $3o appears to be a good support level. The dividend payout ratio of 31% provides margin of safety of 69% against a decline in earnings. Our most conservative analysis puts fair value at the  $29.90.

A company that we haven’t seen in a while is Air Product & Chemicals (APD). We recommended the stock on September 29, 2008 (found here) after the stock sustained a decline of -42% from the 2008 high.  The specialty chemical company is estimated to be undervalue at 3.30%. We are willing to say that APD is undervalue at the current yield of 3.29%.  The payout ratio of 46% and estimated growth rate of 14% give us a hint that APD could be a great buy when the market makes a turn.

United Technologies (UTX) fell 16% since mid March. The stock has a strong support at $68 level but this cyclical name may have more downside to go if we at the beginning of the bear market. Based on IQ Trend, the current yield of 2.65% suggest that the company is undervalue.

Fore more detail on companies such as ConocoPhillips (COP), Carbo Ceramics (CRR), and Johnson & Johnson (JNJ), please refer to our May 4 post.

Below are the 35 companies that meet our criteria and are within 11% of the 52-week low:

Symbol Name Price % Yr Low P/E EPS (ttm) Dividend Yield Payout Ratio
COP ConocoPhillips 50.82 0.32% 5.55 9.16 2.64 5.19% 29%
EXPD Expeditors International 37.32 0.38% 21.57 1.73 0.56 1.50% 32%
NFG National Fuel Gas Co. 42.79 0.15% 16.85 2.54 1.42 3.32% 56%
CHRW C.H. Robinson Worldwide  58.88 0.26% 21.97 2.68 1.32 2.24% 49%
UNM Unum Group 19.9 0.91% 26.18 0.76 0.42 2.11% 55%
CRR Carbo Ceramics, Inc. 81.05 1.01% 14.40 5.63 0.96 1.18% 17%
ANAT American National Insurance 67.63 2.92% 9.51 7.11 3.08 4.55% 43%
WAG Walgreen Co. 31.31 3.20% 10.69 2.93 0.90 2.87% 31%
TR Tootsie Roll Inc.  22.39 3.51% 29.85 0.75 0.32 1.43% 43%
TDS TDS 20.05 3.72% 10.50 1.91 0.49 2.44% 26%
BMO Bank of Montreal 53.96 4.11% 9.85 5.48 2.85 5.28% 52%
JW-A John Wiley & Sons Inc. 43.75 4.44% 13.89 3.15 0.80 1.83% 25%
MATW Matthews Int'l Corp. 29.85 4.48% 12.49 2.39 0.36 1.21% 15%
CWT California Water Service 17.47 4.92% 20.31 0.86 0.63 3.61% 73%
BDX Becton, Dickinson 74.19 6.61% 13.51 5.49 1.80 2.43% 33%
OMI Owens & Minor, Inc. 27.64 6.84% 15.19 1.82 0.88 3.18% 48%
JNJ Johnson & Johnson  63.35 7.23% 17.36 3.65 2.44 3.85% 67%
CLX Clorox Co. 67.64 7.26% 16.78 4.03 2.56 3.78% 64%
APD Air Products & Chemicals 77.81 7.68% 13.99 5.56 2.56 3.29% 46%
LM Legg Mason, Inc.  24.11 7.83% 15.66 1.54 0.44 1.82% 29%
UTX United Technologies Corp. 72.38 8.24% 15.24 4.75 1.92 2.65% 40%
NJR New Jersey Resources 42.9 8.33% 14.35 2.99 1.52 3.54% 51%
THFF First Financial Corp. 28.27 8.52% 10.39 2.72 0.94 3.33% 35%
SYY Sysco Corp. 27.26 8.65% 13.98 1.95 1.08 3.96% 55%
PPL PP&L Corporation 27.19 8.76% 9.61 2.83 1.44 5.30% 51%
TMP Tompkins Financial Corp. 36.36 8.96% 11.73 3.1 1.44 3.96% 46%
MSEX Middlesex Water Co.  18 9.02% 22.78 0.79 0.74 4.11% 94%
CAH Cardinal Health, Inc.  40.96 9.14% 13.88 2.95 0.95 2.32% 32%
AROW Arrow Financial Corp.  23.54 9.49% 12.59 1.87 1.00 4.25% 53%
WGL WGL Holdings, Inc. 38.15 9.91% 20.29 1.88 1.60 4.19% 85%
BMS Bemis Co Inc 29.91 9.92% 17.80 1.68 1.00 3.34% 60%
UNS UniSource Energy Corp. 36.24 9.95% 13.94 2.6 1.72 4.75% 66%
PG Procter & Gamble Co.  63.52 10.35% 19.48 3.26 2.25 3.54% 69%
WEYS Weyco Group, Inc.  22.98 10.37% 16.18 1.42 0.68 2.96% 48%
SJI South Jersey Industries 47.34 10.48% 15.52 3.05 1.61 3.40% 53%
35 Companies

Top Five Performance Review

In our ongoing review of the NLO Dividend Watch List, we have taken the top five stocks on our list from May 18, 2011 (not published) and have check their performance one year later. The top five companies on that list can be seen in the table below.

Symbol Name 2011 Price 2012 Price % change
HHS Harte-Hanks, Inc. 8.44 8.57 1.54%
SJW SJW Corp. 22.17 23.30 5.10%
WEYS Weyco Group, Inc.  22.75 22.98 1.01%
TGT Target Corp. 49.69 55.46 11.61%
WABC Westamerica BanCorp.  49.82 44.22 -11.24%
Average 1.60%
DJI Dow Jones Industrial 12,512.04 12,369.38 -1.14%
SPX S&P 500 1,333.27 1,295.22 -2.85%

Our top five outperformed the market by 4.45%. While the Westamerica (WABC) loss was offset by the gains of Target (TGT), SJW Corp. gains of 5.1% propelled the top five to be above par. Noteworthy seventh spot was Harleyville (HGIC) which nearly double after it was taken over.

Our target of +10% gains was achieved by 4 of the 5 stocks at the top of last year's list.  Weyco and SJW Corp. gained +10% in two months.  Target gained +10% in 5 months while Hart-Hanke gained +10% in 7 months.
Dow Theory

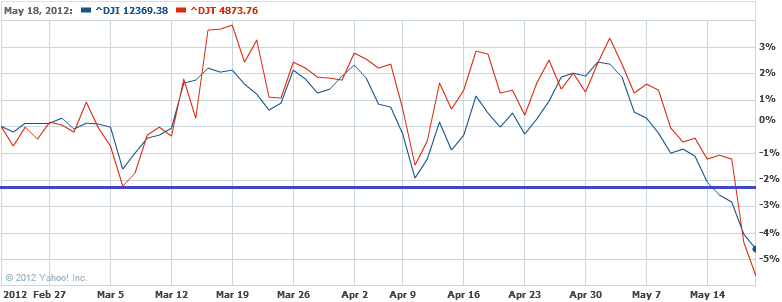
Our posting from May 12, 2012 should have said it all, we said the following:

“We believe that the break below 12,715 on the Industrials and 5,047 on the Transports would lead to a more bearish move for the market, at least for the intermediate term.”

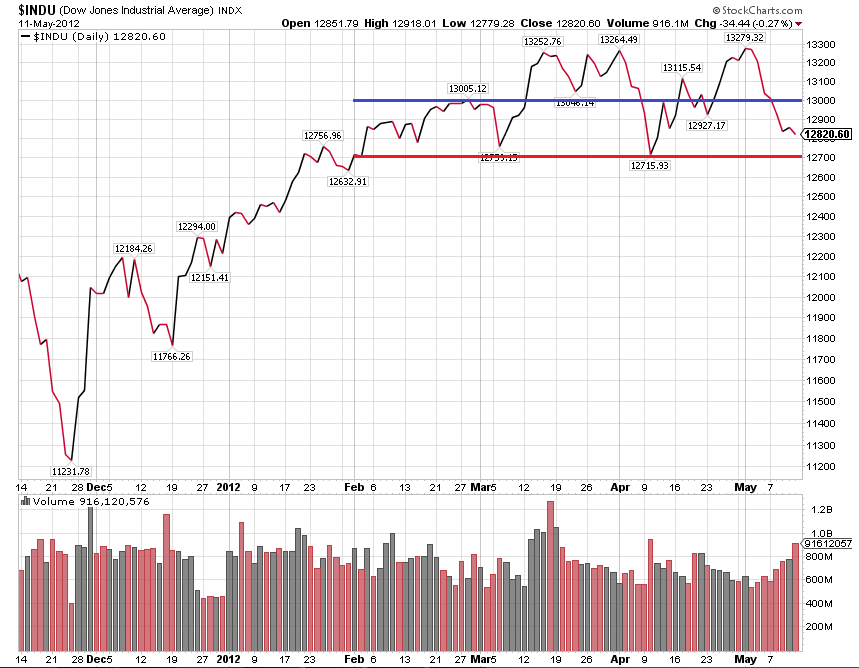
On May 14, 2012, the Dow Jones Industrial Index fell to the closing low of 12,695.35. This was below the 12,715 level that we believed was a critical support level for the Industrial Index.

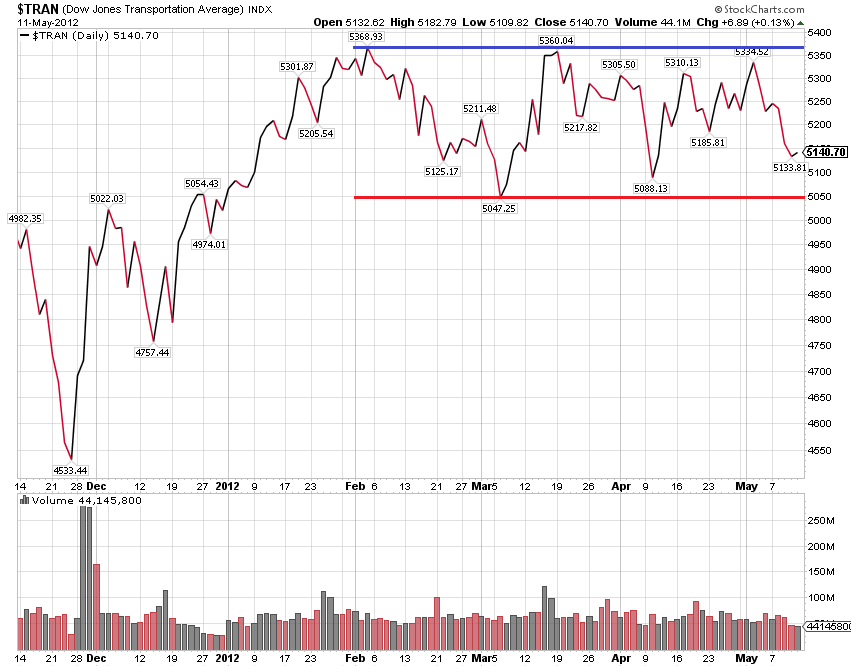
On May 17, 2012, the Dow Jones Transportation Index fell to the closing low of 4,938.18.  On May 18, 2012, the Transports fell to the closing low of 4,873.76.  This was significant in that it was below both the 5,047 level and below the 200-day moving average.

image

As of Friday May 18, 2012, the bear market rally, which began on August 9, 2011 (found here), is over. Now it is a simple matter of how much of a decline that we have in store.  The following are the downside targets for the Dow Jones Industrial Average (% decline based on 5/18/2012 close):

  • 11,728.46 at –5.18%
  • 11,192.80 at –9.51%
  • 10,362.26 at –16.23%

We will reassess the downside moves when and if the above targets are met.

Transaction Alert

We were wrong about our speculation in NUGT.  Therefore, we plan to sell NUGT if it declines to $8.79.

We bought NUGT based on the dual (short and long-term) indication from our Gold Stock Indicator as indicated in our April 4, 2012 article (found here).

Our preference for using Direxion Gold Miners Bull (NUGT) and Direxion Gold Miners Bear (DUST) ETFs are not for the risk averse.  DUST and NUGT are speculative vehicles and not investments meant to be held on a long-term basis.

Dow Theory Update

The S&P 500 fell -1% for the week on fears of another European zone collapse. Topping it off, JP Morgan (JPM) announced a $2 billion trading loss for the quarter which took the markets by surprise. One may wonder where the market will head in the coming weeks. Going back to our post on March 15 on Dow Theory, we suggested caution should be the operative word. Since then, the S&P500 had declined -3%.

When the Dow Jones Industrial Average broke above the 13,000 level in March, the Dow Jones Transportation Average failed to exceed its February high of 5,368. Divergence between the Industrials and Tranports is continued cause for concern. The transports appear to be trading in a line formation. Similarly, the Industrials have traded in a narrow range between 13,300 and 12,700.

We believe that the break below 12,715 on the Industrials and 5,047 on the Transports (red lines in the chart below) would lead to a more bearish move for the market, at least for the intermediate term.  All of this is within the context of the bear market rally as indicated in our August 9, 2011 article (found here).

INDU

TRAN

Transaction Alert: Bought MKL at the Market

Today we've added to our core portfolio holding of insurance companies with the purchase of Markel (MKL).

We have no plans to sell the stock and would add to our current holdings if the stock declines -20% or more.  An article on the stock will follow in the next couple of weeks.

Update on NUGT

On May 3, 2012 we posted a Transaction Alert indicating that we bought NUGT.

Although the transaction is currently at a breakeven level, we are revising our personal criteria for when to buy more and when to "consider" selling.  Our new criteria is as follows and is acceptable to only those who can accept 100% loss of capital invested:

We’re doing the transaction in two stages:

  1. 50% of the amount we wish to invest now (done)
  2. 50% of the amount we wish to invest after a decline of -20%
  3. we’re exiting the transaction after a total loss of -40% or greater
  4. we’re exiting the transaction when the next short-term signal buy DUST is indicated.

Those who have bought NUGT based on our initial purchase should re-read our more conservative entry and exit outline (found here), although the risks of loss are equally as high as our more aggressive strategy indicated above.

We bought NUGT based on the dual (short and long-term) indication from our Gold Stock Indicator as indicated in our April 4, 2012 article (found here).

Our preference for using Direxion Gold Miners Bull (NUGT) and Direxion Gold Miners Bear (DUST) ETFs are not for the risk averse.  DUST and NUGT are speculative vehicles and not investments meant to be held on a long-term basis.

Should Berkshire Hathaway Be Trading at 1995 Prices?

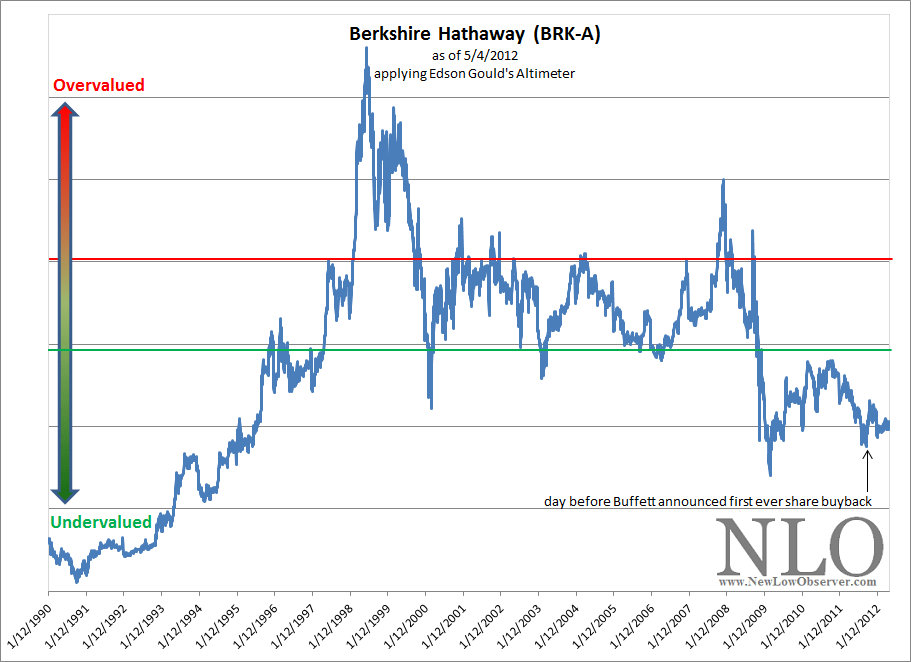
No, this isn’t an article about the prospect of Berkshire Hathaway falling from the current price of $121,950 to $32,100.  Instead, this is what Edson Gould’s Altimeter suggests that Berkshire Hathaway’s (BRK-A) stock price is currently trading at.

Edson Gould’s Altimeter compares the current stock price relative to the dividend that is paid by a company.  As we all know, Berkshire Hathaway does not pay a dividend.  So, how did we arrive at a dividend for Berkshire Hathaway?  We borrowed the dividend policy of Charlie Munger’s Wesco Financial (WSC).  We thought that there would be no better corporate dividend policy to replicate other than that of Warren Buffett’s right hand man.

Exactly what portion of Munger’s dividend policy did we replicate? First, we took WSC’s average dividend payout ratio of 13% from 1999-2010 and applied it to Berkshire Hathaway’s 1977 reported operating earnings of $22.54 per share.  This resulted in a dividend of $2.93.

Next, we compared the compound annual growth rate [CAGR] of the dividend for Wesco Financial which was slightly more than the book value from 1999-2010, at 3.37% and 3.01%, respectively.  Additionally, we took into consideration the fact that by 2010 Wesco Financial had a 38-year history of consecutive dividend increases.  Because Berkshire Hathaway has a 19.8% CAGR of their book value (2011 annual report), we opted to cut that figure in half and assign a dividend growth rate of 9.9%.  Our decision to cut the CAGR of the book value in half was in deference to Buffett’s desire to better deploy the capital in other investment opportunities and the possible diminished impact of the succession team upon Buffett’s “retirement.”

After borrowing the dividend policy from Buffett’s primary business partner and creating a hypothetical dividend and a compounded annual dividend growth rate, assuming regular dividend increases for the last 35 years, we believe that we have constructed a reasonable approximation of an Altimeter which is represented in the chart below.

image

Based on the Altimeter, our best guess is that the period from 1996 to 2008 provided consistent indications of when to add to your positions of Berkshire Hathaway (at or below green line).  The period from 2008 to 2009 provided exceptional opportunities for new investors to buy Berkshire Hathaway as the markets, economy and insurance industry were in crisis mode at the exact same time.

Once the recovery in stocks started it was off to the races for most investors.  Even Berkshire Hathaway was able to participate in the run-up from the 2009 low.  However, on a relative basis, Berkshire’s share price was not increasing  to a level that was reflective of its true value, this is in spite of getting within 10% of the 2007 high in late February 2010.  Based on the Altimeter, Berkshire is currently undervalued by at least 66% and below the 2007 peak by almost 95%.

Those considering the acquisition of Berkshire Hathaway have the following upside targets to consider in the coming 2-3 years, all things being equal:

  • $175,280
  • $197,190
  • $219,100

The following are the possible downside targets:

  • $120,767
  • $105,606

After constructing a fairly conservative dividend policy, the Altimeter clearly outlines the reasons why Warren Buffett would suggest that Berkshire Hathaway will “very aggressively” buy back shares even though the stock is well within striking distance of the all time high.

Who is Edson Gould?

"Edson Gould spent over 60 years working in and studying financial markets. Gould studied the arts at Princeton, engineering at Lehigh (from where he graduated in 1922), and finance at New York University. In 1922, after working for a short time at Western Electric, he joined Moody's Investor Service as an analyst and later was editor of Moody's Stock Survey, Bond Survey, and Advisory Reports. In 1948, he began at Arthur Wiesenberger & Company, where he developed and edited the well-known Wiesenberger Investment Report and became a senior partner. He also was Research Director at E. B. Smith (which later became Smith Barney), and worked for Nuveen."

(source: Market Technicians Association. Gould, Edson Beers, Knowledge Base. Accessed April 26, 2012. link MTA reference.)

"Market technician Edson Gould always laughed at the idea of having a significant influence on the stock market, but his predictions were the most precise around. He pinpointed major bull markets and prophesied bottom-out markets as if he had his own peephole into the future. But in place of a crystal ball and wacky off-the-cuff schemes, his were smart, intensely researched and time-tested theories that made him a legend in the investment community."

(source: Fisher, Kenneth L.. 100 Minds That Made the Market. Business Classics, Woodside, CA. 1993. page 320.)

U.S. Dividend Watch List: May 4, 2012

Watch List Summary

ConocoPhillips (COP) appears on the top of our list but that is because of the split in the stock. While the stock isn’t technically at the low, our observation is that any time a dividend stock splits, it tends to perform well in the subsequent years that follow. We haven’t confirm the dividend payment amount, so the 5% dividend yield would need to be confirmed prior to committing any capital.

Carbo Ceramics (CRR) is appearing on our list again this week. The stock retested its low of $85 and broke that level to settle at a new low of $81.60. The closest breakout was $80 in 2008 so we’re looking for $81.60 to serve as a good support level. The dividend yield of 1.2% isn’t enticing by any means for income investor, but historically speaking, it is closer to its upper band of the dividend yield. The dividend payout ratio of 17% also provides a large margin for safety. With oil prices below $110, we believe it should put some pressure on the stock price. Most drillers will not seek to expand their capital expenditures if oil prices remain at the current level.

Johnson & Johnson (JNJ) made our top ten list this week. There is little need for introduction for this household name which offers a 3.58% dividend yield. Going back to our list from April 8, 2011 you will noticed that JNJ traded at $59.46 and a dividend yield of 3.63% ($2.16/share). In the following month, the company announced a 5% increase in the dividend. This served as a fundamental floor for the stock price. JNJ has risen by about 7% since, excluding dividends. We are confident that JNJ will likely raise their dividend again, creating another “bottom” for the stock price. While the stock may no provide the excitement traders want or "need", value investors can concentrate a large portion of their portfolio in this stock and get a good risk adjusted return when purchased at a reasonable price.

For more information on companies such as Tootsie Roll (TR), C.H. Robinson (CHRW), and Matthews International (MATW) please refer to our watch list from April 6th.

Below are the 20 companies that meet our criteria and are within 11% of the 52-week low:

Symbol Name Price % Yr Low P/E EPS (ttm) Dividend Yield Payout Ratio
COP ConocoPhillips 53.17 0.00% 5.81 9.15 2.64 4.97% 29%
CRR Carbo Ceramics, Inc. 81.6 0.00% 14.49 5.63 0.96 1.18% 17%
CHRW C.H. Robinson Worldwide  60.62 3.22% 22.54 2.69 1.32 2.18% 49%
EXPD Expeditors International 39.5 3.27% 22.07 1.79 0.50 1.27% 28%
TR Tootsie Roll Industries Inc  22.42 3.65% 30.38 0.738 0.32 1.43% 43%
MATW Matthews International 29.79 4.27% 12.16 2.45 0.36 1.21% 15%
FNFG First Niagara Financial  8.58 4.38% 14.54 0.59 0.32 3.73% 54%
LM Legg Mason, Inc.  23.68 4.73% 15.38 1.54 0.32 1.35% 21%
NFG National Fuel Gas Co. 46.77 5.86% 14.99 3.12 1.42 3.04% 46%
CWT California Water Service 17.63 5.89% 19.59 0.9 0.63 3.57% 70%
WEYS Weyco Group, Inc.  22.25 6.89% 15.67 1.42 0.64 2.88% 45%
ANAT American Natl. Insurance 70.25 6.91% 9.39 7.48 3.08 4.38% 41%
CLX Clorox Co. 67.46 6.98% 16.87 4 2.40 3.56% 60%
NJR New Jersey Resources 42.81 8.11% 13.25 3.23 1.52 3.55% 47%
JW-A John Wiley & Sons Inc. 45.31 8.16% 14.38 3.15 0.80 1.77% 25%
AROW Arrow Financial Corp.  23.39 8.79% 12.51 1.87 1.00 4.28% 53%
UNS UniSource Energy Corp. 35.94 9.04% 13.98 2.57 1.72 4.79% 67%
PPL PP&L Corporation 27.35 9.40% 10.13 2.7 1.44 5.27% 53%
JNJ Johnson & Johnson  64.74 9.58% 18.19 3.56 2.28 3.52% 64%
HNZ HJ Heinz Co. 53.31 10.67% 17.77 3 1.92 3.60% 64%
20 Companies

Top Five Performance Review

In our ongoing review of the NLO Dividend Watch List, we have taken the top five stocks on our list from May 6, 2011 and have check their performance one year later. The top five companies on that list can be seen in the table below.

Symbol Name 2011 Price 2012 Price % change
SJW SJW Corp. 22.53 23.31 3.46%
WABC Westamerica BanCorp.  49.6 44.84 -9.60%
CHFC Chemical Financial  19.47 21.75 11.71%
WEYS Weyco Group, Inc.  23.1 22.25 -3.68%
TGT Target Corp. 50.51 55.65 10.18%
Average 2.41%
DJI Dow Jones Industrial 12,723.58 13,038.27 2.47%
SPX S&P 500 1,335.10 1,369.10 2.55%

Our watch list nearly matched the market performance. Once again, our assessment of Westamerica (WABC) didn’t pan out as we expected.  However, the remaining stocks achieved +10% gains within one year of being on our watch list.  SJW and WEYS gained +10% within 2 months while CHFC gained ten percent in seven months.  TGT managed to hit our target in the ninth month after being on our list.

Not making the top five, but among the top seven, was Harleyville (HGIC) which rose +88% after it was taken over. Also, we highlighted Cal-Maine (CALM), an egg producer, which rose +30%. A large part of the rise could be because of the fall in the corn prices which helped expand margins.

Transaction Alert

We've bought NUGT at the Market at 12:22pm EST.  We're doing the transaction in two stages:

  1. 50% of the amount we wish to invest now
  2. 50% of the amount we wish to invest after a decline of -10%
  3. we're exiting the transaction after a total loss of -20%
  4. we're exiting the transaction after a gain of +10%, anything above 10% is considered high risk

We bought NUGT based on the dual (short and long-term) indication from our Gold Stock Indicator as indicated in our April 4, 2012 article (found here).

Our preference for using Direxion Gold Miners Bull (NUGT) and Direxion Gold Miners Bear (DUST) ETFs aren’t for the risk averse.  DUST and NUGT are speculative vehicles and not investments meant to be held on a long term basis.

Downside Targets for Herbalife (HLF)

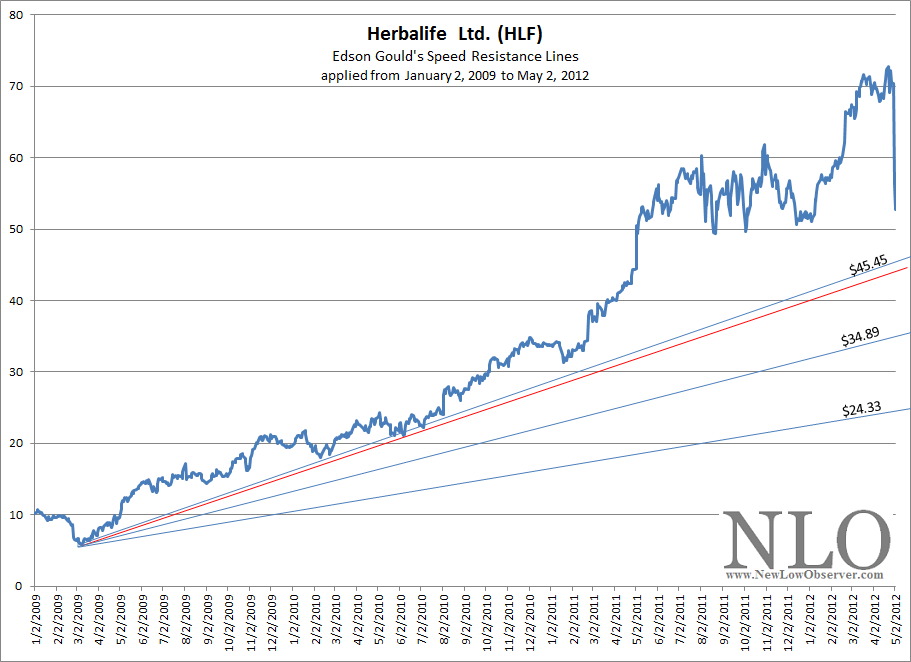
After the news of Herbalife (HLF) getting slammed, we were curious about what the downside targets for the stock might be using Edson Gould’s Speed Resistance Lines.  Below is a chart representing the conservative downside target of $45.45 and the extreme downside target of $24.33.

So far, HLF appears to have support for the stock price at $45.45.  However, if HLF falls below the $45.45 level, it would suggests that HLF will decline to, at minimum, $34.89 before finding stabilization in the stock price.  A decline $24.33 would mean that HLF could revisit the 2009 lows.

image

We believe that it is worth examining whether or not these downside targets are accomplished.  In our view, the downside targets are reasonable estimates of where the stocks could go before initiating new research on whether these companies have viable business models.

Disclaimer: This piece is a continuation of the examination of Edson Gould’s speed resistance lines as explained in prior articles. This is not an endorsement to sell short at the current levels nor buy these stocks once falling below the extreme downside targets.

Green Mountain Establishes New Downside Target

On October 25, 2011, we published a chart of Green Mountain Coffee Roasters (GMCR) that utilized Edson Gould’s Speed Resistance Lines [SRL] to determine what the possible downside targets might be.  At the time, Green Mountain Coffee Roasters was trading at $64.75.  However, our use of the SRL indicated GMCR had a conservative downside target of $59.63 and an extreme downside target of $37.21.

After reach the level of $59.63, GMCR’s stock price rose marginally before falling significantly to the downside resting at the $39.42 level.  Soon afterwards, GMCR rose as high as $70, but did not go above the SRL rising trend established at $59.63.

After reaching the $70 level, GMCR promptly fell to the $37.21 level which established what we believed to be a “support” level (green arrows; definition here).  Support levels, if broken, would result in the stock of GMCR going to the previous downside levels that helped to establish the upside trend at $22.53 and $8.30.

In after-hours trading on May 2, 2012, GMCR plummeted from the closing price of $49.52 to as low as $28.50, a loss of -42%.  We believe that GMCR  has a new support level of $22.53 and upside resistance (definition here) at $42.  If the price of GMCR falls significantly below $22.53 (i.e. $21) then we would expect that the new downside target of GMCR is $8.30.

image

As an investor, if you have a stop-loss order (definition here) at $45, then you’ll only be able to get out of the stock at the next best price.  This means that if GMCR opens at $30 tomorrow, you’re only able to get out of GMCR at $30, not $45-$44 under normal market conditions.  Right off the bat, you’ll lose 33% more than you had planned. 

Typically, when a stock crashes it would usually rebound to a higher level before continuing the declining trend (if it happens to be going lower).  The stop-loss order will trigger automatic selling of GMCR even though we expect that it might rebound from the $28.50 low of today to, at least, $35.50 tomorrow.  If nothing else, selling on the short-lived rebound would reduce the amount of loss while a stop-loss order typically ensures the maximum loss in the shortest period of time.

This explains why we are against the use to stop-loss orders as a means to avoid losses.  The best way to avoid significant lose is to consider the downside targets before buying a stock.  After considering the downside, we recommend putting an amount that you’re comfortable with even if the stock were to decline -50%.

Warner Chilcott up +50% Within Six Months

As we’ve described many times in the past, seeking specific companies at a new low inherently implies that value attributes are far greater than when a stock is trading at a new high.  This has been the case with a majority of stocks that appear on our watch list.

We’ve demonstrated this in the watch list summary section of our April 27, 2012 Nasdaq 100 watch list.  Furthermore, the recent acquisitions of Transatlantic Holdings (TRH) and Cephalon (CEPH) highlight our claim that quality companies invested in near the new low are the most likely candidates to be acquired by much larger companies.  A perfect example is found with news from Warner Chilcott (WCRX).

Today it was announced that Warner Chilcott (WCRX) was going to put itself up for sale as a means to “…enhance shareholder value.”  On the news, Warner Chilcott’s stock price rose as much as +20%.  However, as a member of the Nasdaq 100 Index, Warner Chilcott appeared on our December 16, 2011 at $14.02, when the stock was within 8.68% of the 1-year low.

image

On Friday, April 27, 2012, WCRX closed at a price of $18.79, which was already a gain of +34% above the December 16, 2011 watch list price.  Now, with WCRX trading around $22 per share, we believe that the value component of WCRX has been eliminated and recommend that those who own the stock should consider selling the principal, at the very minimum.

Nasdaq 100 Watch List: April 27, 2012

Below are the Nasdaq 100 companies that are within 20% of their respective 52-week lows. Stocks that appear on our watch lists are not recommendations to buy. Instead, they are the starting point for doing your research and determining the best company to buy. Ideally, a stock that is purchased from this list is done after a considerable decline in the price and rigorous due diligence.

Symbol Company Price P/E EPS Yield P/B % from Low
CHRW CH Robinson Worldwide 59.02 22.01 2.68 2.2 7.72 0.49%
FSLR First Solar, Inc. 18.35 0 -0.46 0 0.43 3.03%
EXPD Expeditors Int'l 39.9 22.29 1.79 1.3 4.27 4.31%
CTRP Ctrip.com Int'l 21.66 19.32 1.12 0 2.76 5.40%
EA Electronic Arts Inc. 15.32 0 -0.52 0 2.34 5.80%
INFY Infosys Ltd. 47.06 15.69 3 1.2 4.07 5.87%
APOL Apollo Group Inc. 35.78 7.79 4.6 0 3.99 6.14%
SYMC Symantec Corporation 16.48 15.86 1.04 0 2.58 10.31%
RIMM Research In Motion 14.03 6.32 2.22 0 0.72 12.69%
NVDA NVIDIA Corporation 12.98 13.81 0.94 0 1.93 13.16%
VOD Vodafone Group plc 27.93 12.64 2.21 3.4 1.06 14.89%
SNDK SanDisk Corp. 37.58 10.51 3.58 0 1.29 16.56%
ALTR Altera Corp. 35.56 17.6 2.02 0.9 3.73 17.01%
NTAP NetApp, Inc. 39.03 25.99 1.5 0 3.53 18.27%
ORCL Oracle Corporation 29.24 15.32 1.91 0.8 3.37 18.28%
VMED Virgin Media, Inc. 24.45 64.01 0.38 0.7 6.81 19.15%
SRCL Stericycle, Inc. 87.64 32.58 2.69 0 6.08 19.97%
^NDX NASDAQ-100 2,741.34 - - - - -

Watch List Summary

First on our list is Electronic Arts (EA).  the last time Electronic Arts was on our Watch list was on June 6, 2010.  At that time, Electronic Arts was trading at $15.81 with a per share earnings loss of –$2.08 and with a price-to-book ratio of 2.  By July of the next year, Electronic Arts increased in value by +58%.

image

Electronic Arts (EA) has the following downside targets:

  • $12.77
  • $10.22
  • $7.66

Ordinarily, we don’t have a preference for a stock that doesn’t have earnings, however, the reason we focus on the Nasdaq 100 is because we know that lacking any value attributes, companies won’t disappear from the index until the end of each year, unless an acquisition occurs.  This usually means that stocks in this index will likely appear  to rebound due to significant institutional support and the requirement to be invested in constituents of the index.

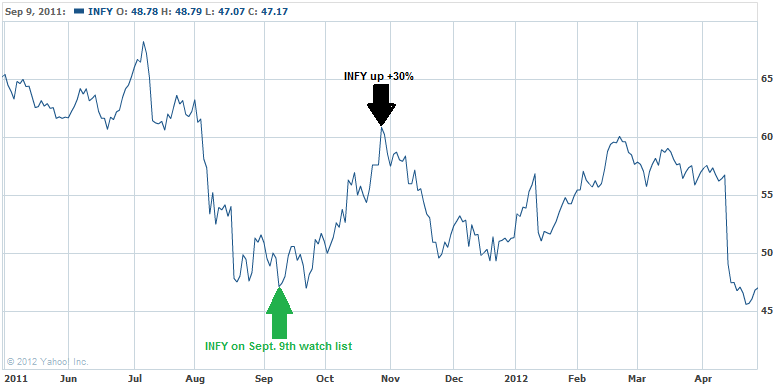
Next on our watch list is Infosys Ltd (INFY).  Infosys appeared on our  watch list on September 9, 2011 at the price of $47.17.  Less than two months later, Infosys (INFY) increased and peaked at +30% above the price of when it was on our watch list.  Below are the downside targets to consider if purchasing INFY: 

  • $38.43
  • $34.11
  • $29.80
  • $21.17

image

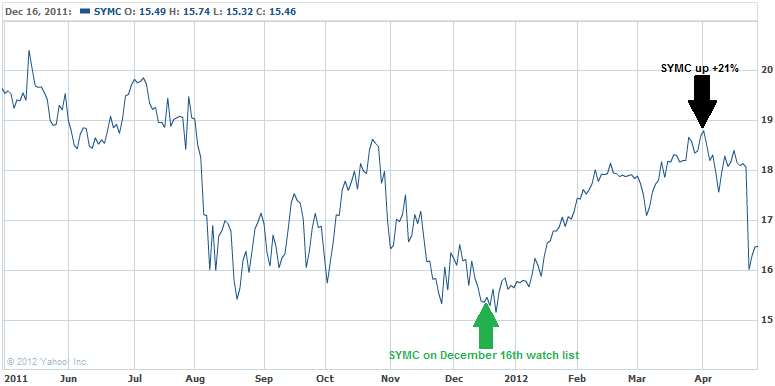
Finally, the next company on our list is Symantec (SYMC) which last appeared on our watch list on December 16, 2011.  At the time, SYMC had a P/E ratio of 17.59 and a price-to-book ratio of 2.49.

image 

Shortly after appearing on our December 16, 2011 watch list, SYMC rose +21%.  The following are the downside targets for anyone considering the purchase of SYMC:

  • $14.24
  • $13.26
  • $12.20
  • $10.05

Considering all of the companies on our watch list, we believe that the three that we’ve covered are reasonable investments at the current time, with money set aside for a second purchase if the stock price declines. 

Watch List Performance Review

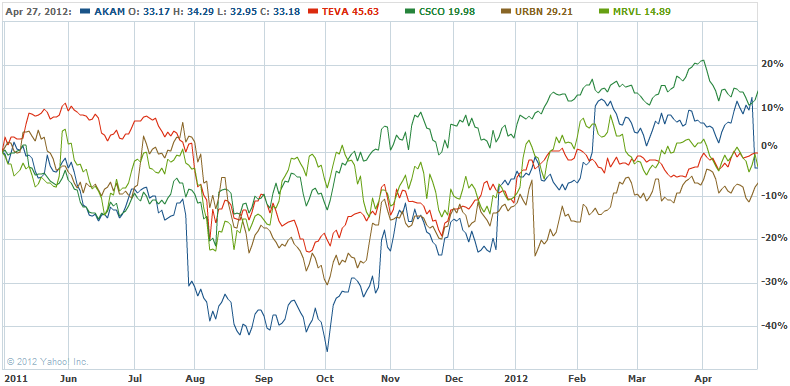
The top five stocks on our watch list from April 29, 2011 got hammered in the market decline from June to October 2011.  Hardest hit was Akamai which fell over –40%.  Only three stocks gained more than +10% within a year.  Right out the gate was TEVA in the first month.  Nearly 9 months after our watch list, CSCO and MRVL were able to gain +10%.  The average return of all five companies in the last year was –0.10%.

symbol Company 2011 2012 % change
Akamai Tech. 34.43 33.18 -3.63%
TEVA Teva Pharma. 45.73 45.63 -0.22%
CSCO Cisco Systems 17.52 19.98 14.04%
URBN Urban Outfitters 31.47 29.21 -7.18%
MRVL Marvell Tech. 15.43 14.89 -3.50%
      Average -0.10%

image

Insurance Watch List: April 27, 2012

The following is one of our personal favorite watch lists.  We started tracking the insurance industry in January 2011 and we’re very impressed with the results so far. 

Anyone who wishes to be successful in insurance stocks should read the book The Davis Dynasty by John Rothchild.  The book starts with Shelby Collum Davis investing approximately $50,000 to $100,000 that ultimately grew to $900 million after 47 years.  The strategies employed by Davis seem more accessible to average investors as opposed to Warren Buffett’s leveraged strategies and education from Benjamin Graham.

Symbol Name Price P/E EPS Yield P/B % from Low payout ratio
NWLI National Western Life Insurance 136.93 8.95 15.3 0.3 0.39 5.33% 2.35%
ANAT American National Insurance Co. 71.08 9.87 7.2 4.3 0.52 8.17% 42.78%
MIG Meadowbrook Insurance Group Inc. 9 10.84 0.83 2.2 0.77 8.83% 24.10%
AFFM Affirmative Insurance Holdings Inc. 0.46 0 -10.66 0 -0.1 9.52% 0.00%
ESGR Enstar Group Limited 96.1 8.89 10.81 0 1.13 11.03% 0.00%
WSH Willis Group Holdings 36.8 31.83 1.16 2.9 2.61 11.38% 93.10%
TWGP Tower Group Inc. 22.05 15 1.47 3.4 0.83 11.48% 51.02%
BWINA Baldwin & Lyons Inc. 23.02 0 -1.9 4.3 1.07 12.24% -52.63%
ASI American Safety Insurance Holdings 19.06 18.87 1.01 0 0.59 12.32% 0.00%
CISG Cninsure Inc. 5.9 0 -0.95 0 0.68 12.81% 0.00%
SAFT Safety Insurance Group Inc. 40.29 44.77 0.9 5 0.92 13.49% 222.22%
CRVL CorVel Corporation 43.72 21.22 2.06 0 4.45 14.93% 0.00%
UFCS United Fire Group, Inc 17 0 0 3.6 0.61 14.94% 0.00%
HTH Hilltop Holdings Inc. 7.93 0 -0.12 0 0.68 15.26% 0.00%
KCLI Kansas City Life Insurance Company 32.7 14.29 2.29 3.3 0.52 16.74% 47.16%
MHLD Maiden Holdings, Ltd. 8.27 21.21 0.39 3.9 0.76 18.31% 82.05%
NATL National Interstate Corporation 24.35 13.31 1.83 1.7 1.34 18.61% 21.86%
FSR Flagstone Reinsurance Holdings SA 7.62 0 -4.65 2.1 0.67 18.88% -3.44%
OB OneBeacon Insurance Group, Ltd. 14.28 24.58 0.58 5.9 1.24 19.00% 144.83%
LPHI Life Partners Holdings, Inc. 2.53 57.5 0.04 16.2 1.1 19.34% 1000.00%
FFG FBL Financial Group Inc. 29.24 29.24 1 1.4 0.7 19.35% 40.00%

Watch List Summary

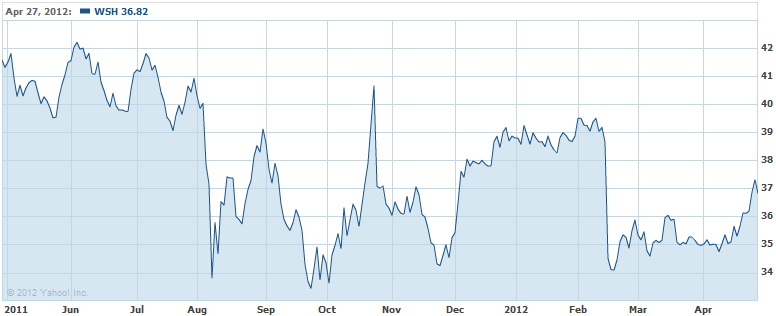
The following are the most compelling insurance stocks that are currently on our watch list.  First among the companies is Willis Group Holdings (WSH).  According to Yahoo!Finance, Willis Group Holdings (WSH) “provides a range of insurance brokerage, reinsurance, and risk management consulting services to its clients worldwide.”  We believe that the reinsurance segment has the kind of allure that will quickly attract larger buyers.  Although Willis Group Holdings isn’t inexpensive, we believe that the technical conditions can help us determine reasonable prices to concentrate our purchases.

image

From a technical standpoint, Willis Group Holdings is considered fair value at $30.80.  If Willis Group Holdings (WSH) were to fall -50% (our benchmark for proper downside risk assessment), WSH would sell for $18.40 based on the April 27, 2012 closing price.  We believe a two phase purchase can take place at the current price and at any one of the following downside targets:

  • $27.00
  • $19.39
  • $15.39

Next up is Tower Group (TWGP) which “provides commercial, specialty, and personal property and casualty insurance products and services to businesses in various industries and to individuals in the United States” as described by Yahoo!Finance.

image

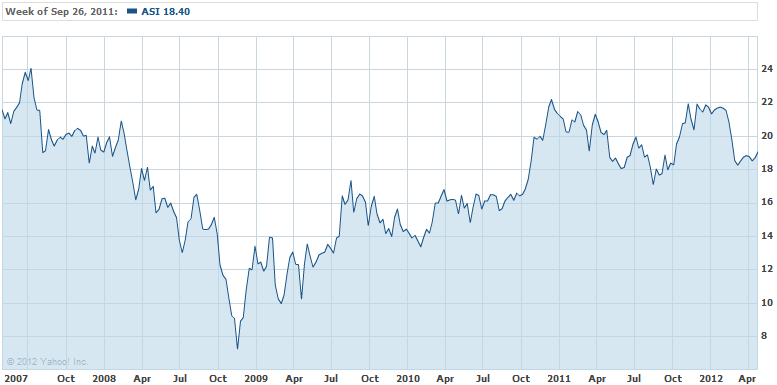
From the longest available chart, Tower Group (TWGP) has an interesting record.  Although the decline from the 2007 high to the bottom in 2009 was -58%, the stock price hasn’t gone gangbusters since the 2009 low.  At the same time, based on the more conservative data available from Value Line Investment Survey, Tower Group (TWGP) has seen its shares outstanding nearly double while the book value has declined by more than half.  For some reason, Yahoo!Finance indicates that the book value at $26.37, we don’t trust that number and recommend that you always assume the more conservative number.

Despite these concerns, we believe that Tower Group is in the early stages of recovery from the mistakes that were made in the period from 2007 to the present.  The technicals suggest that reasonable purchases in two stages should take place at or below the following downside targets:

  • $19.79
  • $15.76
  • $11.03

Finally, the next stock that we’re interested in from watch list above is American Safety Insurance Holdings (ASI) which “offers specialty insurance and reinsurance products to small and medium-sized businesses in the United States and internationally. Its Excess and Surplus Lines division provides environmental insurance products, such as general contractor pollution and/or professional liability coverage for contractors and consultants; primary general liability coverage for residential and commercial risks; excess and umbrella liability coverage in the construction and products liability areas; and property and packaged property and liability focused on fire exposed premises,” as indicated by Yahoo!Finance.

image

American Safety Insurance Holdings (ASI) is appealing for a couple of reasons.  First, the stock has increased both property/causality income and investment income consistently since 2003.  This performance has increased the book value of ASI by nearly double since 2003, making the company’s stock price appear undervalued by 40%.  A concern that may require some follow-up is the declining levels of underwriting income.

With the risks of a market decline, after the tremendous run from 2009 to the present, we would buy ASI at the current price and then again at the following downside targets spread over three different level:

  • $16.96
  • $11.53
  • $9.53

Insurance Watch List Performance Review

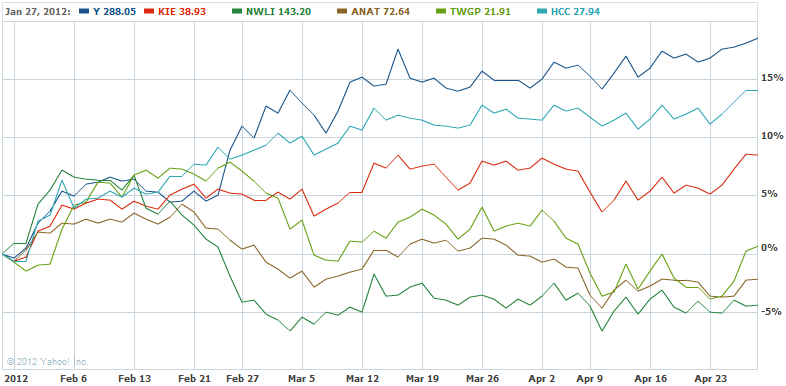
The following is the performance of the stocks that were on our last Insurance Watch List dated January 27, 2012.

Symbol Company 1/27/2012 4/27/2012 % change
Y Alleghany 288.05 340.97 18.37%
NWLI National Western Life Insurance 143.2 136.93 -4.38%
ANAT American National Insurance 71.88 71.08 -1.11%
TWGP Tower Group 21.72 22.05 1.52%
HCC HCC Insurance Holdings 27.8 31.92 14.82%
Average 5.84%
KIE S&P Insurance ETF 38.85 42.23 8.70%

image

So far, Alleghany (Y) and HCC Insurance Holdings (HCC) have torn the cover off the ball when compared to the S&P Insurance ETF (KIE).  Alleghany has gained +18% while HCC has gained +14%.   On the opposite end of the spectrum, National Western Life Insurance (NWLI), American National Insurance (ANAT) and Tower Group (TWGP) have underperformed the +8% gain of the S&P Insurance ETF (KIE).  Again, this has only been a 3-month period so the underperformance suggests that there should not be any alarm about the declines so far.

Transaction Alert: Sold NUGT

We have sold our positions of NUGT.