Author Archives: nlo-admin

A Warning for Chesapeake Energy Stockholders

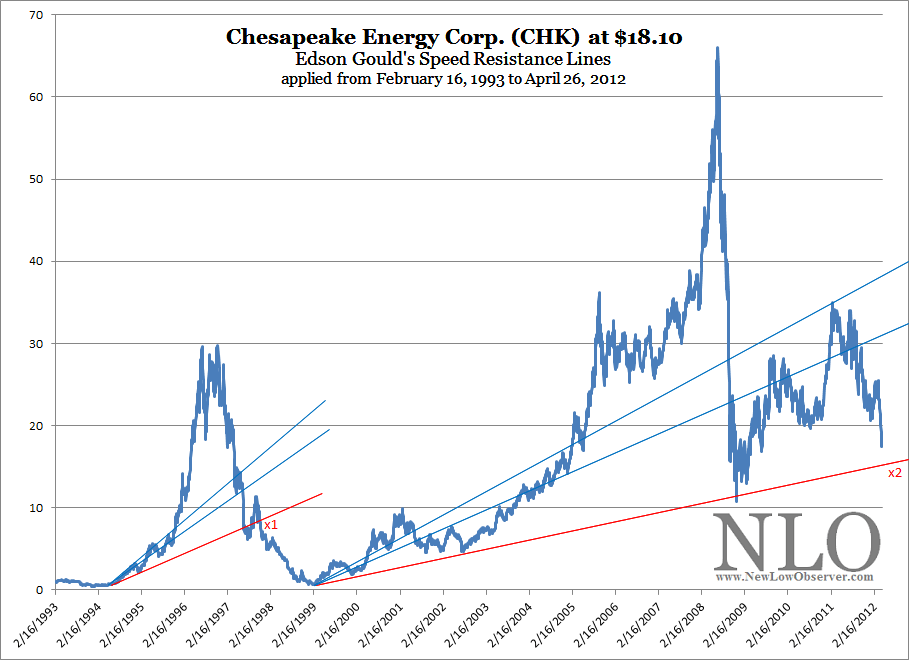
While it appears that Chesapeake Energy  (CHK) has seen all the punishment that could possibly lay ahead, we’re concerned that the previous technical pattern in the period from 1993 to 1999 is about to repeat.  In the chart below, we’ve applied Edson Gould’s Speed Resistance Lines [SRL] to the price of CHK in the period from 1993-1999 and 1999-2012.

image

Critical to our analysis using Edson Gould’s SRL is the fact that, so far, CHK has replicated every move that has occurred in the ‘93-‘99 period in the most recent price activity from ‘99-‘12.  While it would appear academic that the stock has been in a declining trend, we’re more concerned with the downside risk.

With this in mind, if CHK declines below the red line at x2, then we believe CHK will return to the pivot level of $4.94 with the possibility of declining all the way back to 1999 prices.  If CHK falls significantly below the $4.94 level, then the stock has a high likelihood of going all the way $0.67.  This would be a replication of CHK falling below x1, and returning to the previous pivot level of $2.00, set in 1994.

This “warning” does not suggest that CHK cannot go back to the prior highs at $55 (for now), instead, this review is strictly intended to consider the downside risk, which is our only concern.

Who is Edson Gould?

“Edson Gould spent over 60 years working in and studying financial markets. Gould studied the arts at Princeton, engineering at Lehigh (from where he graduated in 1922), and finance at New York University. In 1922, after working for a short time at Western Electric, he joined Moody’s Investor Service as an analyst and later was editor of Moody’s Stock Survey, Bond Survey, and Advisory Reports. In 1948, he began at Arthur Wiesenberger & Company, where he developed and edited the well-known Wiesenberger Investment Report and became a senior partner. He also was Research Director at E. B. Smith (which later became Smith Barney), and worked for Nuveen.”

(source: Market Technicians Association. Gould, Edson Beers, Knowledge Base. Accessed April 26, 2012. link MTA reference.)

“Market technician Edson Gould always laughed at the idea of having a significant influence on the stock market, but his predictions were the most precise around. He pinpointed major bull markets and prophesied bottom-out markets as if he had his own peephole into the future. But in place of a crystal ball and wacky off-the-cuff schemes, his were smart, intensely researched and time-tested theories that made him a legend in the investment community.”

(source: Fisher, Kenneth L.. 100 Minds That Made the Market. Business Classics, Woodside, CA. 1993. page 320.)

Transaction Alert: Sold AEM & GFI, Bought NUGT

We have sold our positions in AEM and GFI and used the proceeds from those transactions to buy NUGT.  We sold both AEM and GFI at a loss of slightly more than -5%. We decided not to over-concentrate  in one sector by adding a third gold position.

We bought NUGT based on the dual (short and long-term) indication from our Gold Stock Indicator as indicated in our April 4, 2012 article (found here).

Our preference for using Direxion Gold Miners Bull (NUGT) and Direxion Gold Miners Bear (DUST) ETFs aren’t for the risk averse.  DUST and NUGT are speculative vehicles and not investments meant to be held on a long term basis.

U.S. Dividend Watch List: April 20, 2012

Watch List Summary

Carbo Ceramics (CRR) appears on our list again this week. The stock retested its low of $85 and broke that level to settle at a new low of $81.60. The closest breakout was $80 in 2008 so we’d look for that to be a good support level. Dividend yield of 1.2% isn’t enticing by any mean to income investor but historically speaking, it is closer to its upper band of the company dividend yield. Payout ratio of 17% all so provide large margin for safety. With oil price below $110, we believe it put pressure on the stock price. Driller will not seek to expand their capital expenditure if oil price remain at this level.

Johnson & Johnson (JNJ) made our list this week. There’s no need for introduction for this household name which offers 3.58% yield. Going back to our list from April 8, 2011you will noticed that JNJ traded at $59.46 and yield of 3.63% ($2.16/share). In the following month, the company announced a 5% rise in dividend to $2.28 per share. This served as a fundamental floor for JNJ price. Stock has risen by about 7% since, excluding dividend. With the month of May around the corner, we can certainly make an educated guess that JNJ will likely raise their dividend again, creating another “bottom” for the stock price. While the stock may no provide the excitement trader need, value investor can concentrate a large portion of their portfolio and get a good risk adjusted return from this company when purchased at the right moment.

For more information on companies such as Tootsie Roll (TR), C.H. Robinson (CHRW), and Matthews International (MATW) please refer to our watch list from April 6th.

Symbol Name Price % Yr Low P/E EPS (ttm) Dividend Yield Payout Ratio
CRR Carbo Ceramics, Inc. 86.48 0.93% 15.39 5.62 0.96 1.11% 17%
NFG National Fuel Gas Co. 45.85 3.78% 14.70 3.12 1.42 3.10% 46%
TR Tootsie Roll Industries Inc  22.52 4.11% 30.43 0.74 0.32 1.42% 43%
CWT California Water Service 17.75 6.61% 19.72 0.9 0.63 3.55% 70%
CHRW C.H. Robinson Worldwide, Inc.  66.52 6.77% 25.39 2.62 1.32 1.98% 50%
MATW Matthews International Corp.  30.56 6.97% 12.63 2.42 0.36 1.18% 15%
ANAT American National Insurance 70.85 7.82% 9.84 7.2 3.08 4.35% 43%
JNJ Johnson & Johnson  63.71 7.84% 18.26 3.49 2.28 3.58% 65%
PPL PP&L Corporation 27.15 8.60% 10.06 2.7 1.44 5.30% 53%
JW-A John Wiley & Sons Inc. CL 'A' 45.62 - 14.48 3.15 0.80 1.75% 25%
UNS UniSource Energy Corporation 35.98 9.16% 13.08 2.75 1.72 4.78% 63%
EXPD Expeditors International of Washington, Inc.  41.96 9.70% 23.44 1.79 0.50 1.19% 28%
NJR New Jersey Resources Corp. 43.45 9.72% 13.45 3.23 1.52 3.50% 47%
WEYS Weyco Group, Inc.  22.85 9.75% 16.68 1.37 0.64 2.80% 47%
BDX Becton, Dickinson and Co. 76.43 9.83% 13.95 5.48 1.80 2.36% 33%
FNFG First Niagara Financial Group Inc.  9.07 10.34% 14.17 0.64 0.32 3.53% 50%
AROW Arrow Financial Corp.  23.73 10.37% 12.69 1.87 1.00 4.21% 53%
HRL Hormel Foods Corp. 28.59 10.51% 17.12 1.67 0.60 2.10% 36%
UGI UGI Corp. 26.61 10.55% 14.62 1.82 1.04 3.91% 57%
HNZ HJ Heinz Co. 53.29 10.63% 17.76 3 1.92 3.60% 64%
CAH Cardinal Health, Inc.  41.55 10.71% 15.39 2.7 0.86 2.07% 32%
21 Companies

Is a Recession Coming?

Review

On August 23, 2009, using Dow Theory and the Industrial Production Index [IPI], we predicted that the National Bureau of Economic Research (NBER) was going to say that the recession ended in June 2009 (article here).  We specifically said the following:

“Implicit in my discussion of the IPI [Industrial Production Index] is that we are at a turning point for the economy. Based on the combination of the Dow Theory confirmation of July 23, 2009 and the IPI turning up from the June low, I will have to guess that the National Bureau of Economic Research (NBER) is going to proclaim June 2009 as the official end to the recession. The end to this recession will be lackluster and questioned from all corners.”

As has been the case historically, the announcement that the recession had ended came 1-year and 3 months after the fact (NBER announcement found here.)  Additionally, few have been satisfied with the definition of a recovery especially if it means that job growth and income increases have not been exceptional.

Now we are faced with what we believe could be the defining moment for a sustained stock market and economic decline worthy of being deemed (by NBER) a recession.  The factors that go into this assessment are based on our interpretation of Dow Theory and the vacillations of the Industrial Production Index.

Dow Theory

Starting with Dow Theory, we have the following established indications:

  • On August 2, 2011, Dow Theory indicated that we were in the initial stages of a cyclical bear market (article here).  At the time, the Dow Jones Industrial Average (DIA) and the Dow Jones Transportation Average (IYT) fell below their respective June and March 2011 lows.
  • On August 9, 2011, we indicated that a bottom had been reached and that a bear market rally to prior highs was due, within the context of a cyclical bear market (article here).
  • On March 16, 2012, we demonstrated that the divergence between the Dow Jones Industrial Average and the Dow Jones Transportation Average was confirmation that we’re in a Dow Theory bear market rather than a renewed bull market (article here).

Generally speaking, Dow Theory acts as a leading indicator of the direction of the overall economy, with the Industrial Production Index following behind as confirmation.  In this case, this is the first month that the Industrial Production Index (IPI) has declined after the Dow Theory bear market indication of August 2, 2011.

Industrial Production Index

Historically, the Industrial Production Index has “averaged” a decline of 1.44 consecutive months in periods of an economic growth period.  This suggests that if the Industrial Production Index declines for two full months in a row, it would be enough to give us the all clear as to whether we can consider the economy as having reverted back into a recession after the rise from the June 2009 bottom.  This interpretation relies on Dow Theory also having a bear market indication.  In order for this to be the case, The Dow Industrials and Dow Transports would need to remain below their respective 2012/2011 peaks.

Month IPI data
August 2011 94.1845
September 2011 94.3800
October 2011 94.9389
November 2011 95.0939
December 2011 95.9095
January 2012 96.5705
February 2012 96.5731
March 2012 96.5685
Source: St. Louis Fed

What would the Market Impact Be?

So far, we expect that the recessionary period would have at least four consecutive months of declines in the Industrial Production Index (IPI) and a total of at least  7 non-consecutive months of declines within the period considered a recession.  This would be on par with the recession from July 1990 to March 1991.  At the time of the 1990 to 1991 recession, the S&P 500 (SPY) declined -19.61% and the Nasdaq Composite Index declined –29.90%.

However, The stock market typically leads the call of a recession by topping out first.  this suggests that potentially, the April 2, 2012 high for the Dow Industrials was the top and we're now in a declining trend at least until August/September 2012 to 10,611.59.

Again, our preliminary prediction is that if we see a second month of declines in the Industrial Production Index while the Dow Theory bear market indication is in place, we’ll have what will be considered a recession by the NBER which would be announced from 9 months to a year after the fact.

As a sidebar to the discussion of the possibility of a recession, the long-term gold stock positions that we've recently recommended which includes Agnico-Eagle (AEM),  Gold Fields Ltd. (GFI) and Newmont Mining (NEM) will require reduced exposure or sold off since gold and silver stocks tend to perform worse than the general stock market during a recession.

Note: Industrial Production Index data is subject to constant revisions by the Federal Reserve Bank.  We hope to reassess the Industrial Production Index based on the most updated information that is provided by the Federal Reserve.

What Does Warren Buffett See in IBM? Maybe This

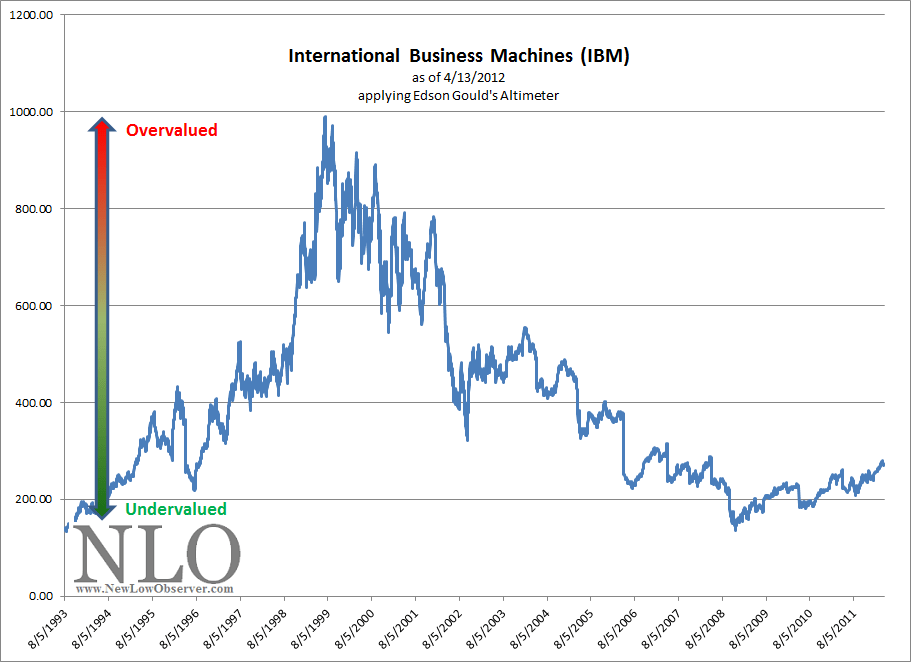
We don’t talk fundamentals much, if at all.  However, the chart below says a lot about why Warren Buffett might bother with buying IBM, a technology company, when the stock is trading near an all time high.

image

Buffett's latest annual report goes to great length in citing IBM's stock repurchase plan among other reasons why he bought the company's shares.  Buffett says the following:

"Let’s do the math. If IBM’s stock price averages, say, $200 during the period, the company will acquire 250 million shares for its $50 billion. There would consequently be 910 million shares outstanding, and we would own about 7% of the company. If the stock conversely sells for an average of $300 during the five-year period, IBM will acquire only 167 million shares. That would leave about 990 million shares outstanding after five years, of which we would own 6.5%.

"If IBM were to earn, say, $20 billion in the fifth year, our share of those earnings would be a full $100 million greater under the 'disappointing' scenario of a lower stock price than they would have been at the higher price. At some later point our shares would be worth perhaps $1.5 billion more than if the 'high-price' repurchase scenario had taken place." (Source: 2011 Berkshire Hathaway Annual Report. page 6)

In order for IBM to make ever increasing dividend payments and massive stock repurchases, IBM has to be generating serious cash flow.  The combination of the two are creating an undervalued situation that may not exist for quite some time in the future.

As we’ve said before, Edson Gould’s Altimeter is a summary of relative values for a stock's price which only requires additional fundamental information for support.  We saw a similar undervalued Altimeter in Transatlantic Holdings (TRH) and Wesco Financial (WSC) which prompted our articles titled "Transatlantic Holdings: A Value Proposition Worth Consideration" and "Wesco Financial: Fundamentals and Technicals Are Aligned" before Buffett made a bid for both companies.

In this case, the dividend has been rising much faster than the stock price, among the many reasons that Buffett might be interested in a technology stock near an all-time high.

Now, just imagine what the stock will look like after falling to a 52-week low.

Transaction Alert: Sold NUGT at the Market

We sold NUGT at the market this morning at a minor gain. Two factors played in the decision to sell even though we just had a buy signal the day before:

  •  Last night, the Industrial Production Index (found here: St. Louis Federal Reserve Bank) declined for the first time since the Dow Theory Bear Market signal on August 2, 2011.  This may be the nail in the coffin in the bear market rally (Our call on a market bottom and bear market rally found here: August 9, 2011).
  • Yesterday, April 17, 2012, gold fell while gold stocks rose.  Either gold has to increase or gold stocks need to fall.  Today gold is sliding confirming that the run in gold stocks must be false.  We make specific reference to false indications of when gold falls and gold stocks rise (found here: November 2, 2011)

This is the nature of speculation.  We'll re-enter our speculative position at another time.

Transaction Alert: Buying NUGT at the Market

We are buying Direxion Daily Gold Miners Bull 3X Shares (NUGT) at the market on April 17, 2012 as our Gold Stock Indicator was triggered just before the close on April 16, 2012.

As we’ve mentioned in the past, we are only seeking gains of +7.5% in NUGT.  Our involvement in NUGT is highly speculative and only for short-term gains/losses.

Nasdaq 100 Watch List: April 13, 2012

Below are the Nasdaq 100 companies that are within 20% of their respective 52-week lows. Stocks that appear on our watch lists are not recommendations to buy. Instead, they are the starting point for doing your research and determining the best company to buy. Ideally, a stock that is purchased from this list is done after a considerable decline in the price and rigorous due diligence.

Symbol Name Price P/E EPS Yield P/B % from Low Div/Share
CHRW CH Robinson Worldwide Inc. 64.13 24.48 2.62 2 8.45 2.94% 1.32
CTRP Ctrip.com International Ltd. 21.33 19.01 1.12 0 2.79 3.29% 0
APOL Apollo Group Inc. 36.7 7.99 4.6 0 4.13 3.53% 0
RIMM Research In Motion Limited 12.89 5.81 2.22 0 0.68 3.53% 0
FSLR First Solar, Inc. 20.83 0 -0.46 0 0.52 4.05% 0
EA Electronic Arts Inc. 16.18 0 -0.52 0 2.42 5.34% 0
INFY Infosys Ltd. 49.15 17.01 2.89 1 5.53 6.57% 0.56
GMCR Green Mountain Coffee Roasters 43.59 22.43 1.94 0 3.33 10.58% 0
VOD Vodafone Group plc 26.95 12.36 2.18 3.5 1.04 10.86% 0.95
AMZN Amazon.com Inc. 188.46 137.56 1.37 0 11.19 12.87% 0
ORCL Oracle Corporation 28.5 14.93 1.91 0.8 3.33 15.29% 0.24
SRCL Stericycle, Inc. 86.1 32.01 2.69 0 6.13 17.86% 0
VMED Virgin Media, Inc. 24.2 64.19 0.38 0.7 6.86 17.93% 0.16
WCRX Warner Chilcott plc 15.34 22.9 0.67 0 57.52 18.91% 0
ATVI Activision Blizzard, Inc. 12.42 13.5 0.92 1.4 1.35 19.42% 0.18
^NDX NASDAQ-100 2,846.04 - - - - - -

Watch List Summary

On this week’s list we’re focusing on the stocks that have single digit price-to-earnings ratios (P/E).  Stock investing theory suggests that investors should focus on, among other things, stocks with a low P/E ratio because the higher the ratio the more expensive a price is being paid for the company’s current and future earnings.

In theory, the P/E ratio reflects the number of years it takes to get to break even on the investment.  In the case of C.H. Robinson (CHRW) with a P/E ratio of 24, it would take 24 years to break even on your investment unless CHRW were able to increase their earnings over time.  As a word of warning, a low P/E can be an indication of a lack of confidence in some aspect of the company’s business model or competitive strategy.  Be on the lookout for the reason why these companies have a low P/E ratio.

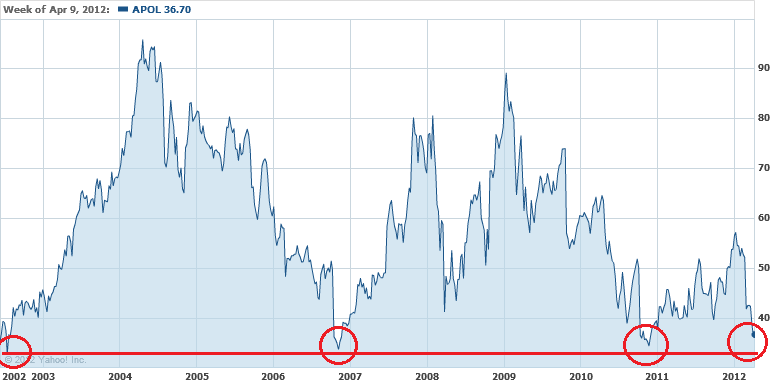
First up is Apollo Group (APOL)  with a P/E ratio of 7.99.  According to Dow Theory, APOL has no downside risk???! This seems to be confirmed by the fact that the stock is near a 52-week low and slightly above the low set in 2007.  Having no apparent downside risk seems implausible so we’ve used the 2000 low of $10 to the high of $93.49 in 2004 to come up with some kind of assessment of risk.  When considered from these levels, APOL has the following downside targets:

  • $28.55
  • $19.27
  • $13.92
  • $10

image

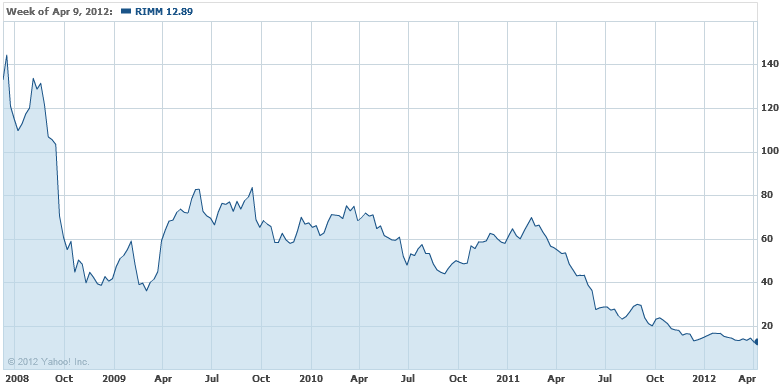
The next stock with a low P/E ratio on our list is Research In Motion (RIMM) with a ratio of 5.81.  RIMM has been batter due to it’s loss of competitive edge against Apple (AAPL) and Google’s (GOOG) Android operating systems.  Our best guess is that if RIMM isn’t going out of business then it must be the single best investment of the decade.  As with lottery tickets the gains are enormous but the odds against winning are significant, this is the way that we’d treat this company.  However, unlike the lottery, RIMM has the potential to rise from the ashes with its large cash hoard and depressed stock price.

image

Watch List Performance Review

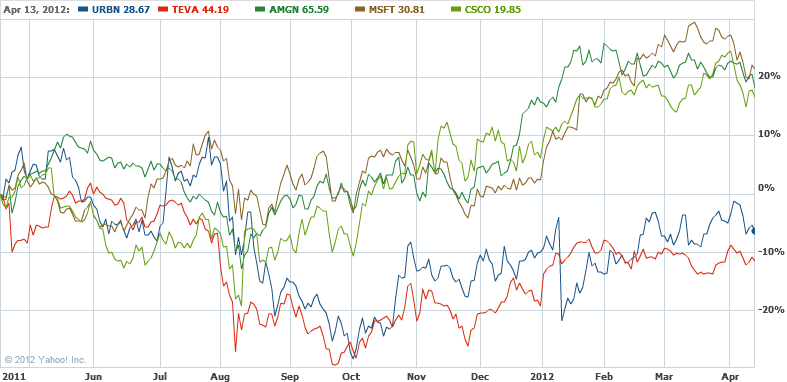
In review of our watch list from April 15, 2011, two of the companies underperformed the Nasdaq 100 index by a wide margin.  However, four of the top five companies on our watch list achieved our goal of +10% within a 1-year timeframe.

Symbol
Name 2011 2012 % change
CSCO Cisco 17.03 19.85 16.56%
URBN Urban Outfitters 30.64 28.67 -6.43%
TEVA Teva Pharma. 50.01 44.19 -11.64%
AMGN Amgen 55.51 65.59 18.16%
MSFT Microsoft 25.37 30.81 21.44%
Average 7.62%
^NDX Nasdaq 100 2408.3 2846.04 18.18%

image

Considering the Downside Prospects for Apple

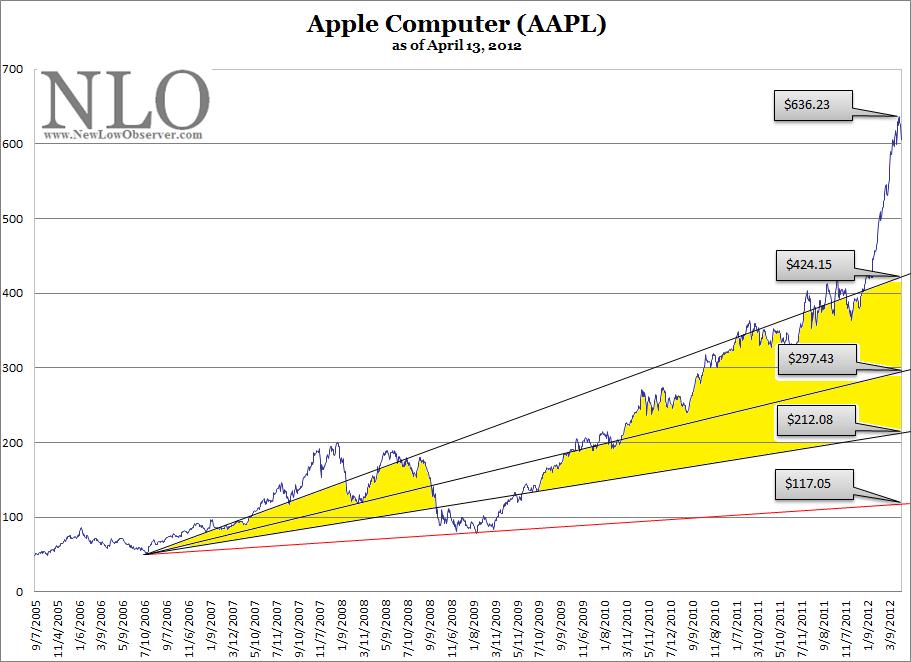
For the New Low Observer team, it has been an uneventful period in our watch of Apple Inc. (AAPL) stock since February 5, 2012 even though the price has risen nearly 40%.  What in the world would we consider eventful in regards to Apple stock? Well, we’d  like to see Apple hit one of Edson Gould’s speed resistance line downside targets.  The chart below is an update of the one that we submitted earlier this year (found here).

image

The new downside targets are as follows:

  • $424.15
  • $297.43
  • $212.08

Based on the current run in Apple Inc. stock, the Dow Theory fair value is $275.44. (636.23-85.35)/2=275.44

As we said on February 5, 2012, “the rampant enthusiasm for AAPL suggests that the stock isn't likely to decline to the indicated levels any time soon.” This has definitely been the case with the impressive run up since the beginning of the year.

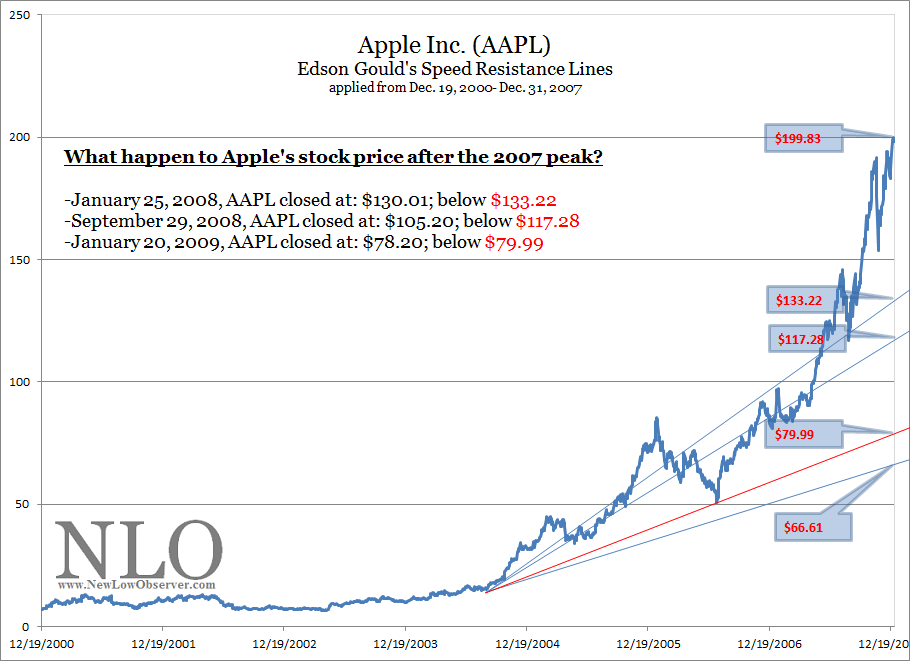
In order to diffuse the legitimate claims that we’re grasping at straws simply to make a bearish case against Apple Inc., we’ve provided the price performance of the stock over a similar 7-year period from December 19, 2000 to December 31, 2007 applying Edson Gould's speed resistance lines, in the chart below.

image

What stands out the most in the period from 2000-2007 is the percentage increase in Apple’s stock price compared to the current run-up as indicated below:

  • 12/19/2000-12/31/2007: +2,300.67%
  • 9/7/2005-4/13/2012: +1,079.56%

If we were to ask the question of what was the likelihood of Apple falling to $133.22 on December 31, 2007, we believe the chorus of Apple investors would say, “not likely, if ever.”  Similarly, we believe that, based on the current speed resistance lines, no one would expect Apple to decline to our conservative downside target of $424 let alone falling to the  $212.08 worst case price.

We’re not advocating that we’ve seen the peak in Apple’s stock price especially when we compare the fundamental data on AAPL between the 2007 peak and the current price:

Apple (AAPL) 2007 2012 % change
Sales per share 27.52 170.2 +518.45
‘‘Cash Flow’’ per share 4.37 46.5 +964.07
Earnings per share 3.93 43.8 +1,014.50
Div’ds Decl’d per share 0 2.65 N/A
Cap’l Spending per share 0.84 5.65 +572.62
Book Value per share 16.66 138.85 +733.43
Common Shs Outst’g 872.33 940 +7.76
P/E Ratio @ high price 43.53 17.23 -60.42
Source: Value Line Investment Survey Oct. 12, 2007 April 6, 2012

However, in 2007, it was justified for a non-dividend paying technology company to have a P/E ratio in the 40’s while a company that could easily become a dividend aristocrat would be considered fairly priced with a P/E ratio of 17.

Since we believe that markets are supremely inefficient, the perceived extremes to the upside are likely to be counteracted to the downside.  Edson Gould’s speed resistance lines provide a progressive downside target as Apple’s price increases.  If the price decline achieves any of the downside targets, we’ll be ready to re-examine the company fundamentals for long and short-term investment opportunities.

Barrick Gold or Newmont Mining?: Edson Gould’s Altimeter Makes the Call

There are few times that we’ll actually recommend individual gold stocks because much of the available statistical data supports the view that gold stocks are inferior investments when compared to products like SPDR Gold Trust (GLD) or the iShares Silver Trust (SLV), let alone the peace of mind with ownership of the physical metals. The following are the three most prominent examples of when gold stocks didn’t make the grade.

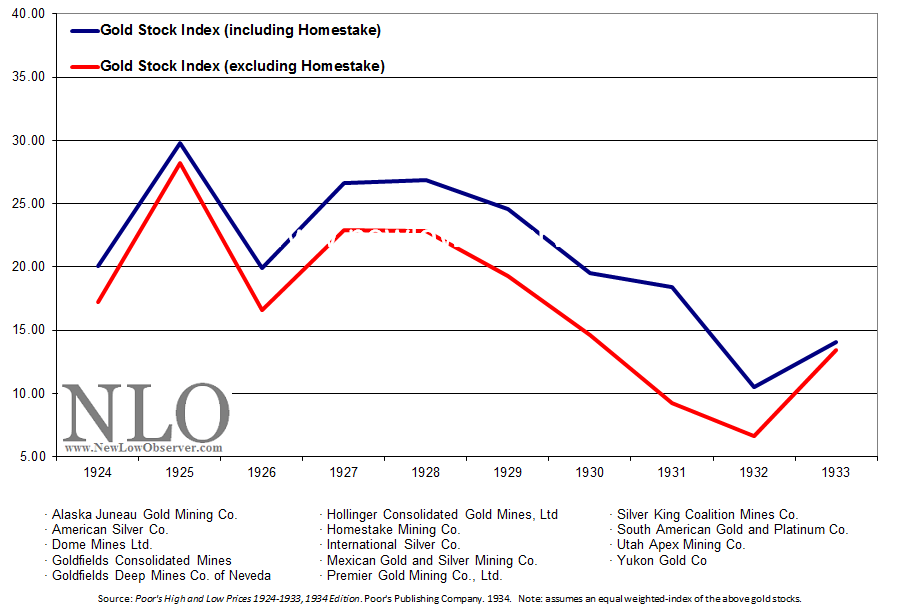
First,  in the period from 1925 to 1932, a basket of gold stocks declined as much as  -64.81% when Homestake Mining is included in the index.  In a article titled “The Lessons of Homestake Mining in Gold Bull and Bear Markets,” we’ve outlined a majority of the reasons why Homestake did so well when other gold stocks didn’t. If we exclude Homestake Mining from the 1925-1932 period, gold stocks declined –76.47% in an equal-weighted gold stock index as reflected below.

image

Second, in the period from 1940 to 1960, although interest rates on the 10-year Treasury bond doubled from 2% to 4% and the 3-month Treasury bill increased nearly 800%, Barron’s Gold Stock Index was virtually unchanged in the same period of time.  Additionally, investors who feared “the coming inflation” and stayed out of general equities missed an inflation adjusted gain of  nearly 400% in the Dow Jones Industrial Average (DIA).

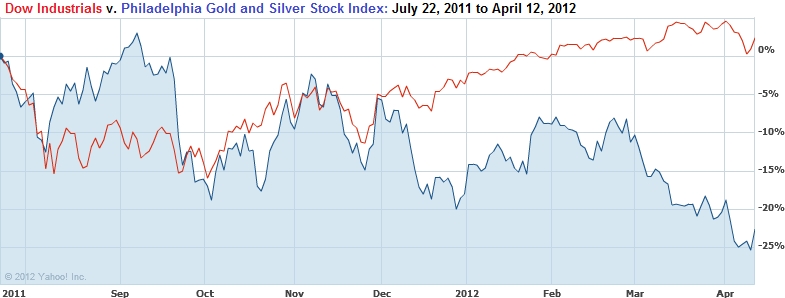
Third, in the middle of the raging gold bull market from 1971 to 1980, gold stocks routinely underperformed the price of gold.  In our articles on Seeking Alpha titled “A Strategy Is Needed for Lagging Gold Stocks” and “Why Gold Will Decline More Than the Markets,” we reviewed the instances where gold stocks routinely underperformed the price of gold or the stock market in general.  Worse still, Barron’s Gold Stock Index peaked in 1974 and declined -66% only to return to breakeven five years later, just before the blow-off stage in the gold bull market.  We can now add the selloff from July 2011 to April 2012 to the long list of severe underperformance of gold stocks, during a bull market in gold.

image

With the above facts in mind, it isn’t taken lightly that we would recommend gold stocks at this point.  However, a strategy is needed in order to outmaneuver the gold stock gremlins. In a recent Seeking Alpha instablog, we outlined the short and long-term gold stock price activity using our Gold Stock Indicator (found here) which is nearing a dual “buy” indication.

In our last article on gold stocks to consider, we used Edson Gould’s Altimeter highlighting Agnico-Eagle (AEM) and Gold Fields (GFI).  In this article we’re going to apply Gould’s Altimeter to Newmont Mining (NEM) and Barrick Gold Corp. (ABX). Gould’s Altimeter reflects the relative value of a stock based on the current dividend that is being paid.  Although Newmont Mining and Barrick Gold Corp. are near one year lows and have consistent dividend policies, Gould’s Altimeter sheds a completely different light on matters, leaving only one company a compelling investment opportunity after additional due diligence.

According to Yahoo!Finance, Newmont Mining engages “in the acquisition, exploration, and production of gold and copper properties. The company’s assets or operations are located in the United States, Australia, Peru, Indonesia, Ghana, New Zealand, and Mexico.”  There are a couple of fundamental attributes that are less than redeeming for Newmont Mining.  First, Newmont has a price to earnings ratio of 67.  This exceeds the norm for anyone who would buy a stock only if it had a p/e ratio of 20 or less.  The next issue is Newmont’s dividend which exceeds the trailing twelve months earnings by 91%.  This could be an issue down the road if earnings and the price of gold do not increase fast enough.

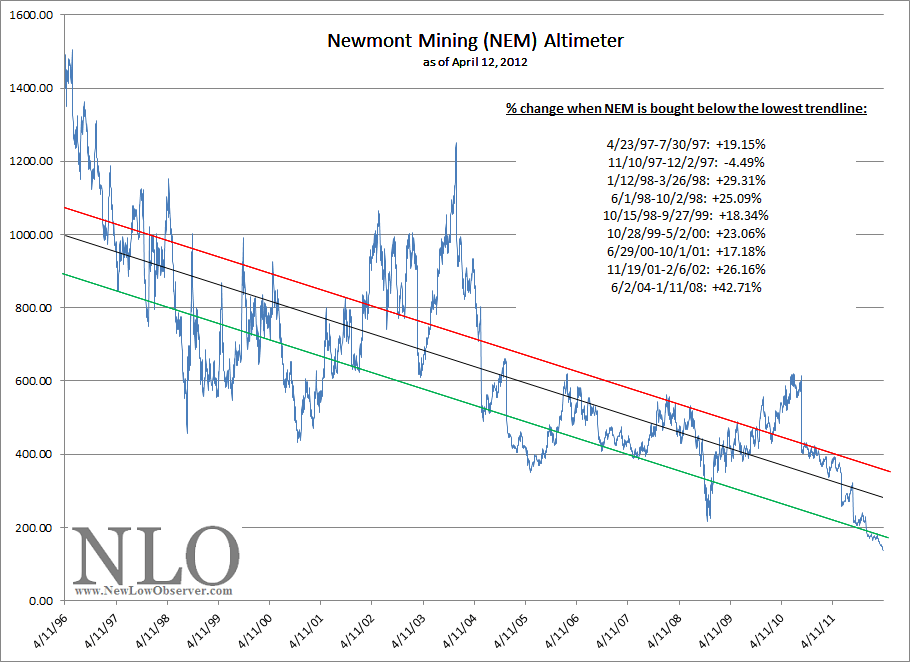
Considering these issues, Edson Gould’s Altimeter below suggests that, although the price of Newmont Mining (NEM) could decline from the current level, a purchase of the stock at or below $55 is considered a reasonable value.

image

The most impressive aspect of Edson Gould’s Altimeter for Newmont Mining is the period from 1996 to 2000 when the stock was in a clear downtrend during the entire time.  Despite this fact, the Altimeter gave clear indications of when Newmont was relatively “undervalued” (lowest trend line) and also overvalued (highest trend line).

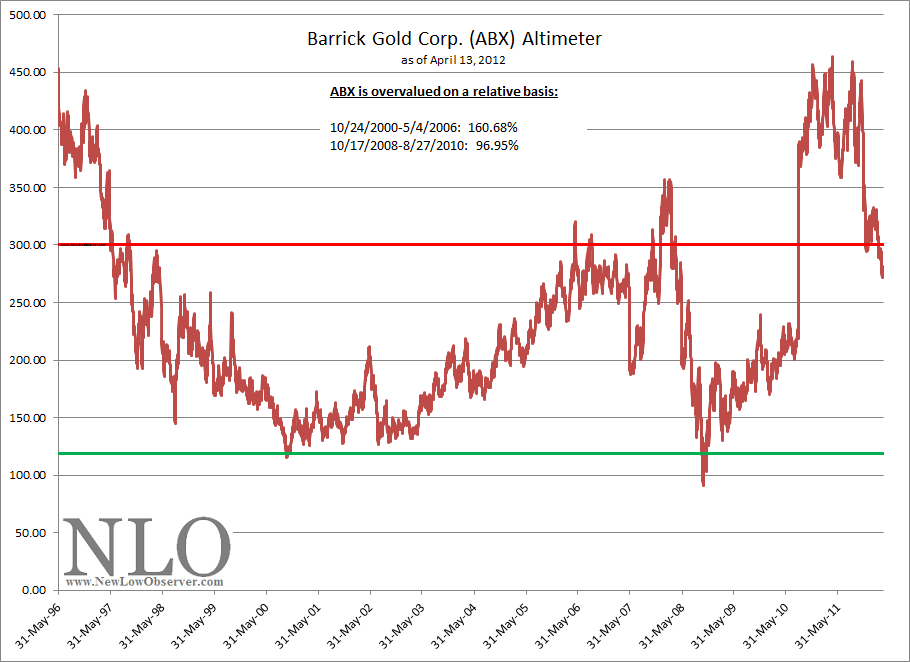
The next stock is Barrick Gold Corp. (ABX).  According to Yahoo!Finance, Barrick Gold is involved in “…the production and sale of gold and copper. The company has a portfolio of 26 operating mines, and exploration and development projects located in North America, South America, the Australia Pacific region, and Africa.”  With Barrick’s earnings at $4.48 and a dividend of $0.60, the dividend payout ratio sits at a paltry 13.39% of earnings.

image 

However, the reduction of the dividend near the middle of 2010 has had a major impact on how the Altimeter reflects Barrick’s relative value, which has played out in the movement in the stock price.  Had the dividend not been cut, Barrick would be characterized as though it were undervalued at the current price.  However, based on the Altimeter, Barrick is considered to be on a declining trend until the Altimeter falls below the 119 level.

In this instance, Newmont has the redeeming attributes that should carry the price much further than Barrick Gold Corp. based on the Altimeters above.

Note: As a word of warning, anyone compelled to invest in Newmont Mining should be mindful of the periods when the Altimeter declines by a wide margin from the lowest trend line (green).  This suggest that, in the short term, there is considerable downside risk.  However, the data in the chart for each period assumes that an investor were to buy at the moment the Altimeter first crosses below the lowest declining trend line.

Transaction Alert: Sold NUGT at the Market

We are selling Direxion Daily Gold Miners Bull 3X Shares (NUGT) after achieving the goal of +7.5%.

Transaction Alert: Selling CWT, Buying GFI

On April 11, 2012, we will be selling our holdings of California Water Services (CWT) and use the proceeds to purchase Gold Fields (GFI).

Gold Stock Indicator Points Up

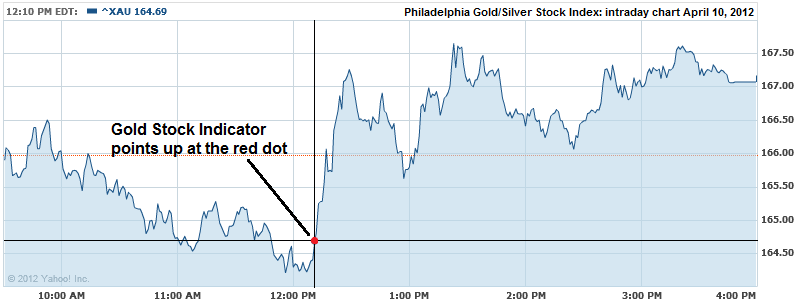
Today at 12:10pm EST, our gold stock indicator signaled that gold stocks were reasonably undervalued.  This indication occurred just after the price of gold started a sharp rise in price today and just before gold stocks started to jump, as indicated in the intraday chart below:

image

  As indicated in our Transaction Alert today (April 10, 2012), we bought Newmont Mining (NEM) as a “long term” holding in gold stocks.  Our view of the long term is predicated on the percentage gain that is achieved and the alternative stocks that appear undervalued at the time.  If the gain has been exceptional in a reasonable period of time and there are better values elsewhere then we may jump ship.

Despite our confidence in the Gold Stock Indicator, we believe that it is necessary to have reasonable expectations for any of the stocks suggested. This means carefully examine the downside risk. As an example, it took Agnico-Eagle (AEM) a little over 1 year to achieve +174%. In that time, AEM traded in a narrow range for a majority of the time and fell almost -30% before reaching such astronomical heights.

Our purchase of the Direxion Daily Gold Miners Bull 3X Shares (NUGT) is strictly a speculation which we will sell soon after it has achieved a gain of +7.5%.  Our examination of 3x gold ETFs (DUST and NUGT) is that a gain of +7.5% is achieved 85% of the time, based on 80 transactions initiated by our Gold Stock Indicator since 1983.  Direxion’s DUST and NUGT ETFs are strictly for speculators (short-term) and should not be entered into for investment (long-term) purposes.  You have been warned.

Our last Gold Stock Indicator signal can be found here: Gold Stock Indicator Points Down

Transaction Alert: Bought NUGT and NEM at the Market

Today our Gold Stock Indicator fell to a level which has yielded at least 7.5% gains in NUGT more than 85% of the time.  We have bought NUGT and NEM at the market and will update this information after the close of the market today.

Gold Stocks to Consider Based on Our Indicator

In light of our Gold Stock Indicator approaching the long term buy signal (found here), we have decided to go over the gold stocks that pay a dividend and are near their respective 52-week lows.  In this review, we’re going to cover Agnico-Eagle Mines Ltd. (AEM) and Gold Fields Ltd. (GFI).  When, and if, the Gold Stock Indicator actually reaches the long term buy indication it will be posted to our site.  The stocks that we cover here are for you to do additional due diligence before taking any action.

Agnico-Eagle Mines Ltd. (AEM) closed at $32.37 on Thursday April 5, 2012.  Agnico-Eagle is currently operating at an annual loss of -$3.36 according to Yahoo!Finance.  Contributing factors to Agnico-Eagle’s decline in price over the last year has been problems with the operation of their mines.

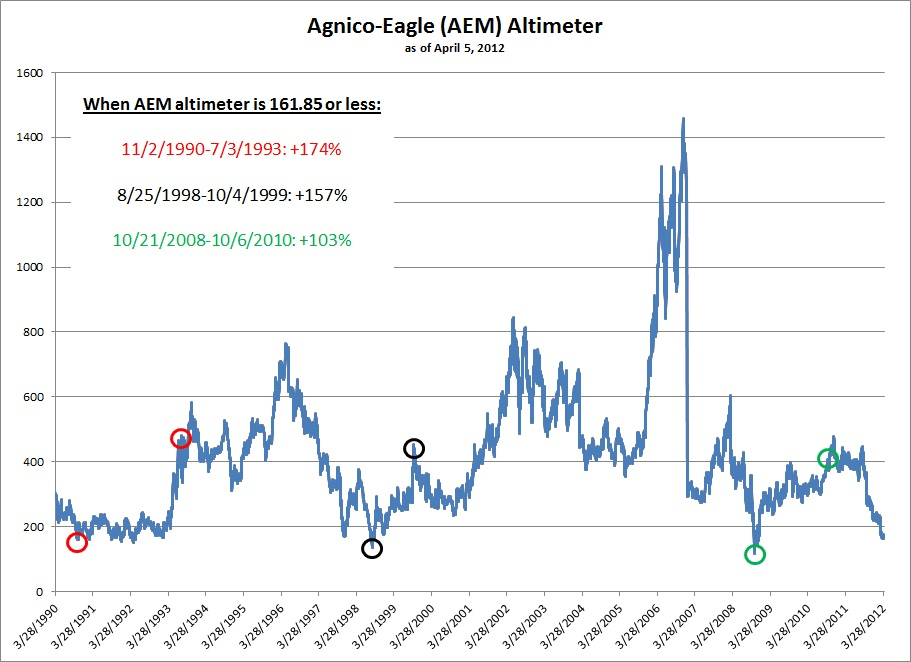
As described in many of our previous articles, Edson Gould’s Altimeter is based on the stock’s price relative to the actual dividend paid.  The Altimeter is a critical real-time assessment of value based on the company’s dividend.  Below is the altimeter for Agnico-Eagle:

image

In our assessment of Agnico-Eagle, we have compared the current level of the Altimeter at 161.85 and compared it to other times when Agnico-Eagle has trade at the same relative level, or below, and traded up to 400 on the indicator.  In the case of Agnico-Eagle there were two periods, before the bull market in gold stocks began, that the stock was selling at a low and was a great buy (based on the altimeter).  In the period from November 2, 1990 to July 3, 1993, Agnico-Eagle rose +174% and in the period from August 25, 1998 to October 4, 1999 rose +157%.

Since the gold bull market began, the only other time that Agnico-Eagle was selling below 161.85 and subsequently traded up to the 400 level was the period from October 21, 2008 to October 6, 2010 for a gain of 103%, this far exceeded the gains of the SPDR Gold Shares (GLD) over the exact same period of time.

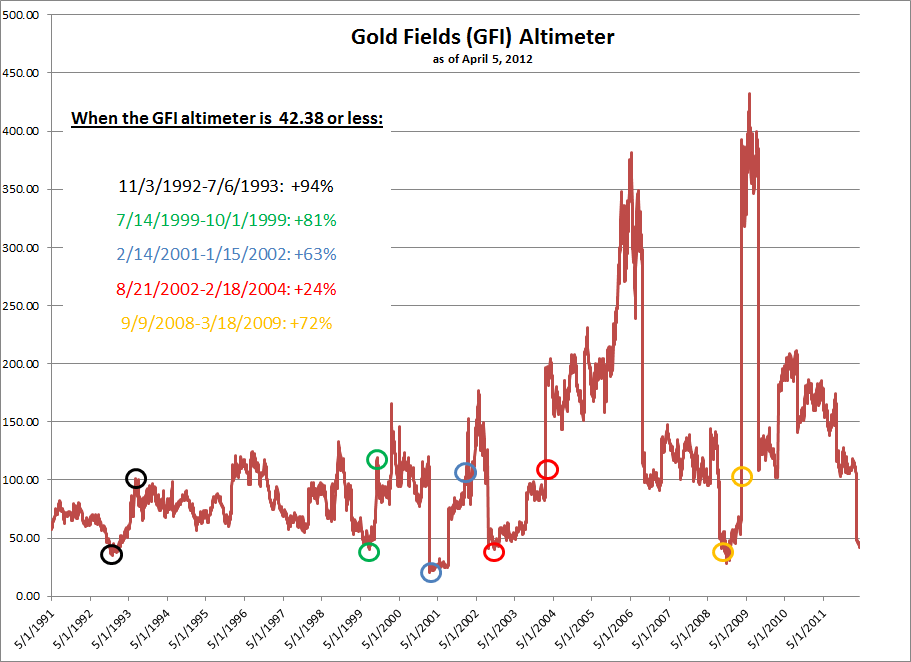
Next in our review is Gold Fields Ltd. (GFI).  Gold Fields sports trailing earnings of $1.22 in the last twelve months  and a dividend of $0.61 with a dividend yield of 4.70%.  Yahoo!Finance indicates that Gold Fields operates “in South Africa, Peru, Ghana, and Australia.” Based on the majority of countries that Gold Fields operates, there is some political risk to this investment.  However, Gold Fields has exhibited amazing consistency in the Altimeter below:

image

Presently, Gold Fields is trading at the Altimeter level of 42.38.  The chart depicts the times when GFI was bought at the 42.38 level and sold whenever the Altimeter reached 100.  The results are amazing and provide clear evidence on how gold stocks can outperform the price of gold when combining Edson Gould’s Altimeter with our Gold Stock Indicator.

Our approach to buying these stocks is to purchase in two stages, once at, or near, current levels and a second time only if the stocks fall -20% below the initial purchase price.  As an example, if we have $10,000 that we’d like to invest then we buy $5,000 now and hold the remaining funds unless/until the stock declines by -20%.  We’re basically hedging with cash if we’re wrong.  If we’re right about our first investment (the stock price rises) then we can use the cash to buy another stock near a new low.

Before bothering with the first of many gold stocks that we’ll be covering based on our Gold Stock Indicator, please review the following questions and answers:

  • Is there downside risk to taking positions in gold stocks at this time? Yes, price declines can reach as much as -50% within the first two months of the purchase.
  • Are you comfortable with declines of -50% or more?  If not, then don’t bother with these stocks at this time.  If you’re wondering about the logic of recommending anything that might decline by as much as –50% then please read our view on the topic (found here).
  • Could these stocks have been held for the “long-term?”  Ideally, yes, however, we believe that history is not on the side of gold stocks relative to the price of gold as we described in greater detail in our article titled “A Strategy is Needed For Lagging Gold Stocks”.

We believe that Edson Gould’s Altimeter, when revealing consistent relative values, yields highly favorable results.  While we always seek to purchases at a relative low, we always set a target for selling at higher levels rather than “holding for the long term.”  Our analysis could change if the stocks mentioned above dramatically increase or decrease their dividend.