Author Archives: nlo-admin

Analyst Estimate: Dividend Watch List

Below is a ranking from our November 9, 2012 watch list based on the analyst’s low earnings estimate for 2013. This list ranks the potential price gain at 10% and above assuming that the analyst’s lowest estimate for earnings materialize and the P/E ratio remains the same as when our original watch list was created.

We chose to utilize the analyst’s low estimates because the mean and high estimates for stocks tend to be too optimistic. By going with the lowest or most pessimistic estimate, we have the ability to “play it safe” for the company prospects going forward.

Symbol
Name Price % Yr Low P/E EPS (ttm) 2013 low EPS est. # of analysts est. price est. % change
UNM Unum Group 19.66 7.55% 23.13 0.85 3.2 16 $74.02 276.48%
JCI Johnson Controls Inc  25.52 9.20% 14.34 1.78 2.76 18 $39.58 55.09%
FRS Frisch’s Restaurants, Inc 17.75 6.29% 16.9 1.05 1.48 n/a $25.01 40.91%
TMP Tompkins Financial Corp. 38.65 7.90% 15.84 2.44 3.38 3 $53.54 38.52%
ABM ABM Industries, Inc. 19.02 6.55% 19.61 0.97 1.32 6 $25.89 36.09%
SON Sonoco Products Co. 30.45 6.43% 17.11 1.78 2.3 14 $39.35 29.24%
FDS FactSet Research Systems 89.83 5.21% 21.8 4.12 5.07 8 $110.53 23.04%
UTX United Technologies Corp. 75.84 7.71% 15.6 4.86 5.98 18 $93.29 23.01%
WGL WGL Holdings, Inc. 38.19 1.43% 19.39 1.97 2.4 7 $46.54 21.85%
MSEX Middlesex Water Company  18.65 7.37% 21.69 0.86 1.04 3 $22.56 20.95%
OMI Owens & Minor, Inc. 29.02 6.03% 16.97 1.71 2.05 7 $34.79 19.88%
STBA S&T BanCorp., Inc.  16.51 5.29% 13.99 1.18 1.4 7 $19.59 18.63%
BUSE First Busey Corp.  4.41 1.38% 20.05 0.22 0.26 5 $5.21 18.21%
EGN Energen Corp. 43.43 8.22% 15.29 2.84 3.35 12 $51.22 17.94%
RAVN Raven Industries, Inc.  27.4 9.21% 18.77 1.46 1.69 1 $31.72 15.77%
NJR New Jersey Resources Corp. 41.21 0.68% 18.23 2.26 2.61 6 $47.58 15.46%
IBKC IBERIABANK Corp.  47.9 8.18% 19.01 2.52 2.9 10 $55.13 15.09%
PEP PepsiCo Inc. 68.85 10.78% 18.31 3.76 4.31 14 $78.92 14.62%
IBM IBM 189.64 7.10% 13.63 13.91 15.88 23 $216.44 14.13%
APD Air Products & Chemicals, Inc. 79.73 4.76% 14.66 5.44 6.2 17 $90.89 14.00%
TNC Tennant Co. 36.96 6.24% 18.12 2.04 2.3 4 $41.68 12.76%
JW-A John Wiley & Sons Inc. CL ‘A’ 42.34 0.76% 13.03 3.25 3.6 2 $46.91 10.79%
CAH Cardinal Health, Inc.  40 8.37% 12.66 3.16 3.49 15 $44.18 10.46%
FNB F.N.B. Corp. 10.65 8.78% 13.83 0.77 0.85 10 $11.76 10.38%

The refinement of our November 9, 2012 watch list should improve the usefulness of that list as a way of determining which companies to concentrate your investment dollars. The very last column is where we believe additional adjustments could be made. As an example, the very first stock on our list is UNM with an expected gain of +276.48% in the coming year (assuming the P/E ratio remains the same with the estimated 2013 earnings). We like to assume that we’d only achieve half of what the potential might be. In the case of UNM, our adjusted expectation is that the stock could gain as much as +138.24% (all thing being equal).

Transaction Alert: Bought Leucadia National Corp. (LUK)

  • We have taken a 10% position in Leucadia National Corp (LUK).

Today it was announced that Leucadia (LUK) was going to acquire the remaining shares of Jefferies (JEF) that it didn’t already own (found here).  LUK has fallen nearly -4.5% on the news of the deal.  Leucadia (LUK) is considered a “mini-Berkshire” due to management success at allocating capital to highly profitable ventures.

U.S. Dividend Watch List: November 9, 2012

Below are the 66 companies on our U.S. Dividend Watch List that are within 11% of their respective 52-week lows. Stocks that appear on our watch lists are not recommendations to buy. Instead, they are the starting point for doing your research and determining the best company to buy. Ideally, a stock that is purchased from this list is done after a considerable decline in the price and rigorous due diligence.

Symbol Name Price % Yr Low P/E EPS (ttm) Dividend Yield Payout Ratio
INTC Intel Corp.  20.80 0.00% 9.08 2.29 0.90 4.33% 39%
NWN Northwest Natural Gas Co. 42.77 0.19% 18.92 2.26 1.82 4.26% 81%
ED Consolidated Edison, Inc.  55.74 0.38% 14.63 3.81 2.42 4.34% 64%
NJR New Jersey Resources Corp. 41.21 0.68% 18.23 2.26 1.60 3.88% 71%
JW-A John Wiley & Sons Inc. CL 'A' 42.34 0.76% 13.03 3.25 0.80 1.89% 25%
MCD McDonald's Corp.  84.74 0.82% 15.96 5.31 3.08 3.63% 58%
WABC Westamerica BanCorp.  41.34 1.08% 13.78 3.00 1.48 3.58% 49%
BUSE First Busey Corp.  4.41 1.38% 20.05 0.22 0.16 3.63% 73%
WGL WGL Holdings, Inc. 38.19 1.43% 19.39 1.97 1.60 4.19% 81%
ADM Archer Daniels Midland Co. 25.39 1.48% 17.76 1.43 0.70 2.76% 49%
SRCE 1st Source Corp.  20.83 1.61% 10.63 1.96 0.68 3.26% 35%
CLC Clarcor Inc. 44.51 2.51% 18.32 2.43 0.54 1.21% 22%
SJW SJW Corp. 23.40 3.17% 19.18 1.22 0.71 3.03% 58%
PNY Piedmont Natural Gas Co., Inc. 29.84 3.25% 19.13 1.56 1.20 4.02% 77%
ATR AptarGroup Inc. 48.02 3.31% 19.76 2.43 0.88 1.83% 36%
CWT California Water Service 17.61 3.35% 16.16 1.09 0.63 3.58% 58%
MATW Matthews International Corp.  28.83 3.41% 12.99 2.22 0.36 1.25% 16%
SJI South Jersey Industries, Inc. 48.31 3.85% 14.25 3.39 1.61 3.33% 47%
SFNC Simmons First National Corp.  23.51 4.26% 15.47 1.52 0.80 3.40% 53%
ETP Energy Transfer Partners L P 42.08 4.70% 9.48 4.44 3.58 8.51% 81%
UBSI United Bankshares, Inc.  23.61 4.75% 14.57 1.62 1.24 5.25% 77%
APD Air Products & Chemicals, Inc. 79.73 4.76% 14.66 5.44 2.56 3.21% 47%
CASY Caseys General Stores, Inc. 49.27 4.90% 16.31 3.02 0.66 1.34% 22%
FDS FactSet Research Systems 89.83 5.21% 21.80 4.12 1.24 1.38% 30%
DBD Diebold, Inc. 29.54 5.27% 11.19 2.64 1.14 3.86% 43%
STBA S&T BanCorp., Inc.  16.51 5.29% 13.99 1.18 0.60 3.63% 51%
WEYS Weyco Group, Inc.  22.90 5.53% 14.87 1.54 0.68 2.97% 44%
THFF First Financial Corp. 28.64 5.80% 11.02 2.60 0.94 3.28% 36%
OMI Owens & Minor, Inc. 29.02 6.03% 16.97 1.71 0.88 3.03% 51%
VVC Vectren Corp. 28.64 6.03% 14.46 1.98 1.42 4.96% 72%
RBCAA Republic BanCorp., Inc.  20.43 6.19% 3.61 5.66 0.66 3.23% 12%
TNC Tennant Co. 36.96 6.24% 18.12 2.04 0.72 1.95% 35%
FRS Frisch's Restaurants, Inc 17.75 6.29% 16.90 1.05 0.64 3.61% 61%
GD General Dynamics Corp. 64.45 6.35% 9.59 6.72 2.04 3.17% 30%
SON Sonoco Products Co. 30.45 6.43% 17.11 1.78 1.20 3.94% 67%
ABM ABM Industries, Inc. 19.02 6.55% 19.61 0.97 0.58 3.05% 60%
DCI Donaldson Co. Inc. 32.58 6.78% 18.83 1.73 0.36 1.10% 21%
AMAT Applied Materials Inc. 10.67 7.02% 12.86 0.83 0.36 3.37% 43%
IBM International Business Machines 189.64 7.10% 13.63 13.91 3.40 1.79% 24%
ANAT American National Insurance 71.35 7.16% 10.46 6.82 3.08 4.32% 45%
TEG Integrys Energy Group Inc 52.00 7.33% 16.40 3.17 2.72 5.23% 86%
MSEX Middlesex Water Company  18.65 7.37% 21.69 0.86 0.75 4.02% 87%
BDX Becton, Dickinson and Co. 75.23 7.39% 13.46 5.59 1.80 2.39% 32%
EXPD Expeditors International 36.73 7.40% 22.96 1.60 0.56 1.52% 35%
PPL PP&L Corporation 28.68 7.50% 11.03 2.60 1.44 5.02% 55%
UNM Unum Group 19.66 7.55% 23.13 0.85 0.52 2.64% 61%
GRC Gorman-Rupp Company 26.50 7.68% 18.79 1.41 0.40 1.51% 28%
UTX United Technologies Corp. 75.84 7.71% 15.60 4.86 2.14 2.82% 44%
TMP Tompkins Financial Corp. 38.65 7.90% 15.84 2.44 1.52 3.93% 62%
IBKC IBERIABANK Corp.  47.90 8.18% 19.01 2.52 1.36 2.84% 54%
EGN Energen Corp. 43.43 8.22% 15.29 2.84 0.56 1.29% 20%
CAH Cardinal Health, Inc.  40.00 8.37% 12.66 3.16 1.10 2.75% 35%
RLI RLI Corp. 67.05 8.39% 12.89 5.20 1.28 1.91% 25%
HRL Hormel Foods Corp. 29.61 8.54% 16.45 1.80 0.60 2.03% 33%
CAT Caterpillar Inc. 84.95 8.56% 8.70 9.76 2.08 2.45% 21%
ERIE Erie Indemnity Company  66.43 8.67% 22.91 2.90 2.21 3.33% 76%
FNB F.N.B. Corp. 10.65 8.78% 13.83 0.77 0.48 4.51% 62%
SBSI Southside Bancshares, Inc.  20.80 9.15% 10.00 2.08 0.80 3.85% 38%
JCI Johnson Controls Inc  25.52 9.20% 14.34 1.78 0.72 2.82% 40%
RAVN Raven Industries, Inc.  27.40 9.21% 18.77 1.46 0.42 1.53% 29%
COP ConocoPhillips 55.67 9.98% 6.84 8.14 2.64 4.74% 32%
CBU Community Bank System, Inc. 26.31 10.18% 13.36 1.97 1.08 4.10% 55%
TRMK Trustmark Corp.  22.18 10.24% 12.67 1.75 0.92 4.15% 53%
HRC Hill-Rom Holdings, Inc. 27.31 10.61% 14.08 1.94 0.50 1.83% 26%
CTWS Connecticut Water Service, Inc.  28.93 10.63% 18.43 1.57 0.97 3.35% 62%
PEP PepsiCo Inc. 68.85 10.78% 18.31 3.76 2.15 3.12% 57%
66 Companies

Watch List Review

Market weakness continued to take stocks down.  Intel broke $21 support level and is right at the 52-week low of $20.80, yielding 4.3% and a P/E below 10.  There were rumors of Apple moving away from Intel based chips for their Mac products.  That may be another catalyst that takes the stock lower but Mac is now a minor part of Apple’s business.  Though the day will eventually come that Apple will not run on Intel chips, they will need a company to manufacture or fabricate their chips and we believe Intel will be the forerunner for that.

The top two through four spots are utility companies, Northwest Natural Gas (NWN), Consolidated Edison (ED), and New Jersey Resources (NJR).  All of them yield more than 3.5% and two (NWN & ED) have yields north of 4%.  While that yield is attractive, utilities typically will reach much higher yield at the bottom of utility cycle.

Fifth on our list is John-Wiley & Son (JW-A), the publishing company.  We here at the New Low Observer are intrigued by this company because of the recent merger between Pearson's Penguin Books with Bertelsmann's Random House (found here).  We believed there are value here and a possible buy point near the low would not be unusual.  The dividend payout ratio is very conservative at 25% but the yield remains quite low compared to other companies on our list.

Top Five Performance Review

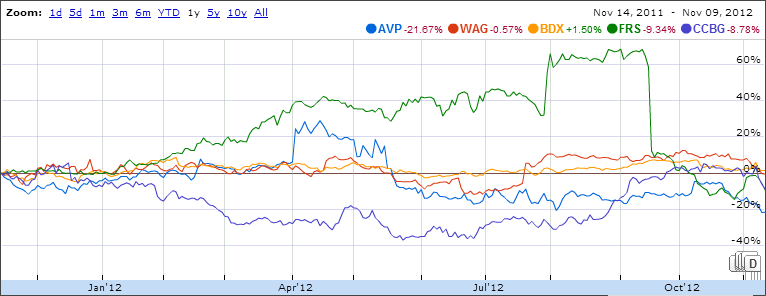
In our ongoing review of the NLO Dividend Watch List, we have taken the top five stocks on our list from November 11, 2011 and have check their performance one year later. The top five companies on that list can be seen in the table below.

Symbol Name 2011 Price 2012 Price % change
AVP Avon Products, Inc. 18.23 14.28 -21.67%
WAG Walgreen Co. 32.85 32.66 -0.58%
BDX Becton, Dickinson and Co. 74.12 75.23 1.50%
FRS Frisch's Restaurants, Inc 19.54 17.75 -9.16%
CCBG Capital City Bank Group  10.35 9.44 -8.79%
Average -7.74%
DJI Dow Jones Industrial 12,153.68 12,815.39 5.44%
SPX S&P 500 1,263.85 1,379.85 9.18%

image

Our top five failed miserably to perform in the 1-year time frame, underperforming the market by a wide margin.  Although Avon (AVP) fell 21% year-over-year, the stock spiked in April giving investors a chance to lock in some gains.

We did manage to buy AVP on November 15, 2011 and sell the stock on March 30, 2012 for a +10% gain in over 4 months.  Conceptually, we hope that it is clear that we're targeting 10% gains in short periods of time for the purpose of avoiding the -21% losses in "longer" duration periods that can be incurred as a result of the "buy-and-hold" philosophy being inappropriately applied.

Gold Stock Indicator: Trending Down

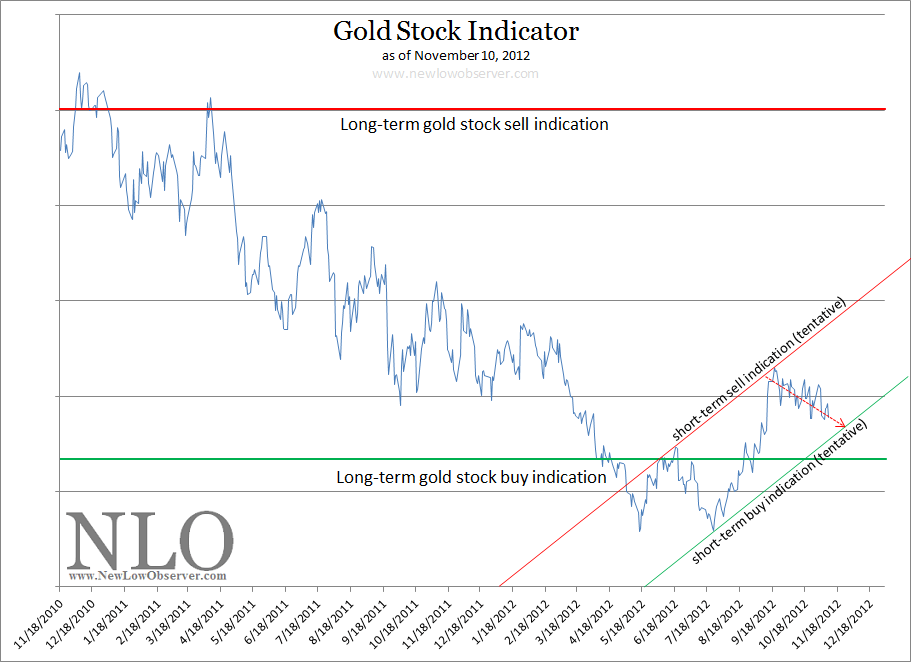
So far, our Gold Stock Indicator has been trending from the short-term sell indication to the short-term buy indication.

image

Based on our calculations,  the trend lower, to the short-term buy indication, is slated to last over the next 7-10 trading days.  There is the off chance that the trend could overshoot and actually achieve the long-term gold stock buy indication.  This would be an ideal opportunity to line up your selection of gold stocks or ETFs.

In the News: November 10, 2012

Analyst Estimate: Dividend Watch List

Below is a ranking from our October 26, 2012 watch list based on the analyst’s low earnings estimate for 2013.  This list ranks the potential price gain at 10% and above assuming that the analyst’s lowest estimate for earnings materialize and the P/E ratio remains the same as when our original watch list was created.

We chose to utilize the analyst’s low estimates because the mean and high estimates for stocks tend to be too optimistic.  By going with the lowest or most pessimistic estimate, we have the ability to “play it safe” for the company prospects going forward.

Symbol
Name Price % Yr Low P/E EPS (ttm) 2013 low EPS est. # of analysts est. price est. % change
ABM ABM Industries, Inc. 18.87 5.71% 19.45 0.97 $1.32 6 $25.67 36.06%
SON Sonoco Products Co. 31.06 8.56% 17.45 1.78 $2.30 14 $40.14 29.22%
FDS FactSet Research Systems 90.85 6.41% 22.05 4.12 $5.07 8 $111.79 23.05%
WGL WGL Holdings, Inc. $39.50 4.91% 20.05 $1.97 $2.40 7 $48.12 21.82%
RAVN Raven Industries, Inc.  27.27 8.69% 18.68 1.46 $1.69 1 $31.57 15.77%
EMR Emerson Electric Co. 47.84 9.75% 14.5 3.3 $3.81 18 $55.25 15.48%
NJR New Jersey Resources 44.6 8.49% 19.73 2.26 $2.61 6 $51.50 15.46%
CWT California Water Service 18.43 7.53% 20.94 0.88 $1.01 7 $21.15 14.76%
IBM IBM 193.27 9.16% 13.89 13.91 $15.88 23 $220.57 14.13%
CAH Cardinal Health, Inc.  40.43 9.54% 13.21 3.06 $3.49 15 $46.10 14.03%
APD Air Products & Chemicals $77.92 2.38% 14.32 $5.44 $6.20 17 $88.78 13.94%
TNC Tennant Co. 37.35 7.36% 18.31 2.04 $2.30 4 $42.11 12.75%
ERIE Erie Indemnity Company  $62.59 2.39% 22.27 $2.81 $3.15 2 $70.15 12.08%
MDU MDU Resources Group 21.48 9.31% 19.01 1.13 $1.26 7 $23.95 11.51%
OMI
Owens & Minor, Inc. 28.76 5.08% 15.63 1.84 $2.05 7 $32.04 11.41%
JW-A John Wiley & Sons Inc. $43.20 1.74% 13.29 $3.25 $3.60 2 $47.84 10.75%

The refinement of our October 26, 2012 watch list should improve the usefulness of that list as a way of determining which companies to concentrate your investment dollars.  The very last column is where we believe additional adjustments could be made.  As an example, the very first stock on our list is ABM with an expected gain of +36.06% in the coming year (assuming the P/E ratio remains the same with the estimated 2013 earnings).  We like to assume that we’d only achieve half of what the potential might be.  In the case of ABM, our adjusted expectation is that the stock could gain as much as +18.08% (all thing being equal).

Research Request: Exelon (EXC)

A reader has requested that we give our unconventional take on a stock.  Our analysis will not rely on the typical fundamental analysis since such work is a penny a dozen.  However, our work on this topic may overlap with similar fundamental analysis.

The first thing that we notice about Exelon (EXC) is the all too familiar parabolic move in the stock price since 2002.  This always begs the question, “when will entropy set in?”  According to David Maranette, entropy (going from a state of order to disorder) is most present when a stock goes parabolic, the greater the degree of ascent the greater the subsequent collapse (disorder).  Exelon is no exception in this regard, the rise and fall has been spectacular.  The only question now is, how far to the downside.

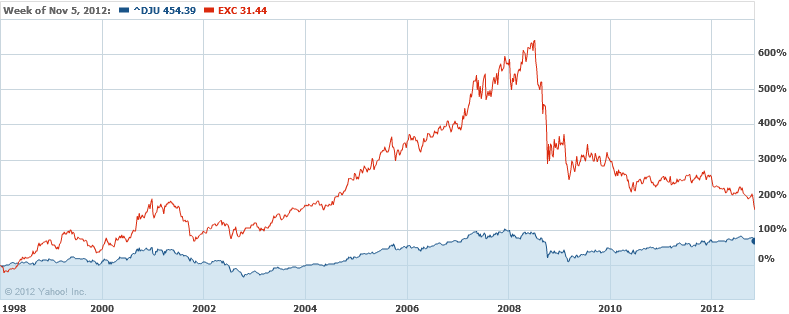
The chart below depicts the relative change that has occurred between the Dow Jones Utility Index (^DJU) and Exelon (EXC).  The run that EXC has had in comparison to the average “high quality” index of utilities seems inordinate.  Especially when we consider that we’re at a historic low point for interest rates.  Any sudden change of interest rates to the upside will decimate all utilities, especially those that have had an excessive run to the upside.  As the market has adjusted the view on the prospects for EXC, the possibility exists that a swing to the opposite extreme is in the making for Exelon.

image

According to Dow Theory, EXC has the following downside targets:

  • $27.84
  • $18.68
  • $9.47

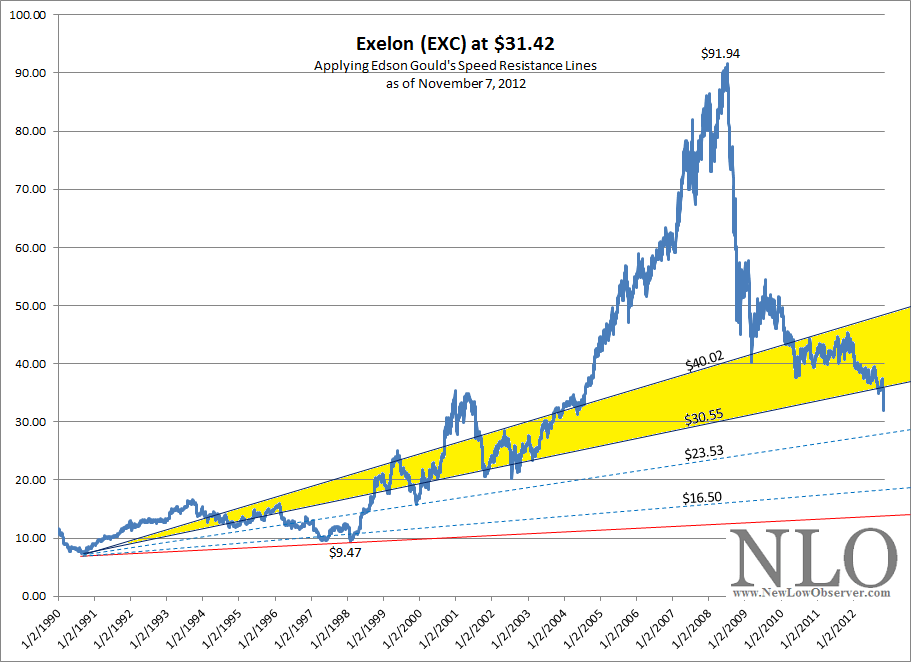
Edson Gould’s Speed Resistance Lines [SRL] project the following downside targets:

image

Already, Exelon has declined below the conservative downside target of $40.02 and is presently on course to hit the $30.55 level.  If EXC does not reverse course at the $30.55 level then the next downside target is $9.47.  We’ve added intermediate reversal points where EXC could change direction if the stock were to decline to the $23.53 and $16.50 levels.

According to Value Line Investment Survey, EXC normally trades around 1x the per share dividend divided by the “interest rate” (1x $2.10/interest rate). Value Line doesn’t tell us by which interest rate we should apply to the company, so we have decided to apply the 30, 20, and 10-year U.S. Treasury rate (found here). The following are the mean prices that EXC would trade at for each interest rate scenario:

  • 30-year rate- $72.66
  • 20-year rate- $84.00
  • 10-year rate- $120.00

Based on the 30-year rate, EXC is selling 56.73% below the historical mean value.  When a stock is trading at such an extreme level of undervaluation, we can only infer that there are more problems beneath the surface in spite  of what is already known. 

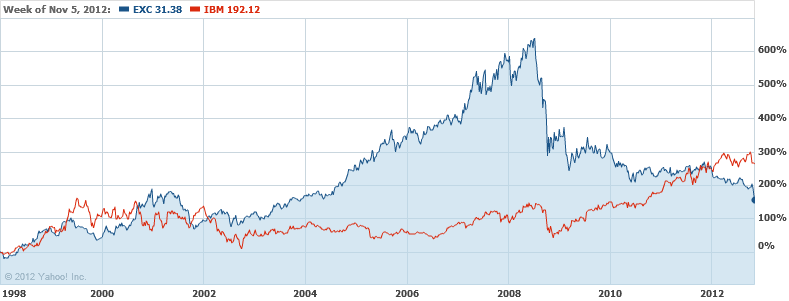
Keep in mind that we’re talking about a utility company with a price peak that, since January 1998, exceeded that of Dow Jones Industrial Average heavyweight IBM.

image

Although the prospects for Exelon could turn around, we’re concerned that there is more downside risk.  We’d patiently watch what the fallout will be.  At the very least, we’d like to see how close EXC comes into alignment with the Dow Jones Utility Average since 1998.

Insurance Watch List: November 6, 2012

The following is one of our personal favorite watch lists. We started tracking the insurance industry in January 2011 and we’re very impressed with the results so far.

Anyone who wishes to be successful in insurance stocks should read the book The Davis Dynasty by John Rothchild. The book starts with Shelby Collum Davis investing approximately $50,000 to $100,000 that ultimately grew to $900 million after 47 years. The strategies employed by Davis seem more accessible to average investors as opposed to Warren Buffett’s leveraged strategies and education from Benjamin Graham.

Symbol Name Price P/E EPS Yield P/B payout ratio % from low
TWGP Tower Group Inc. 17.68 44.4 0.4 4.2 0.66 187.50% 2.43%
PKIN Pekin Life Insurance Company 10.8 59.67 0.18 1.1 1.56 66.67% 4.85%
ASI American Safety Insurance Holdings Ltd. 17.22 33.17 0.52 - 0.52 n/a 4.85%
FRFHF Fairfax Financial Holdings Limited 372.45 - -34.42 - 1.02 n/a 5.13%
NSEC National Security Group Inc. 8.15 - -3.16 1.2 0.65 -3.16% 6.54%
GTS Triple-S Management Corporation 17.72 9.17 1.93 - 0.68 n/a 6.55%
THG The Hanover Insurance Group Inc. 35.61 10.12 3.52 3.4 0.58 34.09% 6.75%
OB OneBeacon Insurance Group, Ltd. 13.01 51.14 0.26 6.5 1.19 323.08% 6.89%
CRVL CorVel Corporation 42.74 20.64 2.06 - 3.99 n/a 8.03%
MHLD Maiden Holdings, Ltd. 8.54 9.02 0.94 3.9 0.74 34.04% 8.30%
ERIE Erie Indemnity Company 66.3 22.84 2.9 3.3 4.53 76.21% 8.35%
MIG Meadowbrook Insurance Group Inc. 5.72 - -0.33 3.4 0.52 -60.61% 8.40%
TDHOY T&D Holdings, Inc. 5.31 21.99 0.24 - 0.86 n/a 8.59%
WSH Willis Group Holdings Public Limited Company 34.87 16.12 2.17 3.2 2.22 49.77% 9.26%
  • Avoid insurance stocks with payout ratios that are in the negative or exceeding 100%
  • Insurance stocks with low average volume have low liquidity and considered high risk

Watch List Summary

Of interest to us on the Insurance Watch List is The Hanover Group (THG).  In the past year, THG has traded as high as $41.52 and as low as $33.42.  Currently,  THG is trading at a price of $35.66, within 7% of the low.

According to Value Line Investment Survey dated September 14, 2012 (www.valueline.com), The Hanover Group is fairly valued at 12x earnings which, if based on normalized 2010 earnings, would be $39.72.  However, Value Line projects 2013 earnings to be $4.40 which translates into a $52 stock price.  Since 1997, THG has managed to trade at, and above, the 12x earnings level whenever the stock has declined significantly below such a level. 

In 2011, Value Line indicates that The Hanover Group had earnings of $0.70.  This is a considerable drop-off from the 2010 and projected 2012 levels.  The last time that THG experienced such a dearth of earnings was in 2002 when the stock price declined from a 2000 high of $74.30 to a 2002 low of $7.  Already, in the trailing twelve months THG has earned $3.52.  This suggest that Value Line’s assessment for 2012 and 2013 is on track so far.

Our worst case scenario for a downside target for The Hanover Group is based on the 2009 low of $28.  Surprisingly, in the period from 2006 to 2009, THG did not decline as much as most insurance stocks in the same period of time.  According to Dow Theory, THG has the following downside targets:

  • $35.00
  • $32.67
  • $30.34
  • $28.00

The next stock that we’re interested in is Burmuda-based Maiden Holdings Inc. (MHLD).  Like The Hanover Group, MHLD has a low payout ratio of 34% which suggests that the company has a manageable dividend that can weather future earnings volatility.

In looking at the background of Maiden Holdings, it reminds us of the relationship that Transatlantic Holdings (TRH) had with AIG (AIG).  To be specific, MHLD received a significant amount of its business from another insurer, in this case AmTrust Financial Services (AFSI).  According to MHLD’s 2011 annual report,

“AmTrust is Maiden’s largest client relationship and we will continue to derive a substantial portion of our business from AmTrust in the near term. We commenced our reinsurance business by providing traditional quota share reinsurance to AmTrust through the Master Agreement with AmTrust’s Bermuda reinsurance subsidiary AII, assuming initially a 40% quota share portion of the net liabilities less recoveries of the policies written by AmTrust.”

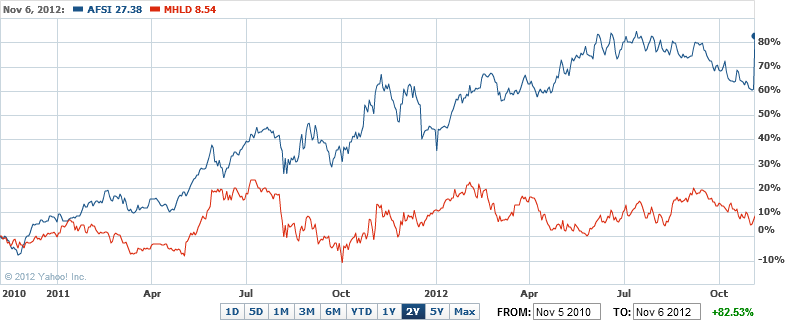
In the last two years, AmTrust Financial Services has been sitting pretty as it has reached a new 52-week high by closing up +14.18% today alone (11/6/2012) while Maiden Holdings has severely underperformed.

image

  However, a side-by-side comparison between the two stocks suggests that MHLD is clearly undervalued, overall.

Valuation Measures AFSI MHLD
Market Cap (intraday): 1.84B 617.83M
Enterprise Value (Nov 7, 2012): 1.92B 883.30M
Trailing P/E (ttm, intraday): 12.15 9.1
Forward P/E (fye Dec 31, 2013): 9.94 7.13
PEG Ratio (5 yr expected): 0.75 1.6
Price/Sales (ttm): 1.03 0.34
Price/Book (mrq): 1.61 0.74
Enterprise Value/Revenue (ttm): 1.23 0.49
Enterprise Value/EBITDA (ttm): 9.05 7.9
     
Financial Highlights AFSI MHLD
Fiscal Year    
Fiscal Year Ends: 31-Dec 30-Dec
Most Recent Quarter (mrq): 30-Jun-12 30-Jun-12
     
Profitability AFSI MHLD
Profit Margin (ttm): 9.87% 3.80%
Operating Margin (ttm): 11.29% 5.84%
     
Management Effectiveness AFSI MHLD
Return on Assets (ttm): 1.94% 1.87%
Return on Equity (ttm): 16.52% 8.65%
     
Income Statement AFSI MHLD
Revenue (ttm): 1.57B 1.80B
Revenue Per Share (ttm): 23.69 24.92
Qtrly Revenue Growth (yoy): 25.50% 16.90%
Gross Profit (ttm): 281.02M 158.57M
EBITDA (ttm): 212.43M 111.81M
Net Income Avl to Common (ttm): 154.29M 68.47M
Diluted EPS (ttm): 2.27 0.94
Qtrly Earnings Growth (yoy): -19.50% N/A
     
Balance Sheet AFSI MHLD
Total Cash (mrq): 390.89M 58.93M
Total Cash Per Share (mrq): 5.85 0.82
Total Debt (mrq): 702.41M 333.79M
Total Debt/Equity (mrq): 65.49 40.47
Current Ratio (mrq): 1.4 0.74
Book Value Per Share (mrq): 14.97 11.41
     
Cash Flow Statement AFSI MHLD
Operating Cash Flow (ttm): 352.27M 304.06M
Levered Free Cash Flow (ttm): 328.54M 64.04M
source: Yahoo!Finance, Captial IQ    

The only problem with the numbers for MHLD is that when and if AMSI falters, as it should, we expect that MHLD will experience a decline in sales and earnings as well.  With this in mind, we’ve run the following downside targets for MHLD, based on Dow Theory:

  • $7.42
  • $5.08
  • $2.75

We’d consider buying MHLD at $7.42 and below.

Investment Strategy: Let Profits Run?

Subscriber M.C. asks:

“I have a couple questions - I know you often let your profit "run" after selling your principal investment in a stock. We're almost certainly investing in different sums, so this is likely a difficult question to answer, but is it worth me hanging to shares if my profit portion is small (maybe only a few K) and only allows me to hang to a handful of shares? Do you always retain your profit portion regardless of %?”

Our Response:

We’re incredibly risk-averse even though we put so much into a single stock and incur transaction fees to buy and sell after a stock has attained a 10% gain (ideally within a year).

The good news is, the amount of the money being invested has little to do with our strategy.  Our approach is calibrated to work with large and small pools of funds since it is based on the percentage of the portfolio and not the dollar amount.  As long as the amount that you’re initially investing is a sizable portion of your overall portfolio (5% and above) for each stock that you buy, then you’re in a good position to see the value of our approach.

Regarding holding on to the profit portion of a couple thousand dollars, more specifically, equaling ½% to 1% of the portfolio, we always recommend taking advantage of the low prices that a stock is acquired. As time has passed we have realized that the best way to do this is to keep the profit portion which allows for compounding by reinvesting the dividend and any capital appreciation that usually occurs after the principal portion is sold.  The added benefit of this strategy is the ability to methodically build a diversified portfolio over time.

There are a couple of nice attributes to this approach that is worth re-iterating.  First, we always participate in any addition increase in the price.  Second, we get to compound our way to long-term wealth.  Finally, the stock that we’ve sold the principal portion on would have to fall to zero in order for us to experience a loss.  This allows us to comfortably wait out the long-term rather than wring our hands about short-term gyrations and possible risk of loss to principal.

The question of whether “…we always retain the profit portion regardless of %…” is not always the case.  The short answer is no, we don’t always retain the profit portion.  With stocks from our dividend list we tend to retain the profit portion while stocks from our Nasdaq 100  list and speculations in gold and silver are usually sold entirely.

Here is a breakdown of the most recent non-speculative transactions that we’ve entered into and actions that we’ve taken once sold (links to articles within stock symbols, if available):

symbol price bought price sold gain/loss % retained current price % change since sold
CRR 64.94 74.18 14.23% 8.16% 77.99 5.14%
WAG 32.94 36.14 9.71% 9.00% 33.95 -6.06%
XEC 54.97 64.15 16.70% 16.00% 63.8 -0.55%
RGA 59.39 62.87 5.86% 6.66% 53.67 -14.63%
RGA 48.42 59.63 23.15% 20.00% 53.67 -9.99%
SYY 27.96 32.14 14.95% 10.00% 30.87 -3.95%
SYY 26.61 29.33 10.22% 9.43% 30.87 5.25%
BOH 38.24 47.15 23.30% 18.91% 44.76 -5.07%
AMAT 11.11 13.8 24.21% 19.21% 11.44 -17.10%
TR 24.05 22.97 -4.49% 3.00% 27.04 17.72%
UNM 18.68 20.63 10.44% 9.33% 21.03 1.94%

Of the stocks listed in our NLO Portfolio, 29.24% is due to acquisitions of INTC, EXPD and MKL that have not yet gained 10% or more.  The Alleghany (Y) position, at 9.52% of the portfolio, is the result of our initial position in Transatlantic Holdings (TRH) being acquired as outlined in our posting dated March 9, 2012.  The remaining shares that we have in the companies listed, comprising 11% of the portfolio, are all strictly the profit portion of our prior investments.  As we’ve said earlier, these stock continue to compound at no additional cost, enjoy the benefit of any additional capital appreciation and would literally have to go to zero before any loss is incurred.

Whenever possible, we hope to eliminate the element of risk when investing in the stock market.  So far, 11% of our portfolio is on that path.  We hope this basic outline demonstrates what we’re trying to accomplish from both a short and long-term perspective.  Thanks for the great question.

Nasdaq 100 Watch List: November 2, 2012

Below are the Nasdaq 100 companies that are within 10% of their respective 52-week lows. Stocks that appear on our watch lists are not recommendations to buy. Instead, they are the starting point for doing your research and determining the best company to buy. Ideally, a stock that is purchased from this list is done after a considerable decline in the price and rigorous due diligence.

Symbol Name Price P/E EPS Yield P/B % from low
WCRX Warner Chilcott plc 11.47 10.07 1.14 0 13.28 0.35%
DELL Dell Inc. 9.15 5.45 1.68 3.5 1.66 0.44%
BBBY Bed Bath & Beyond Inc. 57.1 13.27 4.3 - 3.31 0.67%
FFIV F5 Networks, Inc. 82.59 23.94 3.45 - 5.1 1.87%
ALTR Altera Corp. 30.51 17.05 1.79 1.3 3.1 3.11%
APOL Apollo Group Inc. 19.78 5.69 3.48 - 2.43 3.13%
NTAP NetApp, Inc. 27.74 19.58 1.42 - 2.33 3.39%
INTC Intel Corporation 22.06 9.62 2.29 4.1 2.26 3.96%
ATVI Activision Blizzard, Inc. 11.16 15.9 0.7 1.6 1.18 4.00%
VOD Vodafone Group Public Limited Company 26.91 12.29 2.19 7.4 1.1 4.99%
FLEX Flextronics International Ltd. 5.74 7.81 0.74 - 1.61 5.32%
BIDU Baidu, Inc. 105.09 23.78 4.42 - 10.09 5.40%
MCHP Microchip Technology Inc. 32.14 20.75 1.55 4.4 3.12 6.32%
NVDA NVIDIA Corporation 12.49 16.46 0.76 - 1.75 7.39%
EXPD Expeditors International of Washington Inc. 36.91 21.97 1.68 1.5 3.83 7.92%
AMAT Applied Materials Inc. 10.81 12.98 0.83 3.3 1.62 8.43%
SPLS Staples, Inc. 11.47 8.64 1.33 3.8 1.18 8.51%
GRMN Garmin Ltd. 37.5 12.67 2.96 4.8 2.19 8.98%
MRVL Marvell Technology Group Ltd. 7.98 10.22 0.78 3 0.94 9.02%
DLTR Dollar Tree, Inc. 39.59 17.63 2.24 - 6.11 9.85%
MNST Monster Beverage Corporation 44.03 24.6 1.79 - 6.68 9.91%

Watch List Summary

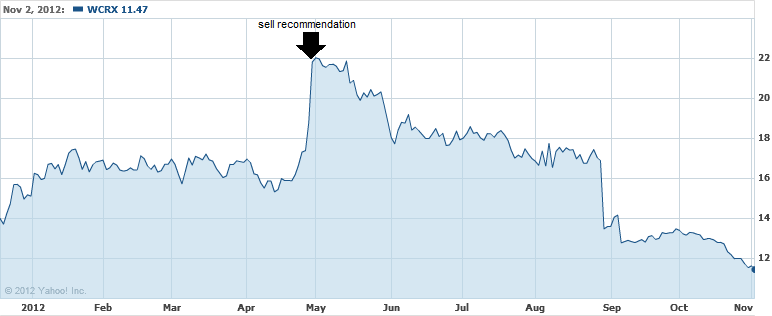
The top stock on our list is Warner Chilcott (WCRX).  On April 30, 2012, we recommended that investors sell WCRX after a +50% increase in the stock price from our December 16, 2011 watch list.  Since our recommendation to sell WCRX, the stock has declined -47.41%.

image

We believe that WCRX will declined to the $10 level before it is worth reconsidering the value attributes of this company.

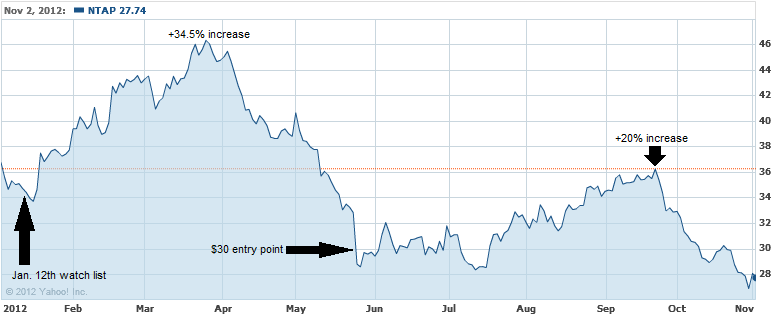
On January 12, 2012, we assessed the points at which an investor could take advantage of the decline of NetApp (NTAP).  At the time, NTAP was trading at $36.85 and we suggested that the stock would be a good buy at $30 and $23.47.  Afterwards, NTAP increased +34.5% to the March high and the fell below the Jan. 12th price.  After falling slightly below the $30 level, NTAP rose +20% to the September high.  Anyone who has not participated in the $30 purchase price can do so at the current price and potentially at the $23.47 level.

image

Nasdaq 100 and Apple Inc.

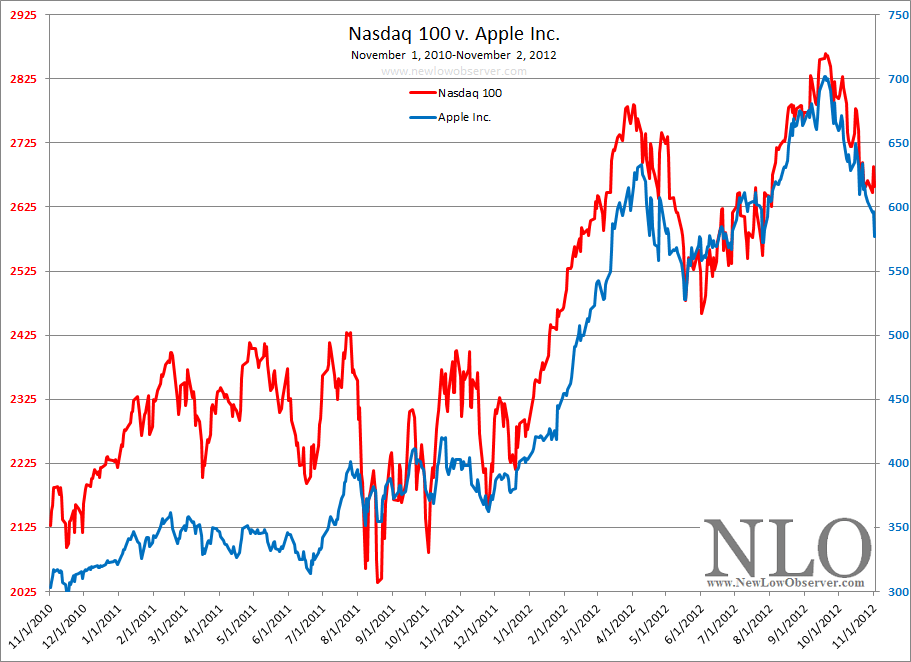
The most important aspect of the movement of the Nasdaq 100 (NDX) is the impact that Apple Inc. (AAPL) has on the index.  Below you can see a comparison between the index and the stock.

image

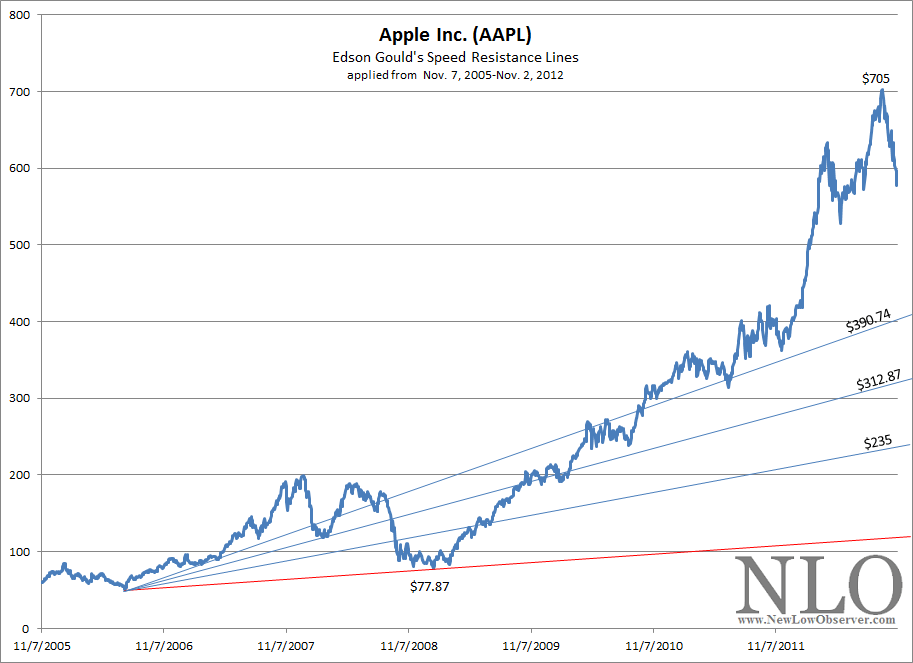
The high level of correlation that exists between the Nasdaq 100 and Apple, since mid-2011, suggests that the tail is wagging the dog and should result in the index declining further if any negative news comes from Apple.  Strictly from a technical standpoint, it would not be unusual for AAPL to retest the May 2012 lows before recovering in price.  In addition, we believe that Apple Inc. could retest the conservative downside target of $312.87 based on the revised Speed Resistance Line below:

image

In order to understand where the Nasdaq 100 might go, consideration of Apple Inc. (AAPL) is required.

Watch List Performance Review

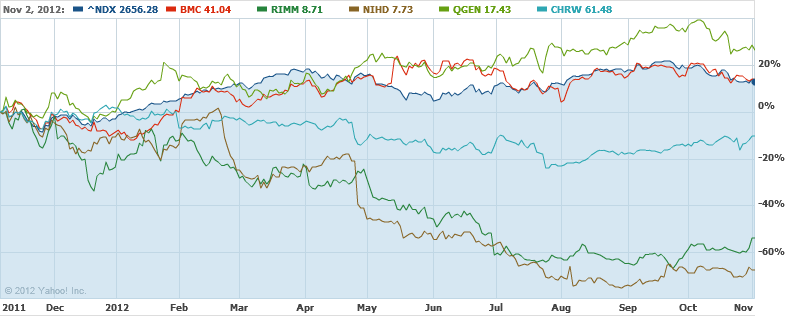
In our ongoing review of the Nasdaq 100 Watch List, we have taken the stocks from our list of November 4, 2011 (found here) and have checked their performance one year later. The top five companies on that list are provided in the chart below from November 4, 2011 to November 2, 2012.

image

Transaction Alert: Sold CRR at the Market

Today we sold the principal portion in shares of Carbo Ceramics (CRR).

  • On August 6, 2012, we posted a transaction alert indicating that we bought Carbo Ceramics (CRR) at the market (found here). The gain has been +17%. The annualized rate of return is nearly 92%.

We continue to hold shares of the company (profit portion) allowing us to slowly build a well diversified portfolio and continue to see capital appreciation and compounding of the income.

Canadian Dividend Watch List: October 26, 2012

This is a list of Canadian dividend stocks that currently, or in the past, had a history of consecutive annual dividend increases. For those wishing to find the most complete fundamental information on these companies, we recommend visiting one of Canada’s leading financial websites, the Financial Post (found here). However, Yahoo!Finance probably has the better long-term charts and historical dividend data.

Symbol Name Price P/E EPS Yield P/B % from low
FFH.TO FAIRFAX FINANCIAL HOLDINGS LTD. 361.98 0 0 2.80% 0 1.55%
AGF-B.TO AGF Management Limited 10.14 15.84 0.73 10.70% 0.84 2.11%
IGM.TO IGM Financial Inc. 38.73 11.74 3.3 5.60% 2.27 5.22%
TIH.TO Toromont Industries Ltd. 19.49 13.82 1.39 2.50% 3.52 5.98%
CCA.TO Cogeco Cable Inc. 36.69 7.19 5.06 2.70% 1.53 6.50%
FTS.TO Fortis Inc. 33.4 18.98 1.73 3.60% 1.61 6.64%
EMP-A.TO Empire Company Limited 57.4 10.87 5.28 1.70% 1.11 7.39%
TRI.TO Thomson Reuters Corporation 28.29 0 -1.17 4.50% 1.39 8.39%
PWF.TO Power Financial Corporation 25.65 10.51 2.43 5.50% 1.53 8.59%
CCO.TO Cameco Corp. 18.89 16.87 1.12 2.10% 1.49 9.51%
GS.TO Gluskin Sheff + Associates, Inc. 14.45 24.08 0.6 4.50% 5.52 9.72%

Watch List Summary

The financials do not favor Fairfax Financial Holdings, the top stock on our watch list.  The fundamental situation indicates that there are no earnings which makes the dividend that much more precarious.  On the technical side, a decline below CAN$360 could mean that the next downside target is CAN$330-CAN$277.  In the best case scenario, the upside opportunity for FFH.TO is 22% to the high of CAN$442.  Anyone wishing to venture into this stock should accept the high level of risk for a company run by a person considered to be the “Warren Buffett of Canada.”

From a technical standpoint, AGF Management seems to be on course to retest the 2009 low of CAN$6.74, a decline of –33%.  Already AGF has declined over –50% from the high set in late May of 2011.  Although we suspect that AGF Management will decline to the prior low, funds dedicated to this stock should be done in three stages.  Once at the current level after appropriate due diligence, and again at the 2009 low.  The third portion should be allotted for any additional decline below the 2009 low.

U.S. Dividend Watch List: October 26, 2012

Below are the 48 companies on our U.S. Dividend Watch List that are within 11% of their respective 52-week lows. Stocks that appear on our watch lists are not recommendations to buy. Instead, they are the starting point for doing your research and determining the best company to buy. Ideally, a stock that is purchased from this list is done after a considerable decline in the price and rigorous due diligence.

Symbol Name Price % Yr Low P/E EPS (ttm) Dividend Yield Payout Ratio
MCD McDonald's Corp.  86.71 0.92% 16.33 5.31 3.08 3.55% 58%
JW-A John Wiley & Sons Inc. 43.20 1.74% 13.29 3.25 0.80 1.85% 25%
APD Air Products & Chemicals 77.92 2.38% 14.32 5.44 2.56 3.29% 47%
ERIE Erie Indemnity Company  62.59 2.39% 22.27 2.81 2.21 3.53% 79%
MATW Matthews International Corp.  28.67 2.83% 12.91 2.22 0.36 1.26% 16%
CLC Clarcor Inc. 44.75 3.06% 18.42 2.43 0.54 1.21% 22%
INTC Intel Corp.  21.95 3.44% 9.59 2.29 0.90 4.10% 39%
ETP Energy Transfer Partners 42.95 4.68% 9.12 4.71 3.58 8.34% 76%
WGL WGL Holdings, Inc. 39.50 4.91% 20.05 1.97 1.60 4.05% 81%
OMI Owens & Minor, Inc. 28.76 5.08% 15.63 1.84 0.88 3.06% 48%
DBD Diebold, Inc. 29.51 5.17% 11.18 2.64 1.14 3.86% 43%
UBSI United Bankshares, Inc.  23.65 5.58% 14.42 1.64 1.24 5.24% 76%
DCI Donaldson Co. Inc. 32.21 5.69% 18.62 1.73 0.36 1.12% 21%
ABM ABM Industries, Inc. 18.87 5.71% 19.45 0.97 0.58 3.07% 60%
FDS FactSet Research Systems 90.85 6.41% 22.05 4.12 1.24 1.36% 30%
SJW SJW Corp. 24.05 6.51% 19.71 1.22 0.71 2.95% 58%
EXPD Expeditors International 36.43 6.52% 21.68 1.68 0.56 1.54% 33%
AMAT Applied Materials Inc. 10.65 6.82% 12.83 0.83 0.36 3.38% 43%
ED Consolidated Edison, Inc.  59.97 6.96% 16.57 3.62 2.42 4.04% 67%
SRCE 1st Source Corp.  21.97 7.12% 11.50 1.91 0.68 3.10% 36%
TNC Tennant Co. 37.35 7.36% 18.31 2.04 0.68 1.82% 33%
GRC Gorman-Rupp Company 26.43 7.40% 18.10 1.46 0.40 1.51% 27%
CWT California Water Service 18.43 7.53% 20.94 0.88 0.63 3.42% 72%
HRL Hormel Foods Corp. 29.34 7.55% 16.30 1.80 0.60 2.04% 33%
BDX Becton, Dickinson and Co. 75.34 7.55% 13.65 5.52 1.80 2.39% 33%
CAT Caterpillar Inc. 84.25 7.67% 8.63 9.76 2.08 2.47% 21%
SFNC Simmons First National Corp.  24.30 7.76% 15.78 1.54 0.80 3.29% 52%
ADM Archer Daniels Midland Co. 27.05 8.11% 14.70 1.84 0.70 2.59% 38%
VVC Vectren Corp. 29.28 8.40% 15.09 1.94 1.40 4.78% 72%
NJR New Jersey Resources Corp. 44.60 8.49% 19.73 2.26 1.60 3.59% 71%
SON Sonoco Products Co. 31.06 8.56% 17.45 1.78 1.20 3.86% 67%
RAVN Raven Industries, Inc.  27.27 8.69% 18.68 1.46 0.42 1.54% 29%
WABC Westamerica BanCorp.  44.47 8.73% 14.82 3.00 1.48 3.33% 49%
CBSH Commerce Bancshares, Inc.  38.10 8.73% 12.83 2.97 0.92 2.41% 31%
NWN Northwest Natural Gas Co. 47.78 8.84% 20.42 2.34 1.82 3.81% 78%
IBM International Business Machines 193.27 9.16% 13.89 13.91 3.40 1.76% 24%
PNY Piedmont Natural Gas Co. 31.57 9.24% 20.24 1.56 1.20 3.80% 77%
MDU MDU Resources Group 21.48 9.31% 19.01 1.13 0.67 3.12% 59%
SBSI Southside Bancshares  20.45 9.50% 9.83 2.08 0.80 3.91% 38%
CAH Cardinal Health, Inc.  40.43 9.54% 13.21 3.06 0.95 2.35% 31%
SJI South Jersey Industries, Inc. 50.98 9.59% 16.03 3.18 1.61 3.16% 51%
ANAT American National Insurance 73.02 9.67% 10.80 6.76 3.08 4.22% 46%
EMR Emerson Electric Co. 47.84 9.75% 14.50 3.30 1.60 3.34% 48%
WEYS Weyco Group, Inc.  23.89 10.09% 16.36 1.46 0.68 2.85% 47%
PH Parker Hannifin Corp. 77.58 10.17% 10.91 7.11 1.64 2.11% 23%
JCI Johnson Controls Inc  25.81 10.44% 10.28 2.51 0.72 2.79% 29%
CASY Caseys General Stores, Inc. 51.91 10.52% 17.19 3.02 0.66 1.27% 22%
PPL PP&L Corporation 29.49 10.53% 10.03 2.94 1.44 4.88% 49%
48 Companies

Watch List Review

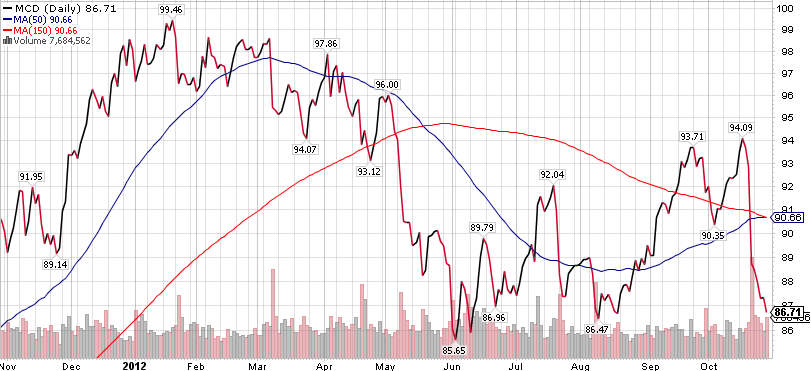
Topping out list this week is a another Dow component, McDonald (MCD).  The stock retraced from the $94 level in mid-October and is now trading very close to the $85 level.  One could put on a trade at the current price with a tight stop at $85.  An interesting technical pattern appears with the 50-day moving average looking to cross the 150-day moving average to the upside (see chart below).  Fundamentally, dividend yield of 3.55% is close to the undervalued range of 3.6% (IQTrends at www.iqtrends.com).  Although this sound very attractive, our valuation model suggests a possible downside of $60, if the market cave.  Look for the company to trade down as far as 10x earning and 7x cash flow.

(updated 10/31: the company raised its divided by 10% on 9/20/2012)

image

John Wiley & Son (JW-A) is trading practically at the low.  A conservative payout ratio of 25% implies that the dividend can be sustained even if earnings drop by half.  We all know that the publishing business is a difficult one to be in and would suggest an alternative sector for the time being.

Air Products & Chemicals (APD) was under pressured after the company reported earnings that missed consensus estimates by couple of cents.  Consolidated income plunged -57% to $138.7 million from $324.8 million.  While revenue rose slightly, the company posted a "one-time" impairment charge of $240 million ($127 million of that is associated with the photovoltaic market which is extremely weak).  A dividend yield of 3.3% is where the company is considered undervalued by IQTrends (www.iqtrends.com).  We don’t have a valuation model for this company but will begin to building one soon as the risk/reward profile appears to be very attractive.

Dow Theory on Fair Value

The purpose of this article is to demonstrate how Dow Theory approaches the question of the fair value of a stock. Most investors often hear of an analyst giving a fair value for a stock. Seldom is there ever a full description of the meaning of fair value or how exactly fair value is arrived at. Even when there is a description of how fair value is arrived at most investors have a hard time understanding what exactly it means if a stock they own goes from undervalued or overvalued to fair value.

Another name for fair value is intrinsic value. One source that we would derive our definition of intrinsic value is in Security Analysis by Graham and Dodd. According to a 1962 edition of Security Analysis:

“A general definition of intrinsic value would be ‘that value which is justified by the facts, e.g., assets, earnings, dividends, definite prospects, including the factor of management.’ The primary objective in using the adjective ‘intrinsic’ is to emphasize the distinction between value and current market price, but not to invest this ‘value’ with an aura of permanence. In truth, the computed intrinsic size is likely to change at least from year to year, as the various factors governing that value are modified. But in most cases intrinsic value changes less rapidly and drastically than market price and the investor usually has an opportunity to profit from any wide discrepancy between the current price and the intrinsic value as determined at the same time.

“The most important single factor determining a stock’s value is now held to be the indicated average future earning power, i.e., the estimated average earnings for a future span of years. Intrinsic value would then be found by first forecasting this earning power and then multiplying that prediction by an appropriate ‘capitalization factor.’”

Graham and Dodd. Security Analysis. McGraw-Hill. New York. 1962. Page 28.

The challenge with the definition of intrinsic value is the “facts” as described by Graham and Dodd. First, the valuing of assets could be done above or below their true worth. Second, earnings could be managed or manipulated in a fashion that is inconsistent with the company’s true health. Third, a company’s prospects are subject to vagaries in the market and therefore are not definite. Fourth, depending on the compensation method used for the company’s management, those in charge may act in a fashion that is counter to the continued growth of the company. The only certainty is the payment of dividends that have already taken place. In my experience observing stocks, I have seen the change in management, earnings, prospects and assets but never the change in ex postdividend payments.

Even within the definition of intrinsic value, Graham and Dodd submit to the fact that we cannot expect current conditions to exist into perpetuity. Additionally, the idea of forecasting into the future, “over a span of years,” a company’s earning potential seems to be more hopeful than anything else. The fair value of the company can decline with little more reason than a significant decline in stock price.

The spurious nature of intrinsic value can be demonstrated in what is known as an impairment charge. Recently there have been two Dividend Achievers that have had impairment charges which have significantly reduced the fair value of the company. In one instance, Supervalu (SVU) noted in their Form 10-Qfiling that the “retail food operating loss for the third-quarter and year-to-date ended November 29, 2008 reflects the preliminary estimate of goodwill and asset impairment charges of $3,250,000 related to the write-down of goodwill and other intangible assets required by Statement of Financial Accounting Standards (SFAS) number 142.” What this means is that because the stock price fell so much in such a short period of time, the company was forced to adjust their fair value lower due to SFAS rule number 142.

In another example, Nacco Industries (NC) stated in their 4th quarter earnings callthat, “during the quarter, the company wrote off the goodwill on its books. Because the company stock price at year end was significantly below the company’s books by tangible assets and its book value of equity, accounting rules effectively required the company taking non-cash write-off of goodwill and certain other intangible assets totaling $436 million or 431.6 million net of taxes of $4.1 million the company recorded those pretax charges as follows…” Again, this is an example of accounting rules (SFAS rule No. 142) determining the change in the value of the stock’s fair value.

Although these were “legitimate” changes to the fair value of the companies, one cannot overlook the fact that much of the fair value can be based on interpretation. Also, the timing of the changes can occur at times that are not consistent with the decline in earnings or future prospects. In the two prior examples these declines in fair value were based on the declines in stock price due to the market panic from 2007 to 2009.

Most fundamental analysis of stocks has been done based on the Graham and Dodd method which was codified in 1934 after the stock market crash from 1929 to 1933. Before 1929, there were other methods for determining a company’s fair value. One method that I have studied extensively is the Dow Theory method. Most followers of Dow Theory might not realize it but the “50% Principle,” as coined by E. George Schaefer but elaborated in great detail by Charles H. Dow, is the method for arriving at a stock’s “fair value.”

From a Dow Theory perspective, a company’s fair value is as simple to determine as the prior period of increase or decline in the stock price. However, understanding the nuances will allow for better interpretation of the meaning of fair value according to Dow Theory.

image

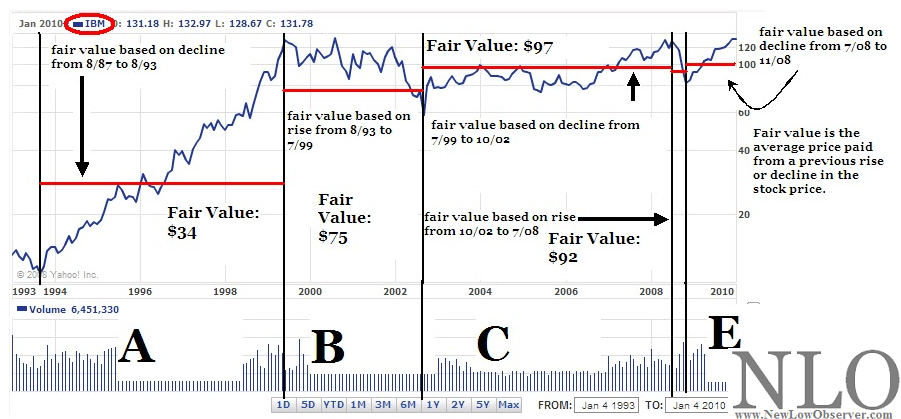
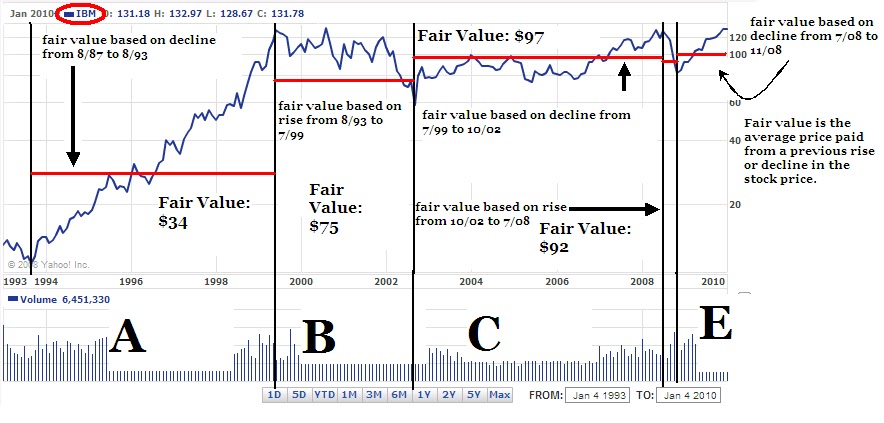
According to Dow Theory, fair value is arrived at based on one half the previous increase in the stock’s price or one half the previous decrease in the stock price. In the example above, I have selected IBM to show how fair value works according to Dow Theory.

In section A, I have indicated that the rise in 1993 to the peak in 1999 had an established fair value based on the prior decline from 1987 to 1993 (red line.) The prior declining period set fair value for IBM at $34. When IBM went from $10 up to $34 the company’s stock was considered at fair value. Any further increase in price was considered overvalued. Theoretically, any investor who bought the stock below $34 should accept that any further increase in price is icing on the cake.

Because the stock rose from $10 to $140 in the period from 1993 to 1999, a new fair value was established at $75. Section B carried the fair valuation of $75 indicating that anyone who bought the stock below $75 was getting a bargain.

In section C, I have indicated that the decline from 1999 to the trough in 2002 established a new fair value for the following increase at $97. In section C, from the 2002 low to the 2008 high, the fair value became $92. In section D, after the decline from July 2008 to November 2008 the new fair value became $100 in section E.

Each time a stock completes a major decline or increase, a new fair valuation can be established. For the cautious investor, the fair value for the next increase is derived from the previous decline and the increase that preceded the previous decline. This establishes a range that an investor would determine where a stock is fairly valued. A real-time fair value can be determined based on the most recent price trend however, an investor has to accept that, without a turn in the price (confirmation), the position is at significant risk. Belowis an attempt to demonstrate how the process works.

In July 2008, an analyst issued a strong buy report on Lowe’s (LOW) when the stock was trading at $18.90. At the time, the analyst indicated Lowe’s had a fair valuation of $32.27 using an assortment of Graham and Dodd methods. However, if using the Dow Theory method for determining fair valuation, an investor would have arrived at a fair value of $26.92.

Old high of $34.93 set on 2/20/07

[($34.93-$18.90)/2]+$18.90=$26.92

Subsequent to the report that was issued at $18.90, LOW closed at $27.36 on September 8, 2008 and then traded down from that point until it rested at the $13 level in March of 2009. Using the Dow Theory method for fair valuation, an investor would have sold the stock on the approach to $26.92 and then waited to see what would have developed from there. My personal modification to this method is to move on to a different stock altogether.

Unfortunately, a person who followed the analyst recommendation of expecting the stock to go to $32.27, or fair valuation, would have held on regardless of the stock never getting to $32 and instead declining back to $18.90 and below.

Now with LOW at $13, the new fair value, according to Dow Theory, based on the old high of $34.93, is $23.97. Well, from the $13 level, LOW traded up to $24.17 and has since reversed to the downside at the current price of $23.13. Again, the investor following the Dow Theory method would have sold the stock as it approached the $23.97 level.

Anyone who had based their purchase of LOW on July 2008 using the analyst’s future fair value of $32 would have not seen the price come close to predicted fair value.

While not infallible, the Dow Theory method addresses the most primary elements seen by all investors, the price movement. Although background in Graham and Dodd never hurt anyone, fundamentals are, at times, a distraction from what the most uninitiated gambler can see without having to crack open a single investment report. Additionally, an equal number of investors and speculators are on either side of the fair value range. This gives incentive to either buy, hold or sell the stock based on crossing the fair value plane.

Some would ascribe the Dow Theory 50% principle to the use of Fibonacci counts however, R.N. Elliot’s popularization of the application of Fibonacci’s to stock prices didn’t catch on until long after the establishment of Dow Theory. The use of Dow’s Theory in determining fair value gives investors the opportunity to see exactly how much the market discounts everything. It is clear that buying and selling a stock in such a short period of time is considered diametrically opposed to the Graham and Dodd method. However, it would benefit all who wish to obtain a reasonable approximation of fair value to consider the Dow Theory approach.

  • Moves to the downside project fair values for the upside. Moves to the upside project fair value for the downside

*This is a repost of our  January 19, 2010 article (found here).

Akamai Is a Sell

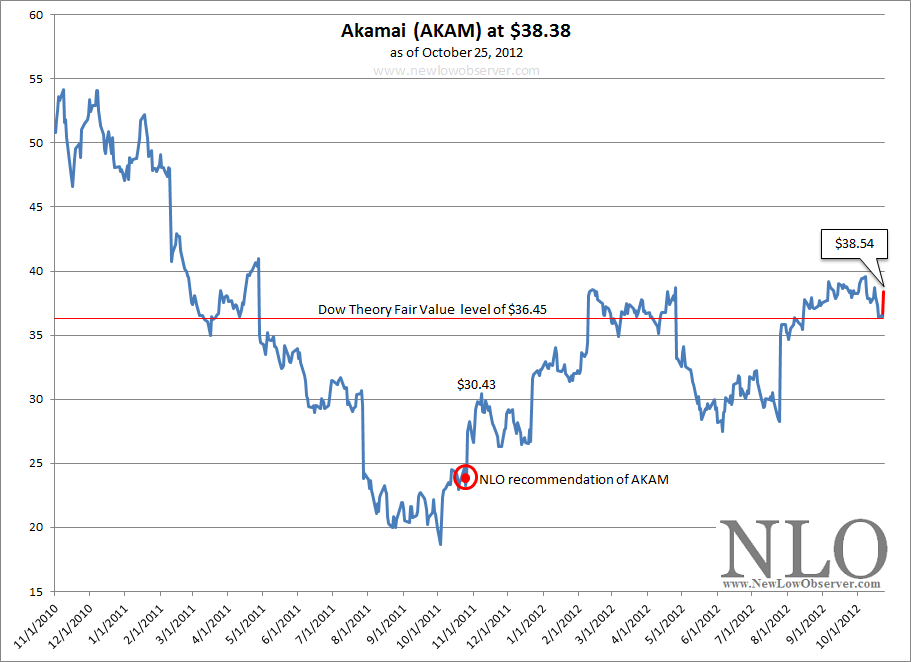
After the market closed yesterday, Akamai (AKAM) reported that “Third quarter revenue of $345 million, up 23 percent year over year, GAAP net income of $48 million, up 14 percent year over year; or $0.27 per diluted share, up 17 percent year over year, Normalized net income* of $79 million, up 24 percent year over year; or $0.43 per diluted share, up 26 percent year over year.”  The news seemed to caught the market flat-footed as the stock had been selling off from the October 8, 2012 high of $39.60 down to the closing price of $36.11 on October 24, 2012.

Last year, on October 21, 2011, we posted our recommendation of Akamai was among the best candidates for consideration from our Nasdaq 100 Watch List.  At the time, AKAM was trading at $23.85 and we said the following of the stock:

“…we believe it is worth considering Akamai from a Dow Theory perspective for any upside potential that might remain for the company. According to Dow Theory, so far the average price paid by investors, as opposed to speculators, is $36.45. This indicates the point at which an investor, over the last year, considers to be the “fair value”. This implies that the stock, at maximum could gain nearly 52% in due time. However, taking into account Charles H. Dow’s claim that in a bear markets, investors should only expect half of what would be considered “fair value” in a bull market, we think that in the next year Akamai could rise to the $30.15 level before faltering. We have acquired share of Akamai with the expectation that the stock will decline by at least 50%, at which point we will reconsider buying additional shares.”

Dow Theory seems to have honed in on all of the technical support and resistance levels for Akamai price.  Surprisingly, AKAM’s price rose from $23.85 to $30.43 before faltering in early November 2011.  This reaction was within 1% of our estimate where we thought that the stock would have experienced some resistance within a rising trend.

At the current time, according to Dow Theory, AKAM has upside targets of:

  • $42.31
  • $46.25
  • $50.19

And downside targets of:

  • $33.13
  • $25.92
  • $18.65

However, now that Akamai has resoundingly risen above the Dow Theory fair value level of $36.45, any additional rise of the stock is a gift.  Because our tax-deferred investing (and qualified accounts) strategy  employs Charles H. Dow’s approach of “seeking fair profits,” we are recommending that holders of Akamai consider selling the principal investment in the stock if purchased based on our October 2011 recommendation and pursue alternative investment opportunities in companies that are reasonably undervalued on a relative basis.

image

Those not interested in following through with our sell recommendation can feel comfortable knowing that Akamai is a reasonable holding with a +55% margin of safety since our initial review of the stock.