
- Japan
- Market Indicator
- Price Momentum Indicators
- Richard Russell
- Silver
- Speed Resistance Lines
- U.S. Dividend Watch List
Author Archives: nlo-admin
Nasdaq 100 Watch List: December 6, 2012
Below are the Nasdaq 100 companies that are within 10% of their respective 52-week lows. Stocks that appear on our watch lists are not recommendations to buy. Instead, they are the starting point for doing your research and determining the best company to buy. Ideally, a stock that is purchased from this list is done after a considerable decline in the price and rigorous due diligence.
| Symbol | Name | Price | P/E | EPS | Yield | P/B | payout ratio | % from low |
| WCRX | Warner Chilcott plc | 11.31 | 7.75 | 1.46 | 4.3 | -4.31 | 34% | 2.53% |
| BIDU | Baidu, Inc. | 88.47 | 20.08 | 4.42 | - | 8.33 | - | 3.23% |
| VOD | Vodafone | 25.87 | - | -0.55 | 4 | 1.13 | -185% | 3.69% |
| BBBY | Bed Bath & Beyond Inc. | 57.79 | 13.43 | 4.3 | - | 3.31 | - | 4.01% |
| MCHP | Microchip Tech | 30.22 | 28.72 | 1.05 | 4.7 | 2.96 | 134% | 4.36% |
| INTC | Intel Corporation | 20.1 | 8.78 | 2.29 | 4.5 | 2.01 | 39% | 4.68% |
| ALTR | Altera Corp. | 31.08 | 17.41 | 1.79 | 1.2 | 3.04 | 22% | 5.24% |
| MSFT | Microsoft Corporation | 26.63 | 14.45 | 1.85 | 3.5 | 3.26 | 50% | 5.72% |
| CTXS | Citrix Systems, Inc. | 60.13 | 32.85 | 1.83 | - | 3.69 | - | 6.31% |
| NVDA | NVIDIA Corporation | 11.95 | 14.92 | 0.8 | 2.5 | 1.58 | 38% | 7.17% |
| EXPD | Expeditors Int'l of WA | 36.78 | 22.97 | 1.6 | 1.5 | 3.76 | 35% | 7.46% |
| SPLS | Staples, Inc. | 11.37 | - | -0.01 | 3.9 | 1.23 | -4400% | 7.85% |
| FLEX | Flextronics Int'l | 5.9 | 8.04 | 0.73 | - | 1.61 | - | 7.86% |
| KLAC | KLA-Tencor Corp. | 46.53 | 11.34 | 4.11 | 3.4 | 2.3 | 39% | 7.87% |
| ATVI | Activision | 11.28 | 14.59 | 0.78 | 1.6 | 1.15 | 23% | 8.23% |
| AMAT | Applied Materials | 10.76 | 125.35 | 0.09 | 3.3 | 1.82 | 400% | 8.34% |
| DLTR | Dollar Tree, Inc. | 40.28 | 16.21 | 2.49 | - | 5.99 | - | 8.66% |
| APOL | Apollo Group Inc. | 20.18 | 5.8 | 3.48 | - | 2.47 | - | 9.86% |
| ^NDX | NASDAQ-100 | 2,649.12 | - | - | - | - | - | 23.16% |
Watch List Summary
We’ve highlighted the chip sector stocks to put emphasis on the fact that, as an industry group, the sector may be at or near a low. The last time we made this observation of the chip sector was on March 20, 2010 based on the closing price of March 19, 2010 (found here). The average return of the chips stocks on that watch list was +21.95% as compared to the Philadelphia Semiconductor Index (SOX) gain of +17.86% over the following year. After the first year had passed (March 18, 2011-present), the same semiconductors stocks have average a loss of –8.98% as compared to the SOX index decline of –10.67% (see chart below).
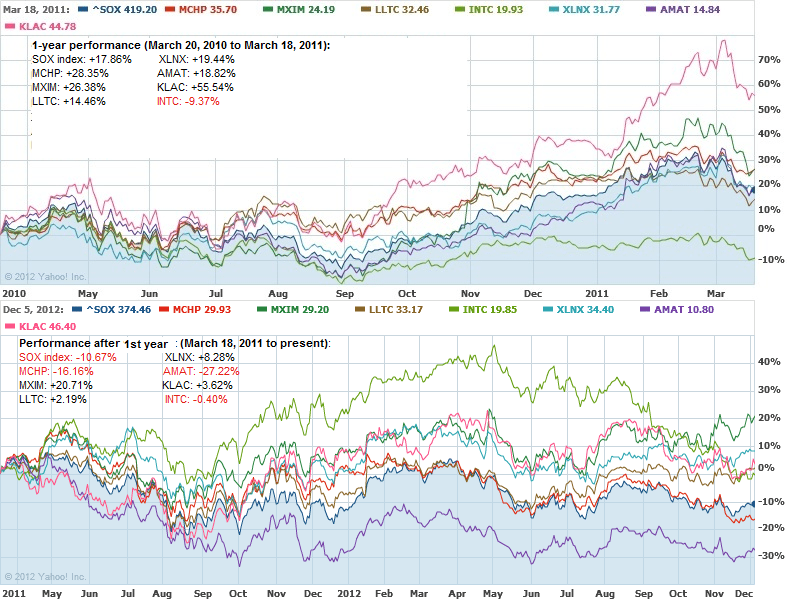
Within the first year (March 20,2010-March 18, 2011), all of the stocks on our list except Intel (INTC) managed to achieve gains of over +20% before falling lower. After the first year had passed (March 18, 2011-present), only MXIM and KLAC were able to achieve gains of +20% while INTC was the only stock to rise above +40%. Depending on the timing of the purchase, we wouldn’t be surprised to see the same performance of the chip related stocks on our current watch list.
Watch List Performance Review
In our ongoing review of the Nasdaq 100 Watch List, we have taken the top five stocks from our list of November 18, 2011 (found here) and have checked their performance one year later. The companies on that list are provided below with the closing prices from November 17, 2011 to November 16, 2012.
| Symbol | Name | 2011 | 2012 | % change |
| CTRP | Ctrip.com | 26.67 | 17.58 | -34.08% |
| BMC | BMC | 36.26 | 38.73 | 6.81% |
| NTAP | NetApp | 35.73 | 30.26 | -15.31% |
| QGEN | Qiagen | 13.71 | 17.16 | 25.16% |
| CHRW | Robinson Worldwide | 65.65 | 59.16 | -9.89% |
| Average | -5.46% | |||
| ^NDX | Nasdaq 100 | 2272.09 | 2534.16 | 11.53% |
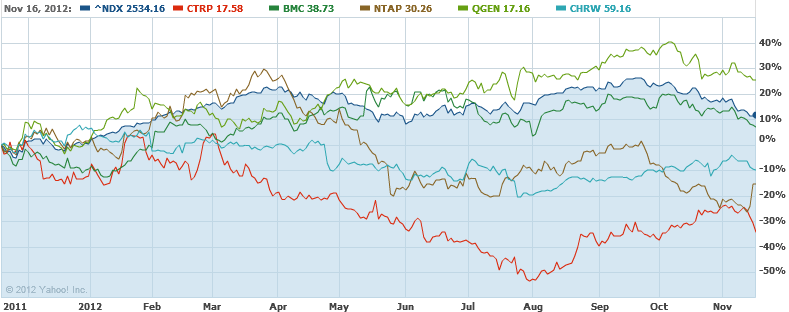
As can easily be seen by the table above, after one year the top five stocks severely underperformed the representative Nasdaq 100 index. However, three of the five stocks gained +10% or more within the first six months.
The disastrous performance of Ctrip.com (CTRP), declining over –50%, was highlighted well in advance in our December 16, 2011 posting (found here). At that time (CTRP at $23.10) we said the following:
“Ctrip.com International (CTRP) is on a pace to replicate the performance from the high in April 2008 to the low of January 2009 which equaled a loss of 72%. A similar decline in CTRP from the high of $50.57 would bring the price down to $14.16. Suffice to say, the stock “only” needs to decline another $8.94 or 38% from the current price of 23.10. This seems very easy considering the high volatility of Chinese stocks. We believe that unless CTRP is summarily dismissed from the Nasdaq 100 index, there may yet be life in this company.
We believe that the Nasdaq 100 committee added CTRP to the index based on the performance of Priceline.com (PCLN). Amazingly, at the current price of $23.10, CTRP sits one penny below the 2nd Dow Theory support level of $23.11. any further deviation below the current price almost ensures that the stock is destined for the $10 range.”
At its lowest point, Ctrip.com fell as low as $12.36 on July 30, 2012. We feel that our analysis, based on Dow Theory provided appropriate warning on the downside risk.
Another stock that severely underperformed in the last year was NetApp (NTAP). However, our initial analysis of the company on January 20, 2012 (found here) we said the following:
After a 39% decline in price, NetApp (NTAP) is a prime candidate for a two transaction purchase. The first purchase should take place starting at $30. The second purchase should take place around $23.47. Based on the market capitalization of NTAP may actually be a buyout candidate.
In May 2012, NTAP briefly fell below $30 and then rose +20% by the month of September 2012. Then on November 2, 2012 (found here), we recommended that investors consider buying NTAP ($27.74). Since our November 2, 2012 recommendation, NTAP has risen +18.28%. In all the history of the stock market over a 100-year, 50-year, and 30-year period, gains like these are exceptional on an annual basis and should be considered gifts in a months time.
We ask that you consider selling the principal and allow the gains to run. Keep in mind that we believe that stock is a buyout candidate. However, Dow Theory says that the wish should not become father to the the thought (source: Hamilton, William Peter. The Stock Market Barometer. Harper & Brothers, New York. 1922. page 133).
Comments Off on Nasdaq 100 Watch List: December 6, 2012
Posted in BBBY, BIDU, chip manufacturers, CTRP, mchp, Nasdaq 100 Watch List, NTAP, VOD, WCRX
Technical Review: Caterpillar (CAT)
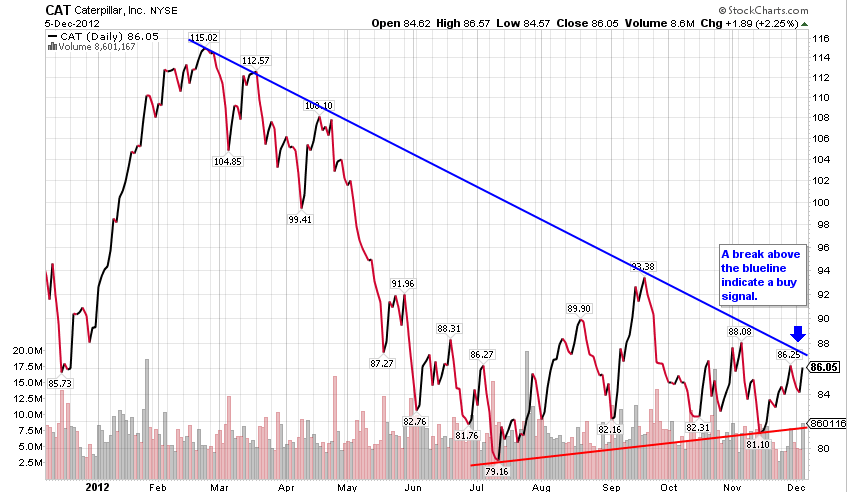
Caterpillar (CAT) is trading just slightly above it’s 52-week low based on our November 30, 2012 watch list (found here). While fundamentals are critical to the assessment of a company's staying power, another tool we find extremely useful is technical analysis.
The chart below shows CAT trading in a downward trend for about 5-6 months. The stock hit a high of $115 in late February then dropped to as low as $79 in mid July. Since then, a bottom was formed in the stock and higher volatility pushed the stock to $93, however, CAT failed to close and stay above the trend line (blue). The higher-lows (red line) that were recently created in July 2012 provides us with clear view on what the defined downside risk might be.
The pattern we’ve identified here is the falling wedge pattern which often indicates a possible reversal in the price. With the stock trading 8.5x forward earning and dividend yield of 2.3%, one could get behind the stock if CAT's price can decisively close above the blue declining trend line. Alternatively, if the stock breaks below the red trend line, the pattern would be deemed broken and more downside should be expected. More often than not, we’ve noticed that this reversal pattern has turned out to be a great risk/reward trade with proper execution.
based on the December 5, 2012 closing price
Again, we'd like to put emphasis on the view that fundamentals tells us what to buy and technical could provide additional information on when to buy.
Comments Off on Technical Review: Caterpillar (CAT)
Posted in technical, technical review
U.S. Dividend Watch List: November 30, 2012
Below are the 56 companies on our U.S. Dividend Watch List that are within 11% of their respective 52-week lows. Stocks that appear on our watch lists are not recommendations to buy. Instead, they are the starting point for doing your research and determining the best company to buy. Ideally, a stock that is purchased from this list is done after a considerable decline in the price and rigorous due diligence.
| Symbol | Name | Price | % Yr Low | P/E | EPS (ttm) | Dividend | Yield | Payout Ratio |
| OMI | Owens & Minor, Inc. | 27.38 | 0.37% | 16.01 | 1.71 | 0.88 | 3.21% | 51% |
| INTC | Intel Corp. | 19.57 | 1.74% | 8.55 | 2.29 | 0.90 | 4.60% | 39% |
| ED | Consolidated Edison, Inc. | 55.79 | 4.03% | 14.64 | 3.81 | 2.42 | 4.34% | 64% |
| MCD | McDonald's Corp. | 87.04 | 4.48% | 16.39 | 5.31 | 3.08 | 3.54% | 58% |
| RBCAA | Republic BanCorp., Inc. | 20.47 | 4.65% | 3.62 | 5.66 | 0.66 | 3.22% | 12% |
| WABC | Westamerica BanCorp. | 42.56 | 5.09% | 14.19 | 3.00 | 1.48 | 3.48% | 49% |
| BOH | Bank of Hawaii Corp. | 43.47 | 5.10% | 12.01 | 3.62 | 1.80 | 4.14% | 50% |
| SON | Sonoco Products Co. | 30.07 | 5.10% | 16.89 | 1.78 | 1.20 | 3.99% | 67% |
| JW-A | John Wiley & Sons Inc. | 42.70 | 5.12% | 13.14 | 3.25 | 0.80 | 1.87% | 25% |
| NJR | New Jersey Resources | 40.58 | 5.38% | 17.96 | 2.26 | 1.60 | 3.94% | 71% |
| LKFN | Lakeland Financial Corp. | 24.74 | 5.41% | 11.56 | 2.14 | 0.68 | 2.75% | 32% |
| ATR | AptarGroup Inc. | 47.67 | 5.49% | 19.62 | 2.43 | 0.88 | 1.85% | 36% |
| CBU | Community Bank System | 26.88 | 5.91% | 13.64 | 1.97 | 1.08 | 4.02% | 55% |
| TEG | Integrys Energy Group | 53.17 | 6.21% | 16.77 | 3.17 | 2.72 | 5.12% | 86% |
| SFNC | Simmons First National | 23.81 | 6.48% | 15.66 | 1.52 | 0.80 | 3.36% | 53% |
| VVC | Vectren Corp. | 29.25 | 6.52% | 14.77 | 1.98 | 1.42 | 4.85% | 72% |
| CWT | California Water Service | 18.00 | 6.89% | 16.51 | 1.09 | 0.63 | 3.50% | 58% |
| ABM | ABM Industries, Inc. | 19.08 | 6.89% | 19.67 | 0.97 | 0.58 | 3.04% | 60% |
| WEYS | Weyco Group, Inc. | 23.53 | 6.91% | 15.28 | 1.54 | 0.68 | 2.89% | 44% |
| NWN | Northwest Natural Gas Co. | 43.86 | 6.95% | 19.41 | 2.26 | 1.82 | 4.15% | 81% |
| TRMK | Trustmark Corp. | 22.22 | 7.03% | 12.70 | 1.75 | 0.92 | 4.14% | 53% |
| CASY | Caseys General Stores | 49.40 | 7.04% | 16.36 | 3.02 | 0.66 | 1.34% | 22% |
| IBM | IBM | 190.07 | 7.17% | 13.66 | 13.91 | 3.40 | 1.79% | 24% |
| PRK | Park National Corp. | 63.09 | 7.19% | 14.31 | 4.41 | 3.76 | 5.96% | 85% |
| PX | Praxair, Inc. | 107.21 | 7.21% | 19.11 | 5.61 | 2.20 | 2.05% | 39% |
| SRCE | 1st Source Corp. | 21.15 | 7.36% | 10.79 | 1.96 | 0.68 | 3.22% | 35% |
| ONB | Old National BanCorp. | 11.74 | 8.00% | 12.36 | 0.95 | 0.36 | 3.07% | 38% |
| DBD | Diebold, Inc. | 29.91 | 8.13% | 11.33 | 2.64 | 1.14 | 3.81% | 43% |
| FDS | FactSet Research Systems | 92.39 | 8.21% | 22.42 | 4.12 | 1.24 | 1.34% | 30% |
| STBA | S&T BanCorp., Inc. | 16.97 | 8.23% | 14.38 | 1.18 | 0.60 | 3.54% | 51% |
| PNY | Piedmont Natural Gas | 30.86 | 8.24% | 19.78 | 1.56 | 1.20 | 3.89% | 77% |
| ANAT | American Nat'l Insurance | 68.99 | 8.34% | 10.12 | 6.82 | 3.08 | 4.46% | 45% |
| SJW | SJW Corp. | 24.46 | 8.42% | 20.05 | 1.22 | 0.71 | 2.90% | 58% |
| CLC | Clarcor Inc. | 46.38 | 8.49% | 19.09 | 2.43 | 0.54 | 1.16% | 22% |
| WGL | WGL Holdings, Inc. | 39.06 | 8.62% | 14.41 | 2.71 | 1.60 | 4.10% | 59% |
| TMP | Tompkins Financial Corp. | 38.99 | 8.85% | 15.91 | 2.45 | 1.52 | 3.90% | 62% |
| GD | General Dynamics Corp. | 66.50 | 8.86% | 9.90 | 6.72 | 2.04 | 3.07% | 30% |
| CAT | Caterpillar Inc. | 85.24 | 8.93% | 8.73 | 9.76 | 2.08 | 2.44% | 21% |
| APD | Air Products & Chemicals | 82.94 | 8.97% | 15.25 | 5.44 | 2.56 | 3.09% | 47% |
| SJI | South Jersey Industries | 49.97 | 9.08% | 14.74 | 3.39 | 1.77 | 3.54% | 52% |
| GRC | Gorman-Rupp Company | 27.83 | 9.09% | 19.74 | 1.41 | 0.40 | 1.44% | 28% |
| CFR | Cullen/Frost Bankers | 54.61 | 9.11% | 14.45 | 3.78 | 1.92 | 3.52% | 51% |
| FNB | F.N.B. Corp. | 10.80 | 9.20% | 14.03 | 0.77 | 0.48 | 4.44% | 62% |
| ETP | Energy Transfer Partners | 43.89 | 9.21% | 10.09 | 4.35 | 3.58 | 8.16% | 82% |
| EXPD | Expeditors International | 37.42 | 9.42% | 23.39 | 1.60 | 0.56 | 1.50% | 35% |
| BDX | Becton, Dickinson | 76.67 | 9.45% | 13.72 | 5.59 | 1.98 | 2.58% | 35% |
| ADM | Archer Daniels Midland | 26.70 | 9.52% | 18.67 | 1.43 | 0.70 | 2.62% | 49% |
| UBSI | United Bankshares, Inc. | 24.70 | 9.58% | 15.25 | 1.62 | 1.24 | 5.02% | 77% |
| CAH | Cardinal Health, Inc. | 40.45 | 9.59% | 12.80 | 3.16 | 1.10 | 2.72% | 35% |
| SCG | SCANA Corporation | 46.34 | 9.60% | 14.90 | 3.11 | 1.98 | 4.27% | 64% |
| TNC | Tennant Co. | 38.14 | 9.63% | 18.70 | 2.04 | 0.72 | 1.89% | 35% |
| PPL | PP&L Corporation | 29.35 | 10.01% | 10.56 | 2.78 | 1.44 | 4.91% | 52% |
| DCI | Donaldson Co. Inc. | 33.58 | 10.06% | 20.48 | 1.64 | 0.36 | 1.07% | 22% |
| IBKC | IBERIABANK Corp. | 48.75 | 10.09% | 20.31 | 2.40 | 1.36 | 2.79% | 57% |
| MATW | Matthews International | 30.25 | 10.32% | 15.28 | 1.98 | 0.40 | 1.32% | 20% |
| CVX | Chevron Corp. | 105.69 | 10.40% | 8.67 | 12.19 | 3.60 | 3.41% | 30% |
| 56 Companies | ||||||||
Watch List Review
Medical equipment company, Owens & Minor (OMI) topped our list this week after shares fell -7% when the company issued 2013 guidance that was below the street's expectations. The comment below comes from Associated Press.
The company said it expects to earn $1.90 to $2 per share for 2013, not counting some expenses from its $158 million purchase of Movianto Group, which allowed it to enter the European health care market. Analysts surveyed by FactSet, on average, were expecting profit of $2.07 per share.
Owens & Minor also said it expects revenue growth of 2 percent to 4 percent. Wall Street is expecting sales of $9.2 billion.
The low growth of revenue is concerning but that is somewhat expected given the industry the company competes in. The dividend of 3.2% and 51% payout ratio coupled with strong history of dividend increases (13% annual growth rate for 23 years) makes this company a top prospect for research.
The next company, Intel (INTC), has appeared on our list for many weeks. The stock continues to be under pressure by the macro view of PC growth. Goldman Sachs and Citigroup issued a ‘sell’ rating on the stock. The thesis of ‘the death of PC’ is one that investors are basing their selling of this stock on, but this isn’t the first time analysts cut ratings based on PC weakness. They did that in October 2008 (read here). Since that article was published, shares dropped as low as $12.40 (-28%) from $17.30 but had risen to $29.27 (+69%). Intel earnings per share (EPS) for 2013 is now expected to be $1.96 versus $2.11 in 2012, a 7% decline.
Something worth noting this week is that 5 out of 56 companies are Dow Jones Industrial components. Those companies are Caterpillar (CAT), Chevron (CVX), IBM (IBM), Intel (INTC), and McDonald’s (MCD). That’s 16% of the Dow! Any conservative investors may look deeper into each one of these companies as a starting point for a constructing a well diversified portfolio with blue-chip stocks.
Comments Off on U.S. Dividend Watch List: November 30, 2012
Posted in NLO Dividend Watch List
Dow Theory: Secular and Cyclical Markets
We often mention the concept of secular and cyclical markets in our discussion of Dow Theory. So far, we believe that we’re in a secular bear market owing to the fact that the Dow Jones Industrial Average and Dow Jones Transportation Average cannot meaningfully exceed prior peaks. However, we feel it is necessary to provide a graphical representation of what a secular and cyclical market looks like.
Keep in mind that active analysis of Dow Theory provides cyclical indications of moves in the market which usually lasts from 2 to 6 years. Depending on the circumstance, which usually hinges on the quality of analysis, Dow Theory also provides an indication of secular trend changes in the market. However, secular trends usually encompass periods from 16 years to as many as 24 years.
In this assessment, we’re assuming that Dow Theory was only able to provide bullish signals at 1/4 of the move from the bottom and bearish signals 1/4 of the move from the top for each cyclical trend. This is a very generous assumption in favor of those who are critical of the validity of Dow Theory as a market forecasting tool.
Historical Perspective and Highlights
First, let us start with the history of stock market secular trends from 1906 to the present broken into the various cyclical moves that can be easily identified (detailed review of stock market from 1860-1906 found here). The first secular trend is from 1906 to 1924 in what is clearly a bear market. Our definition of a secular bear market is the inability of the Dow Jones Industrial Average to exceed a prior high level for an extended period of time. As seen in the chart below, the 1906 to 1924 period certainly fits the bill.

The secular bear market from 1906 to 1924 was 18 years long. As indicated with the arrows (green arrows for cyclical bull markets and red arrows for cyclical bear markets) there were many instances where an investor could have avoided the losses of buy-and-hold if Dow Theory was applied.
What should follow a secular bear market is a secular bull market, however, the period from 1924 to 1942 was a combination of both with a quasi-secular bull market from 1924-1929 and a quasi-secular bear market from 1929-1932. Charles H. Dow has commented that markets move like a pendulum, swinging from excessive gains to excessive losses. S.A. Nelson has specifically outlined Dow’s point by referring to the extremes of these swings in the market as “artificial advances” and “artificial depressions.” (found here). William Peter Hamilton’s account of Dow Theory on November 17, 1924 was as follows:
“At the opening of the week the industrial and railroad share averages simultaneously broke through all previous points of resistance this year so decisively as to constitute by the Dow theory of analysis as emphatic and indication of a major bull market as has ever been discovered in the long history of the movements of these averages. By the end of the week the industrials were up approximately three points and the railroads two points through their previous best prices this year. That spells a dynamic movement of impressive proportions and unquestionably it forecasts in due time a further sustained upward movement that will eventually better every price yet seen.” (source: Hamilton, William Peter. “What of the Market?. Barron’s. November 17, 1924. page 2.)
The compressed period of time that the Dow Industrial Average rose from 100 to 381 might have been the first clue that the gains were not sustainable. As an example, in the secular bull market from 1942 to 1966, it took 12 years to rise an equal percentage amount. Likewise, in the secular bull market from 1982, it took the Dow Industrials 13 years to equal the percentage gains made from 1924 to 1929. Fortunately for some and unfortunately for many, the 1924-1942 period provided both secular moves within a single secular timeframe.
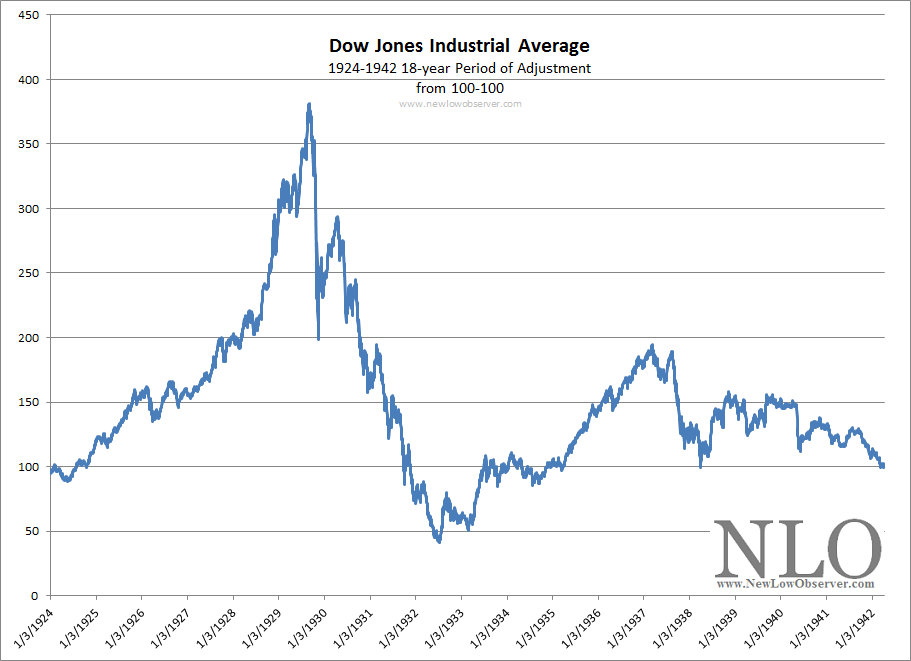
Shortly before his passing, William Peter Hamilton, Dow Theorist and fourth editor of the Wall Street Journal, wrote his famous “Turn of the Tide” editorial in the Wall Street Journal and Barron’s indicating that the bull market move had ended when the Dow Industrials were trading at around 325.17 (source: “A Turn in the Tide”. Barron’s. October 28, 1929. page 14). The follow-up analysis of a new bull market came from Dow Theorist Charles J. Collins who suggested that “…failure on the part of the rail average to confirm the weakness in the industrial list suggested a rather strong foundation to the market (source: Collins, Charles. Barron’s. August 8, 1932. page 5)”. At that time, the Industrials were trading at the 67.71 level. The subsequent move in the Dow Industrials to the March 1937 high was over +180%. Likewise, the decline that followed to the 1942 low was equal to -48%.
With the stock market reeling from the “adjustment” from the 1929 peak and crash, the next move in the market should have been a secular bull market. The next move in the market was, in fact, a secular bull market that ran from 1942 to 1966. The ideal for any market forecaster is to be able to distinguish a secular bull market from a cyclical bull market within a secular bull trend. The reason for this is because, if correct, investors can stay fully invested through the entire secular bull trend while taking advantage of short-term declines with new investment of funds. Cyclical bull markets within a secular bear trend require investors to sell some or all of their stock to be repurchased at the next Dow Theory cyclical bull market indication.
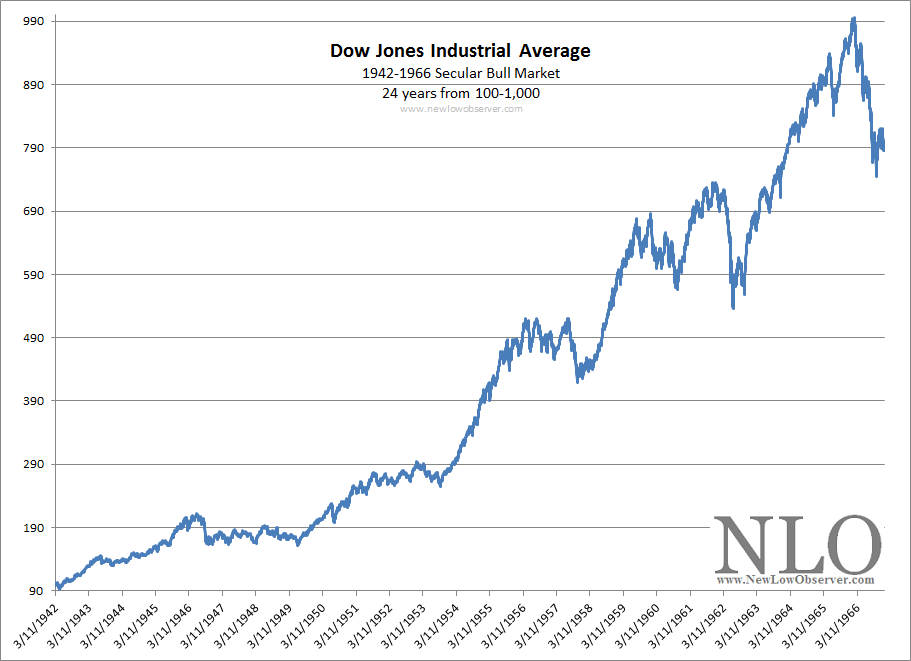
The secular bull market move from 100 to 1,000 was every investor’s dream. However, the stock market collapse and the “Great” Depression that preceded it kept the majority of investors out of the market until the final run-up from 1962 to 1966. Naturally, just as the majority of investors became confident of the secular bull market, the secular bull market was on its last leg. Richard Russell had the following to say of the 1966 Dow Theory bear market signal:
“Having failed to hit new highs on the April [1966] recovery, the two Averages again retreated. On May 5 the March lows were penetrated to the accompaniment of heavy volume. Based on the method formulated by Charles H. Dow at the turn of the century, the two Averages on May 5 gave the signal for a primary bear market. We now know that the February-March [1966]decline was the first leg of the bear market, and the March-April [1966] rise was the first (upward) correction. the second leg began in late April and remains in force (source: Russell, Richard. “Bear Market Signaled Under Dow Theory”. Barron’s. May 9, 1966. page 31.)
The secular bear market that followed from 1966 to 1982 seemed brutal on a relative basis. However, it was no worse or better than the secular bear market from 1906 to 1924. Much of the reason that the period from ‘66-‘82 seemed particularly difficult is mainly due to how recent it occurred rather than the relative depth in the market decline. It lasted from 1966 to 1982 or 16 years.
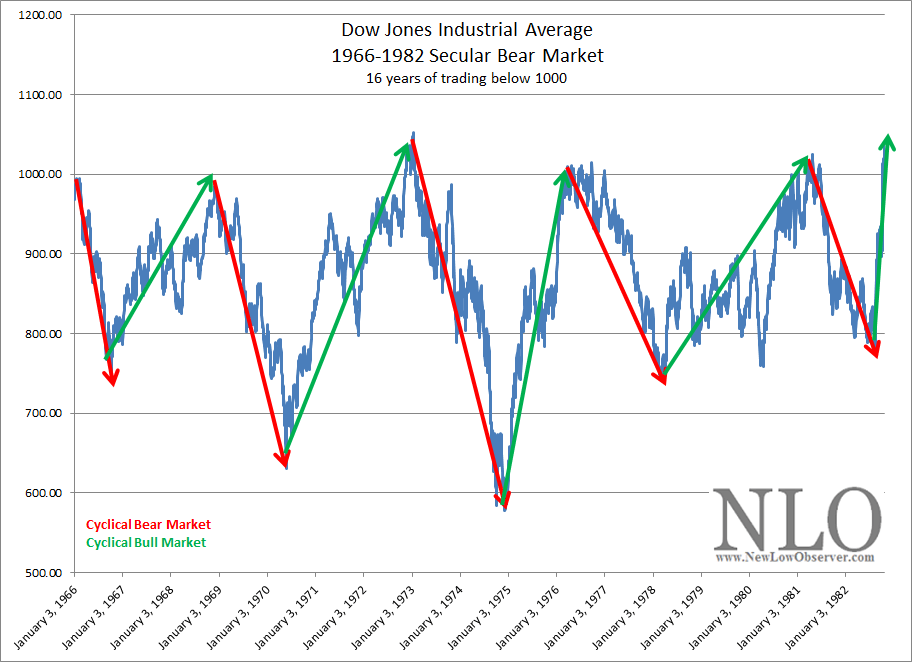
The secular bear market from 1966 to 1982 experienced five cyclical bear markets and four cyclical bull markets. For all intents and purposes, it was among the worst times to be a buy-and-hold investor. However, our favorite article in review of this period is Jeremy Siegel’s “Nifty Fifty Revisited” which showed what would happen if an investor had bought and held the hottest stocks from the peak in the market in 1972 (those stocks with the highest P/E ratios) and reviewed their performance until 1995 (PDF found here). There is merit in buy-and-hold investing and for our money the Siegel article makes the case quite well, especially if the investor happens start investing in a secular bear market and has an investment horizon with a minimum of 20 years.
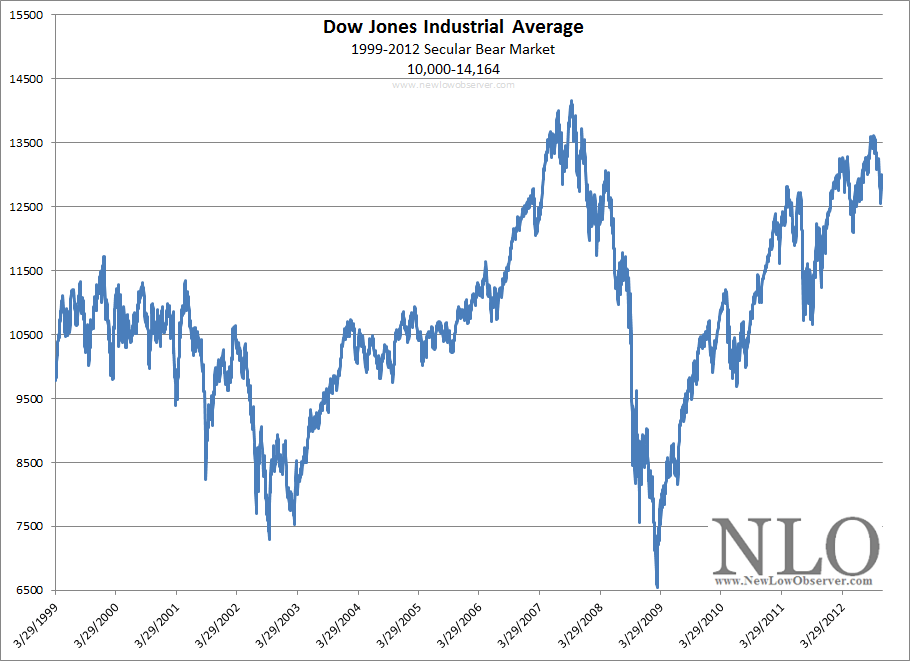
The secular bull market that followed the secular bear market of 1966 to 1982 lasted from 1982 to 2000 and saw the Dow Jones Industrial Average rise from 1,000 to approximately 11,500. Although we’ve indicated that the year 2000 was the end to the secular bull market, a valid case can be made for 2007 as the end of the secular bull market. In either case, the Dow Industrial Average is marginally above the 2000 level or below the 2007 peak.
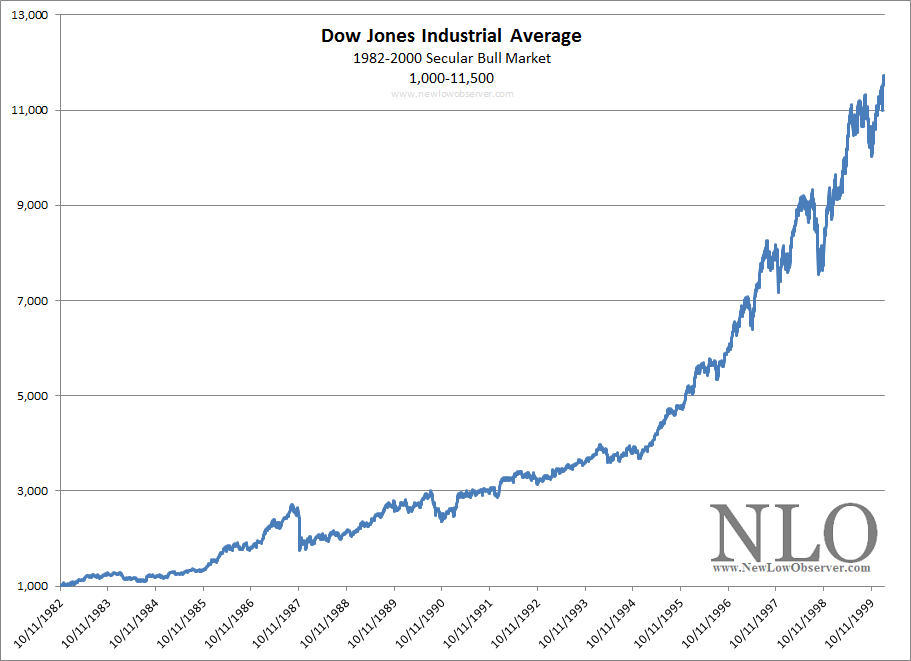
Our interpretation that we’ve been in a secular bear market since 2000 or 2007 only holds water as long as 11,500/14,164 is the range that the Dow Jones Industrials trades in. A common timeframe for our version of secular periods averages around 18.8 years based on the previous five periods. This suggests that if the 2000 peak holds then the secular bear market should end in the years between 2016 to 2023. We’re partial to the idea that the 2007 top was a secular peak. Richard Russell had the following to say on the topic of Dow Theory shortly after the 2007 peak:
“Did last week’s market volatility make you queasy? If you believe in the Dow Theory, there was reason to be wary. The Dow Jones Industrial and Transportation averages plunged to end-of-day lows of 12,845.78 and 4,672.35, respectively, on Aug. 16. Both then rallied. But while the industrials hit a record 14,164.53 on Oct. 9, the transports didn't come near a record, thus failing to confirm the DJIA's strength. This set up the potential for a classic Dow Theory bear-market signal” (Russell, Richard. “What Does Dow Theory Says”. Barron’s. November 12, 2007. link here.).
Summary on Secular and Cyclical Trends
Classic secular bull market moves typically require investors to only buy in the beginning and hold ‘til the end. The obvious challenge is to understand and accept that the prior secular bear market should be followed by a secular bull market. This is a difficult psychological transition for investors after experiencing four or five cyclical bear market moves over the course of 16 to 18 years.
Classic secular bear markets require timing tools like Dow Theory to keep an investor’s expectation in check with the investing environment. Alternatively, investors who expect to buy-and-hold during a secular bear market must have a time horizon that is exceptionally long in duration and hold stocks that provide income to offset inflation and possible lack of capital appreciation. Jeremy Siegel’s article titled the “Nifty-Fifty Revisited” is an exceptional rationale to hold stocks through a secular bear market (PDF found here).
Although Dow Theory can inform an investor of being in a secular bull and bear market after the fact, it is of greatest use at calling cyclical bull and bear markets, especially within a secular bear market. So far, we happen to be in the most ideal period when Dow Theory could be of the most benefit to investors.
Comments Off on Dow Theory: Secular and Cyclical Markets
Posted in cycle analysis, Cyclical Bear Market, Cyclical Bull Market, Dow Theory, Secular Bear Market, Secular Bull Market
Values According to S. A. Nelson
S.A. Nelson is credited with coining the term "Dow's Theory." In fact, Nelson tried to convince Charles H. Dow to write a book about his articles in the Wall Street Journal but did not succeed. After failing to get Dow to write a book, Nelson wrote his own based on Dow's writing. The book titled ABC of Stock Speculation neatly lays the groundwork for Dow's Theory to be recognized and interpreted throughout history.
In one excerpt from the book A Treasury of Wall Street Wisdom, Nelson says:
"...stocks have recovered after artificial depression and relapsed after artificial advances to the middle point which represented value as it was understood by those who bought or held as investors."
This means that if an index or stock that has fallen below the halfway point of the previous advance or risen above the halfway point of a previous decline, then the index/stock is either undervalued or overvalued. If the index/stock has fallen close to the prior level of where the advance started and the index/stock is still fundamentally sound then the index/stock could be considered extremely undervalued. Likewise, if the index/stock has risen far above the prior high then it is considered overvalued.
When we start to consider investing in an individual stock, we only want to know if the price of the stock has reached a new 1-year low. From this vantage point, we can determine if the stock is trading at an extreme relative to the halfway point of the previous advance and decline. Again, this approach can only work if the company is generally in fair condition. This means that earnings exist, the dividend payout ratio isn't too high and management has a track record of rewarding the shareholders etc.
The halfway point of the previous advance or decline is the point at which "long-term" investors would consider the stock or index fairly valued. Traders can take advantage of this fact and use it to their benefit. In the chart below, we show the Dow Jones Industrial Average since 1997. 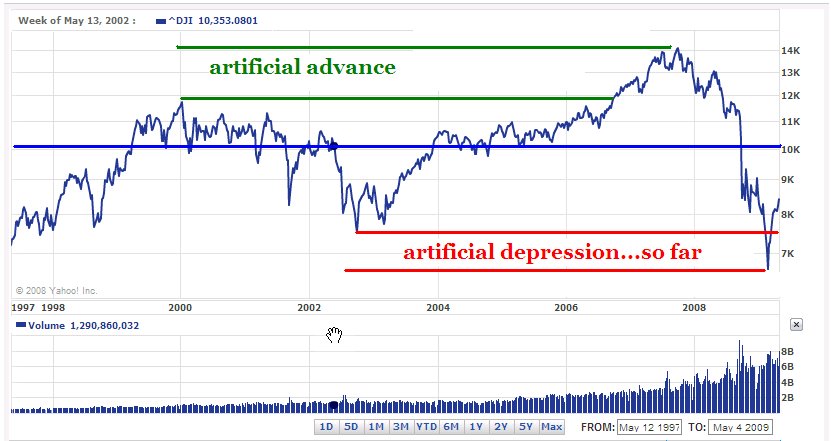
What is important to notice is that the artificial advance and artificial depression meet at the halfway point of 10,302.31 (dark blue horizontal line.) If drawn backwards to the point when the Dow first went above 10,000, we can see an enormous amount of time spent at or around 10,302.31. This indicates that, for now, "long-term" investors fairly value the market at the 10.3K level.

What is important to notice is that the artificial advance and artificial depression meet at the halfway point of 10,302.31 (dark blue horizontal line.) If drawn backwards to the point when the Dow first went above 10,000, we can see an enormous amount of time spent at or around 10,302.31. This indicates that, for now, "long-term" investors fairly value the market at the 10.3K level.
Note: This article was originally published in May 2009 on our former site Dividend Inc. (found here).
U.S. Dividend Watch List: November 23, 2012
Below are the 50 companies on our U.S. Dividend Watch List that are within 11% of their respective 52-week lows. Stocks that appear on our watch lists are not recommendations to buy. Instead, they are the starting point for doing your research and determining the best company to buy. Ideally, a stock that is purchased from this list is done after a considerable decline in the price and rigorous due diligence.
| Symbol | Name | Price | % Yr Low | P/E | EPS (ttm) | Dividend | Yield | Payout Ratio |
| ED | Consolidated Edison, Inc. | 54.10 | 0.49% | 14.20 | 3.81 | 2.42 | 4.47% | 64% |
| NJR | New Jersey Resources | 39.19 | 0.77% | 17.34 | 2.26 | 1.60 | 4.08% | 71% |
| INTC | Intel Corp. | 19.72 | 0.80% | 8.61 | 2.29 | 0.90 | 4.56% | 39% |
| JW-A | John Wiley & Sons Inc. | 41.72 | 0.97% | 12.84 | 3.25 | 0.80 | 1.92% | 25% |
| ANAT | American Nat'll Insurance | 65.41 | 1.44% | 9.59 | 6.82 | 3.08 | 4.71% | 45% |
| NWN | Northwest Natural Gas | 42.17 | 1.47% | 18.66 | 2.26 | 1.82 | 4.32% | 81% |
| SJW | SJW Corp. | 23.29 | 1.61% | 19.09 | 1.22 | 0.71 | 3.05% | 58% |
| VVC | Vectren Corp. | 28.33 | 1.98% | 14.31 | 1.98 | 1.42 | 5.01% | 72% |
| WGL | WGL Holdings, Inc. | 37.30 | 2.01% | 13.76 | 2.71 | 1.60 | 4.29% | 59% |
| CASY | Caseys General Stores | 47.89 | 2.12% | 15.86 | 3.02 | 0.66 | 1.38% | 22% |
| CWT | California Water Service | 17.50 | 2.13% | 16.06 | 1.09 | 0.63 | 3.60% | 58% |
| PNY | Piedmont Natural Gas | 29.67 | 2.20% | 19.02 | 1.56 | 1.20 | 4.04% | 77% |
| MSEX | Middlesex Water Co. | 18.21 | 2.21% | 21.17 | 0.86 | 0.75 | 4.12% | 87% |
| MCD | McDonald's Corp. | 87.05 | 2.25% | 16.39 | 5.31 | 3.08 | 3.54% | 58% |
| SFNC | Simmons First National | 23.37 | 2.29% | 15.38 | 1.52 | 0.80 | 3.42% | 53% |
| AMAT | Applied Materials Inc. | 10.40 | 2.35% | 115.56 | 0.09 | 0.36 | 3.46% | 400% |
| SJI | South Jersey Industries | 48.05 | 2.38% | 14.17 | 3.39 | 1.77 | 3.68% | 52% |
| PPL | PP&L Corporation | 28.08 | 2.40% | 10.10 | 2.78 | 1.44 | 5.13% | 52% |
| ATR | AptarGroup Inc. | 47.62 | 2.46% | 19.60 | 2.43 | 0.88 | 1.85% | 36% |
| CLC | Clarcor Inc. | 45.12 | 2.52% | 18.57 | 2.43 | 0.54 | 1.20% | 22% |
| RAVN | Raven Industries, Inc. | 24.29 | 2.55% | 17.11 | 1.42 | 0.42 | 1.73% | 30% |
| OMI | Owens & Minor, Inc. | 28.90 | 2.57% | 16.90 | 1.71 | 0.88 | 3.04% | 51% |
| SON | Sonoco Products Co. | 30.25 | 2.60% | 16.99 | 1.78 | 1.20 | 3.97% | 67% |
| WABC | Westamerica BanCorp. | 42.92 | 2.60% | 14.31 | 3.00 | 1.48 | 3.45% | 49% |
| THFF | First Financial Corp. | 28.73 | 2.91% | 11.05 | 2.60 | 0.94 | 3.27% | 36% |
| ABM | ABM Industries, Inc. | 18.97 | 2.98% | 19.56 | 0.97 | 0.58 | 3.06% | 60% |
| MATW | Matthews Int'l | 29.20 | 3.63% | 14.75 | 1.98 | 0.40 | 1.37% | 20% |
| SRCE | 1st Source Corp. | 21.00 | 3.67% | 10.71 | 1.96 | 0.68 | 3.24% | 35% |
| FDS | FactSet Research Systems | 91.39 | 4.56% | 22.18 | 4.12 | 1.24 | 1.36% | 30% |
| GD | General Dynamics Corp. | 65.41 | 4.66% | 9.73 | 6.72 | 2.04 | 3.12% | 30% |
| DBD | Diebold, Inc. | 29.65 | 4.70% | 11.23 | 2.64 | 1.14 | 3.84% | 43% |
| RBCAA | Republic BanCorp., Inc. | 20.97 | 4.75% | 3.70 | 5.66 | 0.66 | 3.15% | 12% |
| ETP | Energy Transfer Partners | 43.15 | 4.89% | 9.92 | 4.35 | 3.58 | 8.30% | 82% |
| WEYS | Weyco Group, Inc. | 23.65 | 5.11% | 15.36 | 1.54 | 0.68 | 2.88% | 44% |
| TMP | Tompkins Financial Corp. | 38.51 | 5.13% | 15.72 | 2.45 | 1.52 | 3.95% | 62% |
| CAT | Caterpillar Inc. | 84.16 | 5.13% | 8.62 | 9.76 | 2.08 | 2.47% | 21% |
| STBA | S&T BanCorp., Inc. | 16.93 | 5.23% | 14.35 | 1.18 | 0.60 | 3.54% | 51% |
| TEG | Integrys Energy Group | 52.60 | 5.39% | 16.59 | 3.17 | 2.72 | 5.17% | 86% |
| CAH | Cardinal Health, Inc. | 39.99 | 5.40% | 12.66 | 3.16 | 1.10 | 2.75% | 35% |
| TNC | Tennant Co. | 37.74 | 5.58% | 18.50 | 2.04 | 0.72 | 1.91% | 35% |
| EXPD | Expeditors Int'l | 37.18 | 5.63% | 23.24 | 1.60 | 0.56 | 1.51% | 35% |
| IBM | IBM | 193.49 | 5.86% | 13.91 | 13.91 | 3.40 | 1.76% | 24% |
| APD | Air Products & Chemicals | 83.04 | 6.10% | 15.26 | 5.44 | 2.56 | 3.08% | 47% |
| SCG | SCANA Corp. | 45.13 | 6.20% | 14.51 | 3.11 | 1.98 | 4.39% | 64% |
| ADM | ADM Co. | 26.74 | 6.56% | 18.70 | 1.43 | 0.70 | 2.62% | 49% |
| DCI | Donaldson Co. Inc. | 33.56 | 6.66% | 20.46 | 1.64 | 0.36 | 1.07% | 22% |
| IBKC | IberiaBank Corp. | 48.83 | 6.87% | 20.35 | 2.40 | 1.36 | 2.79% | 57% |
| UNM | Unum Group | 20.23 | 6.97% | 23.80 | 0.85 | 0.52 | 2.57% | 61% |
| EGN | Energen Corp. | 44.44 | 7.14% | 15.65 | 2.84 | 0.56 | 1.26% | 20% |
| UBSI | United Bankshares, Inc. | 24.97 | 7.36% | 15.41 | 1.62 | 1.24 | 4.97% | 77% |
| 50 Companies | ||||||||
Watch List Review
Two major utilities companies topped our list this week. Consolidated Edison (ED) and New Jersey Resources (NJR) both yield more than 4%. Despite being the first and second companies on our list, we feel there are better alternatives based on the fundamental numbers such as P/E and dividend yield.
Right after those two utilities is Intel (INTC) which yields 4.56%, higher than both companies. The payout ratio of 39% is also lower than that of the utility companies. In addition, the P/E ratio of 8.6 is about half of those two companies as well. If we are to enter into a recession, I expect a major earnings decline so the P/E will no be sustained but we truly believe the dividend is here to stay. As full disclosure, we are long this company and will aim to purchase more if it falls to $16 or below.
Top Five Performance Review
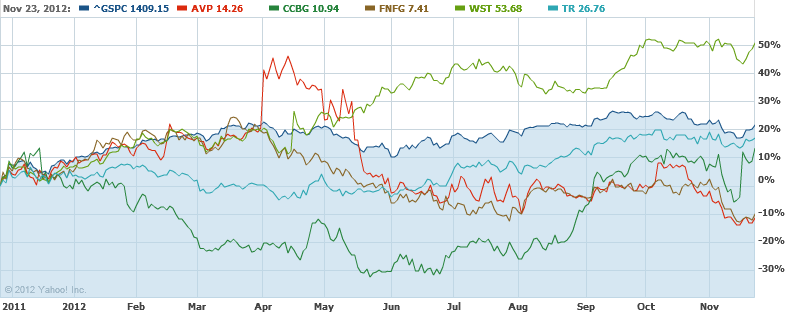
In our ongoing review of the NLO Dividend Watch List, we have taken the top five stocks on our list from November 25, 2011 and have check their performance one year later. The top five companies on that list can be seen in the table below.
| Symbol | Name | 2011 Price | 2012 Price | % change |
| AVP | Avon Products, Inc. | 16.09 | 14.26 | -11.37% |
| CCBG | Capital City Bank Group | 9.65 | 10.94 | 13.37% |
| FNFG | First Niagara Financial Group Inc. | 8.24 | 7.41 | -10.07% |
| TR | Tootsie Roll Industries Inc | 22.88 | 26.76 | 16.96% |
| WST | West Pharmaceutical | 35.60 | 53.68 | 50.79% |
| Average | 11.93% | |||
| DJI | Dow Jones Industrial | 11,231.65 | 13,009.68 | 15.83% |
| SPX | S&P 500 | 1,158.67 | 1,409.15 | 21.62% |
Our top five failed to meet the market’s performance. The best performer is West Pharmaceutical (WST) which nearly doubled its value. Avon (AVP) was the worst performer. However, despite not exceeding the indexes, four of the five stocks exceeded +10% gains within the first 2 months. Additionally, four of five stocks achieved gains of +20% before declining.
Dow Theory: Industrial Production Index Points to Recession
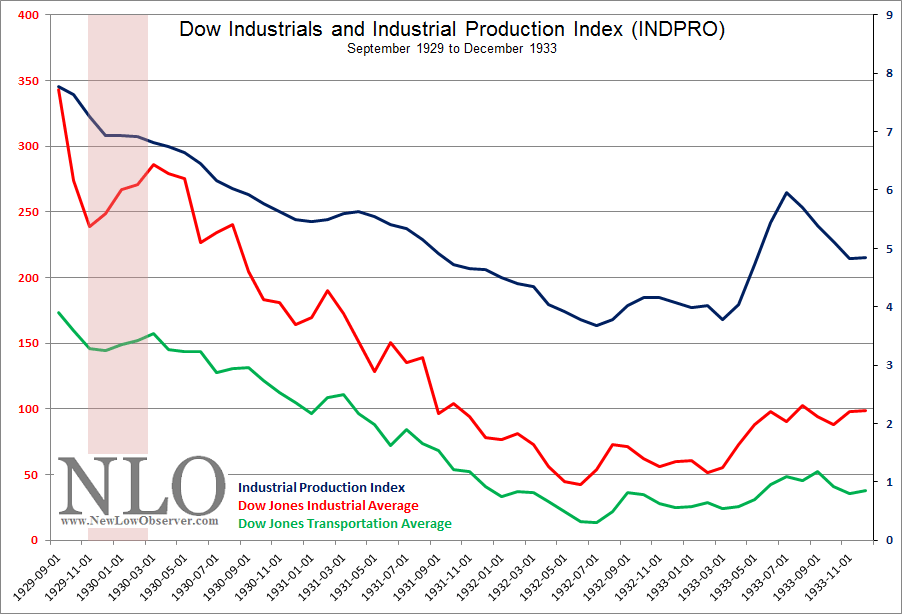
The Industrial Production Index (IPI) is an important lagging indicator that is part of Dow Theory as suggested in Robert Rhea’s book Dow Theory Applied to Business and Banking. Although seldom mentioned by modern Dow Theorists, the IPI is useful in confirming the validity of Dow Theory indications. This explains why a Dow Theory primary bull market was not announced by Robert Rhea in the period from November 1929 to April 1930. Although the stock market was rebounding from the “Great” Crash of 1929, the IPI was still in a declining trend, highlighted in the red bar as shown in the chart below.
In our last review of the Industrial Production Index on April 20, 2012, we had indicated that we’d need to see two consecutive months of decline in order for a confirmation of a recession while in a Dow Theory bear market. Since that piece, we have not seen two consecutive months of declines. However, as the data for the Industrial Production Index is continually updated, as much as six months into the past, we begin to see an emerging pattern.
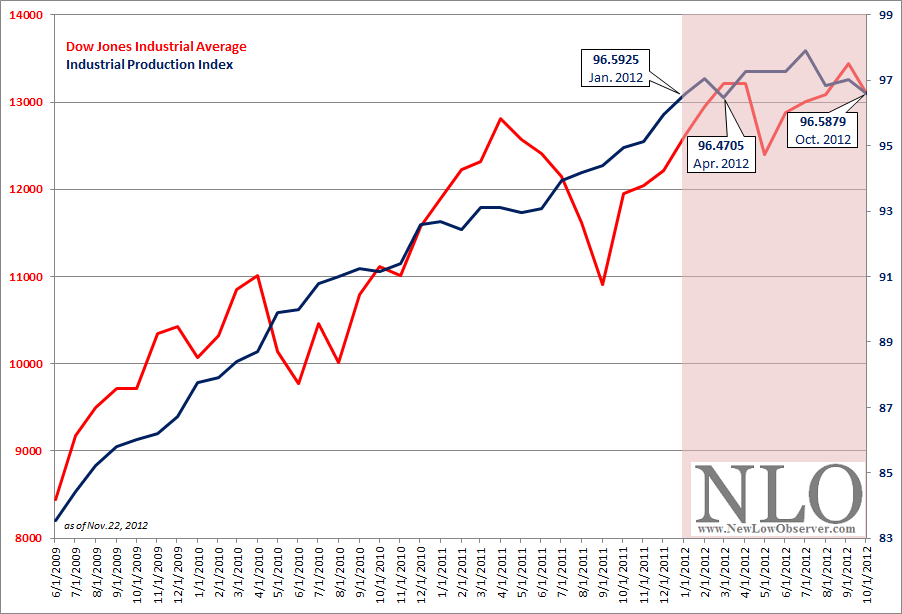
Since January 2012, the Industrial Production Index has traded in a narrow range, based on the revised data. Already the Industrial Production Index is below the July 2012 high and approaching the April 2012 low of 96.4705. Falling below the April low could indicate that the recession had begun as early as January 2012. The Industrial Production Index has not been mired in such a range since the end if the recession was called in June of 2009. Additionally, the preliminary data suggests that the economic recovery has hit a snag and may be on the cusp of a full blown recession (as defined by the National Bureau of Economic Research).
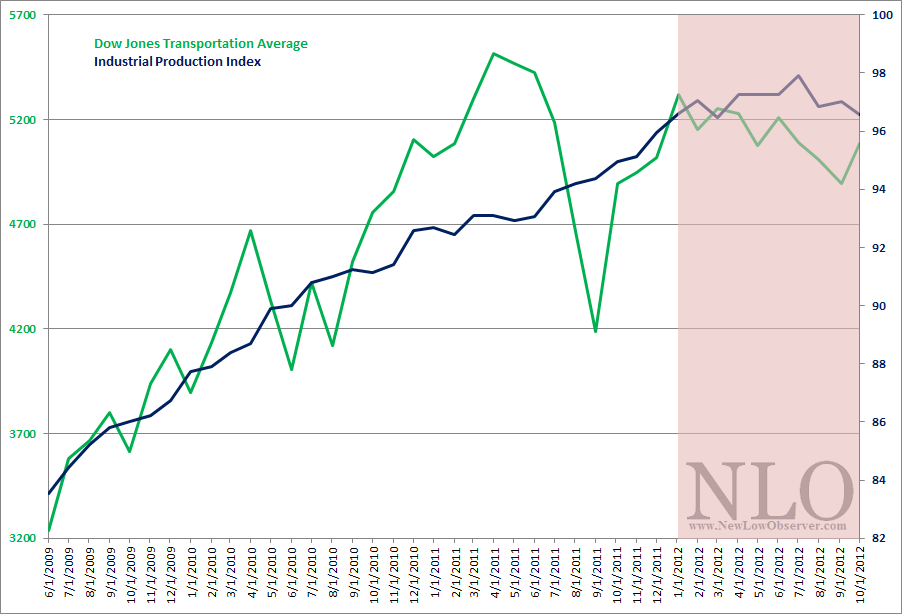
As can be seen in the chart above, the Dow Jones Transportation Average and the Industrial Production Index seem to have experiences similar troubles at around the same point in time. True to form, the Dow Jones Transportation Index has gyrated widely to the downside with little ability to exceed the 2007 and 2011 highs.
From a historical standpoint, whenever the Industrial Production Index has peaked, 13 out of 17 times since 1920 (76.47%), the result was a recession call by the NBER. All that is left at this point is for the Industrial Production Index to rise, fall or get revised significantly outside of the established range. Rising or falling by a wide margin could definitively answer the question about whether we’re in a recession. The range could be revised out of existence through the process of updating the figures.
Our take is that there has to be a significant amount of economic growth through economic stimulus that dwarfs all prior efforts since 2007. Outside of such efforts by monetary and fiscal actions, we believe that a recession could be considered in effect from either January 2012 or July 2012.
Comments Off on Dow Theory: Industrial Production Index Points to Recession
Posted in Dow Theory, Industrial Production Index, IPI
Tagged members
Dow Theory
How long does a Dow Theory Primary Bull Market last?
Recently, some followers of Dow Theory had suggested that a new primary bull market began on June 4, 2012. Those same Dow Theorists are now put in the awkward position of changing that primary bull market call to a primary bear market indication as recently as November 11th or 16th of this year.
However, when doing the math, those Dow Theorists who claimed that a primary bull market began on June 4, 2012 have very little to show for it, especially when, by their own account, a primary bear market was signaled on November 11th or 16th. To demonstrate how inaccurate that analysis was, since June 4th, the Dow Industrials has increased +4.02% while the Dow Transports increased +0.90%. Even in the period from June 4th until the respective peaks, the gains were marginal with the Dow Jones Transportation Average gaining +8.31% by June 19th without being able to exceed the 2011 peak. At the same time, the Dow Jones Industrial Average gained +12.47% by October 5th without being able to exceed the 2007 peak. The inability to exceed prior all-time highs is uncharacteristic of what one should expect of any market move deemed a “primary bull market.”
In all of the history of the Dow Industrials and Dow Transportation Averages, primary bull market moves have never lasted for only 5 months. The following examples from renown Dow Theorists suggest that any indication that a primary bull market began in June 2012 and ended in November 2012 was done so in error.
When William Peter Hamilton wrote on the topic of the primary bull market movements in his book Stock Market Barometer, he said the following:
“The average duration of six major bull swings is twenty-five months…(page 44).”
According the Robert Rhea’s book The Dow Theory:
“…a primary bull market is a broad upward movement, interrupted by secondary reactions, and averaging longer than two years (page 44).”
From E. George Schaefer’s book How I Helped 10,000 Investors to Profit in Stocks comes this conclusion:
“…in primary bull markets the duration of a typical primary up-trend might last from four to eleven years…(page 42)”
It is more likely that a primary bear market can last as little as 5 months due to panics and crashes. However, in order for Dow Theory to be worth its weight, a primary bull market should see an investor through an extended period of time (at minimum 12 to 18 months and usually 2 years or more) and not a period of less than 6 months.
Dow Theory: The Backdrop
On August 2, 2011, Dow Theory provided us with the first primary bear market signal since the primary bull market indication of July 23, 2009. This bear market indication came with a very interesting backdrop that is worth reviewing. On the very same day as our bear market indication (Aug. 2, 2011), the Senate passed the bill allowing for the extension of the debt ceiling (found here). The Senate vote came one day after the House of Representatives approved legislation to raise the debt ceiling to $14.3 trillion (found here).
The discussion and debate prior to the actual passage of the bill, allowing for the debt ceiling increase, suggested that the country would suffer irreparable damage if Congress didn’t come up with a solution. Once the bill was passed, Congressional members were as giddy as can be. There was a lot of back slapping and praise because both sides of the aisle could finally agree on something.
Suffice to say, only three days (Aug. 5, 2011) after the “bipartisan” agreement to raise the debt ceiling, Standard & Poor's lowered the credit rating of the United States indicating that “…the downgrade reflects our view that the effectiveness, stability, and predictability of American policymaking and political institutions have weakened at a time of ongoing fiscal and economic challenges to a degree more than we envisioned…” (PDF found here).
We wince when politics has to enter our discussion of the markets since we know that there are no winners when it comes to such a debate. However, we have reminded readers of the backdrop at the time of the Dow Theory bear market indication to suggest that we may actually be sitting on another “buy the rumor and sell the news” scenario when the resolution of the “fiscal cliff” arrives. From the May 3, 2011 to August 1, 2011, the Dow Jones Industrial Average declined –5.27% and from August 1, 2011 to August 10, 2011, the Dow Jones Industrial Average declined –11.64%. It appears the stock market anticipated that the debt ceiling would be increased and that ultimately it would be to no avail, resulting in the downgrade from S&P.
Already, the Dow Jones Industrial Average has declined –7.5% from the October 5, 2012 high. Are we slated for a similar reaction to the ultimate “resolution” of the “fiscal cliff” that currently overhangs the U.S.? It is interesting to note that the increase of the debt ceiling and the “resolution” of the “fiscal cliff” will have a negative effect on the U.S. despite the two political parties’ shameless self-promotion for acting in a bi-partisan manner to come to a “resolution.” If the S&P downgrade of the U.S. came 3 days after the agreement to raise the debt ceiling and a stock market plunge of –11% in seven trading days later, what can we expect when the “fiscal cliff” passes?
Also, keep in mind that with the announcement of QE3 on September 13, 2012, the stock market has declined as much as -7.02%. All prior announcements of quantitative easing by the U.S. and European Union were not accompanied with almost immediate declines in the stock market. It appears that the quick fixes are having less of the desired short-term impact since it is clear that the long-term effects of such strategies are harmful and possibly irreversible. Our article on the diminished impact of QE3 can be found here.
We can’t be sure if the past provides any lessons, however, the solution to the “fiscal cliff” may lead to an outcome that is far worse than anticipated. While everyone in Congress was suggesting that there were going to be dire consequences to not raising the debt ceiling there were few that anticipated that the S&P would downgrade the debt anyway. Likewise, providing a solution to the “fiscal cliff” cannot hid the fact that the U.S. is a house that is not in order. Resolving issues like the debt ceiling with increasing the debt “limit” or the “fiscal cliff” with less cutting and more spending than initially planned, with politicians whose goal is to posture until the 11th hour, suggests that S&P’s downgrade of the U.S. debt will be looked upon in retrospect as an understatement.
Dow Theory: Bear Market Confirmation Due
Starting with the movement of the Dow Industrials and Transports, we can seen that the primary bear market began on August 2, 2011. Since that time, the bear market rally (from the August 8, 2011 or October 3, 2011 low) has been very rewarding to anyone who followed our August 9, 2011 (found here) indication that a temporary bottom had been reached.
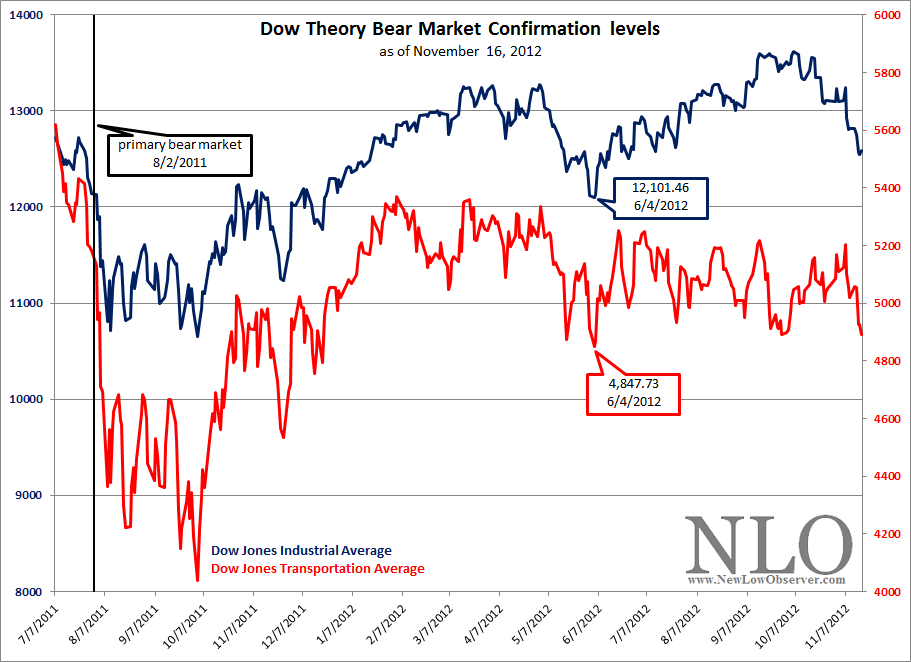
Now that there has been a substantive decline in the Industrial Average below the April 30, 2012 peak we can see that any decline below the June 4, 2012 low is the level to watch for. Again, Dow Theory indicates that for any signal to have merit, both the Industrials and Transports must simultaneously rise above prior peaks or decline below prior troughs. In order for us to get a bear market confirmation, we’d need the Industrials to decline below 12,101.46 and the Transports to fall below 4,847.73 on a closing basis.
So far, the Industrials are +4.02% above the June 4th low while the Transports are +0.90% above the mid-year level. If either of the indexes fail to fall below the June 4th level we have to put our bear market thesis on hold.
Dow Industrial Upside Targets
The decline that the Dow Jones Industrial Average has experienced isn’t out of the ordinary. However, it is our responsibility to review the prospects of an upside target based on Dow Theory. Taking the most recent intra-day low of 12,471.50 and projecting to the most recent intra-day high of 13,661.90 provides us with the following upside targets:
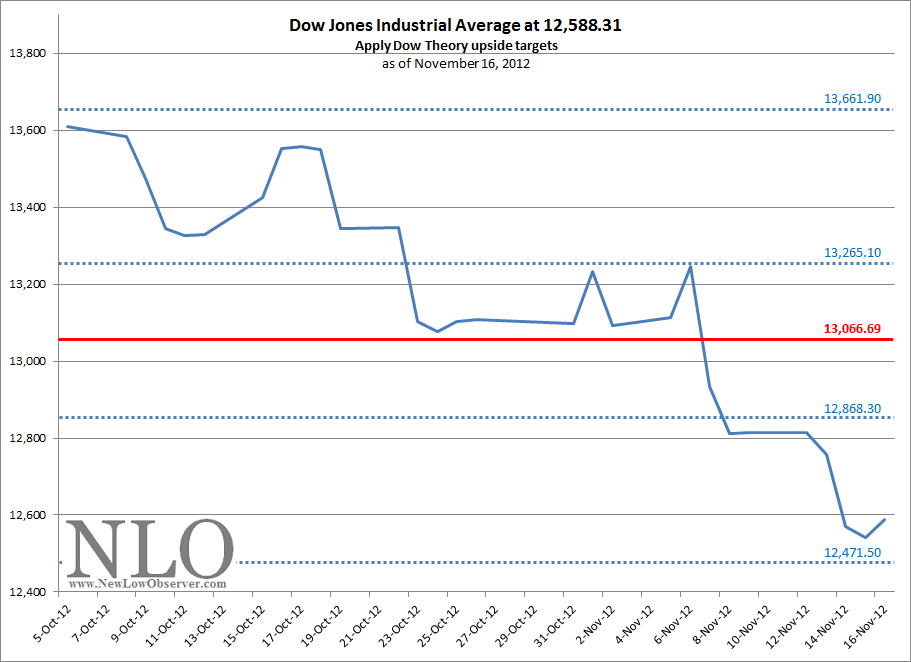
Each move up to the 13,066.69 level carries the risk that at any point the market can easily descend below the 12,471.50. However, exceeding 13,066.69 and especially the points above the 13,265.10 connotes the prospect that the Dow Industrials can achieve 13,661.90.
Nasdaq 100 Watch List: November 16, 2012
Below are the Nasdaq 100 companies that are within 10% of their respective 52-week lows. Stocks that appear on our watch lists are not recommendations to buy. Instead, they are the starting point for doing your research and determining the best company to buy. Ideally, a stock that is purchased from this list is done after a considerable decline in the price and rigorous due diligence.
| Symbol | Name | Price | P/E | EPS | Yield | P/B | % from low |
| BIDU | Baidu, Inc. | 92.68 | 20.97 | 4.42 | - | 8.87 | 0.95% |
| VOD | Vodafone Group | 25.27 | - | -0.55 | 7.9 | 1.11 | 1.28% |
| BBBY | Bed Bath & Beyond Inc. | 56.4 | 13.1 | 4.3 | - | 3.27 | 1.48% |
| MCHP | Microchip Technology Inc. | 29.37 | 27.94 | 1.05 | 4.8 | 2.93 | 1.56% |
| ^NDX | NASDAQ-100 | 2,534.16 | - | - | - | - | 1.59% |
| FLEX | Flextronics Int’l | 5.54 | 7.55 | 0.73 | - | 1.51 | 1.65% |
| DELL | Dell Inc. | 8.86 | 6.03 | 1.47 | 3.3 | 1.63 | 1.94% |
| AMAT | Applied Materials Inc. | 10.15 | 118.02 | 0.09 | 3.5 | 1.74 | 2.01% |
| NVDA | NVIDIA Corporation | 11.38 | 14.21 | 0.8 | 2.6 | 1.53 | 2.06% |
| INTC | Intel Corporation | 20.19 | 8.81 | 2.29 | 4.5 | 2.03 | 2.12% |
| ALTR | Altera Corp. | 30.45 | 17.02 | 1.79 | 1.3 | 2.97 | 2.91% |
| TEVA | Teva Pharmaceutical | 38.29 | 15.6 | 2.45 | 2.1 | 1.46 | 3.82% |
| EXPD | Expeditors Int'l of WA | 35.76 | 22.35 | 1.6 | 1.5 | 3.62 | 4.56% |
| CTXS | Citrix Systems, Inc. | 59.21 | 32.34 | 1.83 | - | 3.56 | 4.67% |
| MRVL | Marvell Technology | 7.4 | 12.67 | 0.58 | 3.2 | 0.88 | 4.96% |
| NUAN | Nuance Communications | 20.35 | 77.38 | 0.26 | - | 2.4 | 5.28% |
| KLAC | KLA-Tencor Corporation | 44.33 | 10.78 | 4.11 | 3.6 | 2.18 | 5.35% |
| APOL | Apollo Group Inc. | 19.51 | 5.61 | 3.48 | - | 2.37 | 5.69% |
| ATVI | Activision Blizzard, Inc. | 11.05 | 14.26 | 0.78 | 1.7 | 1.08 | 5.75% |
| MU | Micron Technology Inc. | 5.47 | - | -1.04 | - | 0.72 | 6.01% |
| FFIV | F5 Networks, Inc. | 86.64 | 25.11 | 3.45 | - | 5.19 | 6.87% |
| WCRX | Warner Chilcott plc | 11.98 | 8.2 | 1.46 | 4.2 | -4.48 | 6.87% |
| CHKP | Check Point Software | 43.67 | 15.21 | 2.87 | - | 2.71 | 7.56% |
| DLTR | Dollar Tree, Inc. | 38.82 | 15.6 | 2.49 | - | 5.9 | 7.71% |
| GRMN | Garmin Ltd. | 37.18 | 12.57 | 2.96 | 4.8 | 2.14 | 8.05% |
| XLNX | Xilinx Inc. | 32.56 | 17.6 | 1.85 | 2.7 | 3.12 | 8.53% |
| FAST | Fastenal Company | 41 | 29.71 | 1.38 | 2.1 | 7.29 | 9.01% |
| MSFT | Microsoft Corporation | 26.52 | 14.34 | 1.85 | 3.5 | 3.26 | 9.14% |
Watch List Summary
In the November 2, 2012 Watch List summary we pointed out NetApp (NTAP) as a viable investment candidate. In the two weeks since, NTAP has managed to rise +9% while the Nasdaq 100 and Apple Inc. declined –4% and –9%, respectively. NTAP is sitting at $30.26 price and may have found some support at that level. Although we’re hopeful about the prospects of this company, we recommend putting +9% gains in two weeks into perspective and decide if selling the principle is the most prudent approach to take.
On the November 2, 2012, we discussed the prospects for Dell (DELL). At the time we felt that the stock had a high probability of going back to the $8 level. On Friday November 16, 2012, we believe that DELL has fallen through the last line of technical defense against going to the $8 level. We believe that on a short-term basis DELL will rise on a possible market reaction. However, the intermediate-term seems to indicate that DELL will go to $8 before any “true” indication of prospects is revealed, unless the company gets acquired which seems possible. Dell would be one of the best acquistion target of any computer manufacturer since Lenovo bought the personal computer division from IBM.
Apple Inc (AAPL) and short-term Dow Theory analysis
As described in our last Nasdaq 100 Watch List dated November 2, 2012, Apple Inc. (AAPL) is the stock to watch. Right now, there are many who are suggesting that the bottom is in for AAPL. For various reasons, we believe that the verdict has not been delivered on this stock. Especially since AAPL managed to close below the May 2012 low, a previous technical low point for the stock. Regardless of our view on the matter, we’d like to see what Dow Theory has to say about the upside prospects from the current price. The chart below outlines the four upside targets for AAPL.
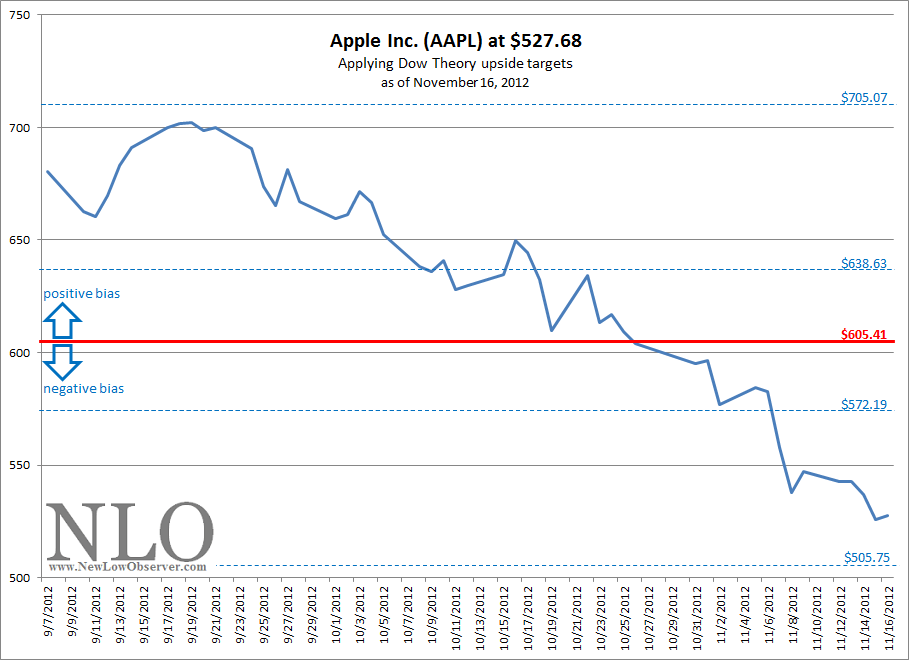
Starting with the first upside target is the $572.19 level. This is an easily attainable level for the stock and would equal an +8.44% gain from the closing price of Friday November 16, 2012. After coming off of such a dramatic decline that was started on September 17th, we should expect this as the minimum reaction of a declining trend. There is little in the way to suggest that AAPL is clearly on the ascent when it reaches $572.19. However, in theory, this would be the easiest money every made in AAPL stock.
The next upside target for Apple Inc. (AAPL) is $605.41. This level is based on Dow’s 50% principle which indicates the average price paid by long-term investors and would be compelled to continue holding the stock if it rises above this level. If AAPL can manage to rise above this level then long-term investors are likely to hold their positions in the stock, leaving speculators to push the stock higher. However, failure to rise above the $605.41 level and falling below the $505 level will be confirmation that the trend of the stock is much lower than the $505 level.
The $638.63 price falls in line with Dow’s assertion that stocks then can retrace 1/3 to 5/8 of the previous move. In this case, the $638 level is 2/3 of the previous decline. Rising to such a level almost assures that the stock will rise to the previous high. However, those wishing to take advantage of such a “guaranteed” move to the upside should be aware of the risk that any gains that are achieved can be quickly taken away. This would be the hardest money ever made for any speculator in AAPL’s stock.
Finally, rising above the $705 level would be the only indication that the stock is going higher in a meaningful fashion. We believe that if AAPL manages to exceed prior high then there are great opportunities of other tech companies near a new 52-week low to take advantage of the renewed faith in Apple Inc.
Posted in 50% principle, Dow Theory, Nasdaq 100 Watch List, upside target
Tagged members
Canadian Dividend Watch List: November 15, 2012
This is a list of Canadian dividend stocks that currently, or in the past, had a history of consecutive annual dividend increases. For those wishing to find the most complete fundamental information on these companies, we recommend visiting one of Canada’s leading financial websites, the Financial Post (found here). However, Yahoo!Finance probably has the better long-term charts and historical dividend data.
| symbol | Name | Price | P/E | EPS | Yield | P/B | % from low |
| CCO.TO | Cameco Corp. | 16.73 | 13.6 | 1.23 | 2.40% | 1.34 | 1.09% |
| AGF-B.TO | AGF Management Limited | 9.13 | 14.27 | 0.73 | 11.60% | 0.78 | 1.22% |
| TIH.TO | Toromont Industries Ltd. | 19.19 | 13.42 | 1.42 | 2.40% | 3.4 | 3.12% |
| EMP-A.TO | Empire Company Limited | 55.24 | 10.46 | 5.28 | 1.70% | 1.11 | 3.35% |
| FTS.TO | Fortis Inc. | 32.78 | 19.4 | 1.66 | 3.60% | 1.59 | 4.66% |
| TRI.TO | Thomson Reuters Corporation | 27.39 | 0 | -1.07 | 4.70% | 1.33 | 4.94% |
| FFH.TO | FAIRFAX FINANCIAL HOLDINGS LTD. | 354.22 | 0 | 0 | 2.70% | 0 | 5.74% |
| IGM.TO | IGM Financial Inc. | 38.98 | 11.81 | 3.08 | 5.50% | 2.31 | 5.90% |
| GS.TO | Gluskin Sheff + Associates, Inc. | 13.95 | 23.25 | 0.61 | 5.00% | 5.55 | 5.92% |
| CNQ.TO | Canadian Natural Resources Limited | 27.58 | 10.65 | 2.16 | 1.50% | 1.27 | 7.82% |
| PWF.TO | Power Financial Corporation | 25.56 | 10.48 | 2.43 | 5.40% | 1.55 | 8.21% |
| EMA.TO | Emera Inc. | 33.7 | 18.93 | 1.78 | 4.10% | 2.72 | 8.64% |
| FTT.TO | Finning International Inc. | 22.13 | 12.57 | 1.76 | 2.50% | 2.69 | 8.85% |
| CCA.TO | Cogeco Cable Inc. | 37.58 | 8.13 | 4.59 | 1.70% | 1.57 | 9.09% |
| CTC-A.TO | Canadian Tire Corp. Ltd. | 66.39 | 10.76 | 6.14 | 2.10% | 1.19 | 9.48% |
| CU.TO | Canadian Utilities Ltd. | 64.61 | 15.38 | 4.19 | 2.70% | 2.63 | 9.51% |
| ESI.TO | Ensign Energy Services Inc. | 14.13 | 9.74 | 1.45 | 3.10% | 1.2 | 9.62% |
| TRP.TO | TransCanada Corp. | 44.25 | 22.69 | 1.94 | 4.00% | 1.98 | 9.77% |
Analyst Low Earnings Estimate for 2013
| symbol | Name | 2013 low EPS est. | # of analysts | est. 2013 price | est. 2013 % change |
| GS.TO | Gluskin Sheff + Associates, Inc. | $0.76 | 9 | $17.67 | 26.94% |
| FTT.TO | Finning International Inc. | $2.03 | 12 | $25.52 | 14.58% |
| TRP.TO | TransCanada Corp. | $2.19 | 10 | $49.69 | 12.22% |
| FTS.TO | Fortis Inc. | $1.75 | 7 | $33.95 | 4.24% |
| CU.TO | Canadian Utilities Ltd. | $4.16 | 4 | $63.98 | 1.00% |
| EMA.TO | Emera Inc. | $1.77 | 6 | $33.51 | -0.28% |
| PWF.TO | Power Financial Corporation | $2.21 | 7 | $23.16 | -9.42% |
| IGM.TO | IGM Financial Inc. | $2.91 | 9 | $34.37 | -11.81% |
| TIH.TO | Toromont Industries Ltd. | $1.26 | 8 | $16.91 | -12.16% |
| CCA.TO | Cogeco Cable Inc. | $4.03 | 6 | $32.76 | -12.72% |
| ESI.TO | Ensign Energy Services Inc. | $1.12 | 10 | $10.91 | -22.02% |
| CCO.TO | Cameco Corp. | $0.96 | 12 | $13.06 | -22.05% |
| CNQ.TO | Canadian Natural Resources | $1.86 | 10 | $19.81 | -27.63% |
Watch List Summary
As can be seen above, only five companies on our watch list are slated to have higher earnings in the coming year, under the assumption that the stocks retain the same P/E ratio that they currently have right now. An alternative view is that if the earnings expectation improve, these same companies could potentially match or exceed expectations. This could mean that the stocks slated to decline in price might have the most potential to increase in value.
Gold Stock Indicator: Buy Indication Arrives with Surprising Plunge
On November 14, 2012, our Gold Stock Indicator (GSI) plunged below both the short and long-term buy indications. The arrival of a buy indication at this point has come five trading days earlier than we anticipated as indicated in our November 10, 2012 (found here).
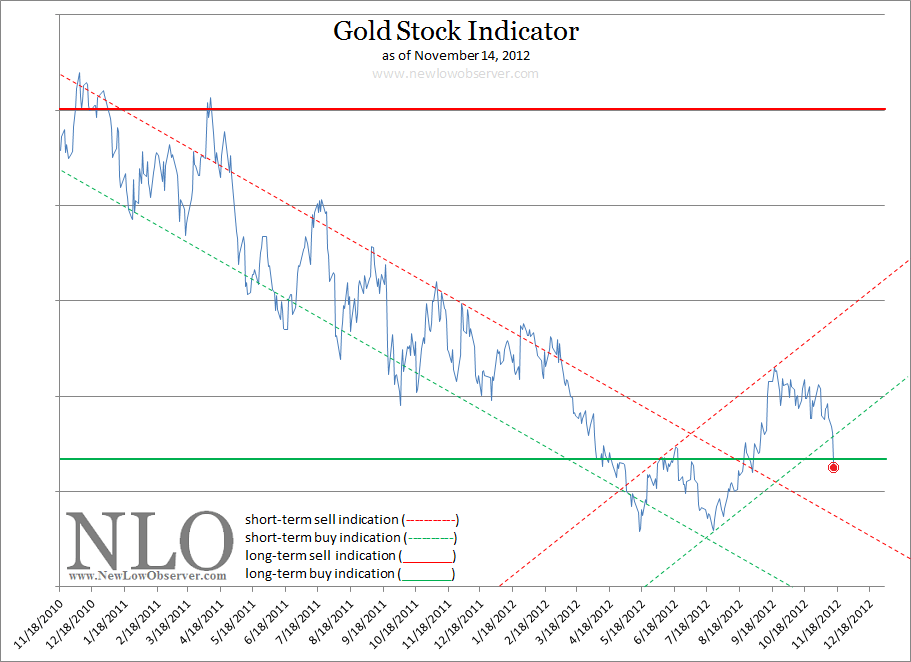
The first time that the long-term buy indication was triggered on the Gold Stock Indicator (GSI) was on May 3, 2012. At that time, the Philadelphia Gold and Silver Stock Index (XAU) closed at 156.72. The XAU index declined another -9.64% before hitting bottom on May 15, 2012. If an speculator bought the gold stock ETF Market Vectors Gold Miners (GDX) on May 3rd, the speculator would have seen gains of +25% by September 21, 2012. This matched the performance of the XAU gold stock index in the exact same period of time.
The next instance of the Gold Stock Indicator (GSI) falling below the long-term buy indication was on June 21, 2012 when the XAU index was at 157.04. The XAU index finally bottomed at 143.11 or -8.88% below the point that was triggered on the GSI. If a speculator had bought the gold stock ETF Market Vectors Gold Miners (GDX) on June 21st the speculator would have seen gains of +23% by September 21, 2012. This was just short of the performance of the XAU gold stock index gain of +25 in the same period of time.
We no longer recommend or suggest that NUGT or DUST is used to take advantage of the expected speculative opportunity in gold stocks as we had difficulty stomaching the wild volatility that came with such products. We strongly recommend setting parameters around what you wish to get out of your speculation in the gold sector, whether through the use of individual gold stocks or gold & silver stock ETFs. This means that if you can get an exceptional return in a reasonably short period of time then take the gain. As we have a minimum +10% target for our more conservative dividend and insurance stocks before we consider selling within a year, we recommend having a +20% target for gold stock investments.
Again, we expect another -8% to -10% decline in the XAU index before we reassess the market conditions for any new investments in the gold sector.
Transaction Alert: Sold MKL at the Market
Today we sold the principal portion in shares of Markel (MKL).
- On May 7, 2012, we posted a transaction alert indicating that we bought Markel (MKL) at the market (found here). The gain has been +10.29% in six months. The annualized rate of return is nearly 22.83%.
We continue to hold shares of the company (profit portion) allowing us to slowly build a well diversified portfolio and continue to see capital appreciation.