
- Japan
- Market Indicator
- Price Momentum Indicators
- Richard Russell
- Silver
- Speed Resistance Lines
- U.S. Dividend Watch List
Author Archives: nlo-admin
Nasdaq 100 Watch List: December 24, 2012
Below are the Nasdaq 100 companies that are within 10% of their respective 52-week lows. Stocks that appear on our watch lists are not recommendations to buy. Instead, they are the starting point for doing your research and determining the best company to buy. Ideally, a stock that is purchased from this list is done after a considerable decline in the price and rigorous due diligence.
| Symbol | Name | Price | P/E | EPS | Yield | P/B | % from low |
| VOD | Vodafone Group Public Limited Company | 25.12 | - | -0.55 | 4.1 | 1.11 | 0.68% |
| TEVA | Teva Pharmaceutical Industries Limited | 37.79 | 15.4 | 2.45 | 2.1 | 1.44 | 1.04% |
| ATVI | Activision Blizzard, Inc. | 10.68 | 13.78 | 0.78 | 1.7 | 1.09 | 2.20% |
| BBBY | Bed Bath & Beyond Inc. | 55.66 | 12.71 | 4.38 | - | 3.13 | 2.45% |
| MSFT | Microsoft Corporation | 27.06 | 14.63 | 1.85 | 3.4 | 3.36 | 5.05% |
| SPLS | Staples, Inc. | 11.28 | - | -0.01 | 3.8 | 1.26 | 6.72% |
| INTC | Intel Corporation | 20.64 | 9 | 2.29 | 4.3 | 2.1 | 7.33% |
| DLTR | Dollar Tree, Inc. | 40.05 | 16.09 | 2.49 | - | 5.91 | 7.89% |
| PAYX | Paychex, Inc. | 31.5 | 20.45 | 1.54 | 4.2 | 6.73 | 8.17% |
| NVDA | NVIDIA Corporation | 12.25 | 15.29 | 0.8 | 2.4 | 1.63 | 9.87% |
| ^NDX | NASDAQ-100 | 2,658.05 | - | - | - | - | 17.50% |
Watch List Summary
The last time that Vodafone (VOD) was this close to the low and on our watch list was September 9, 2011 (found here). At the time, our data indicated that Vodafone had a dividend yield of 7.30% and a price to book ratio of 1.01. In two months VOD rose +12% and after two years, the highest VOD was able to rise was $30 or nearly 17% from the Sept 2011 low. For us, this is an indication to be mindful of the fact that high dividend yields are not necessarily the clearest path to exception gains, unless in some cases the investor has the willingness to accept the 10% achieved within 2 months.

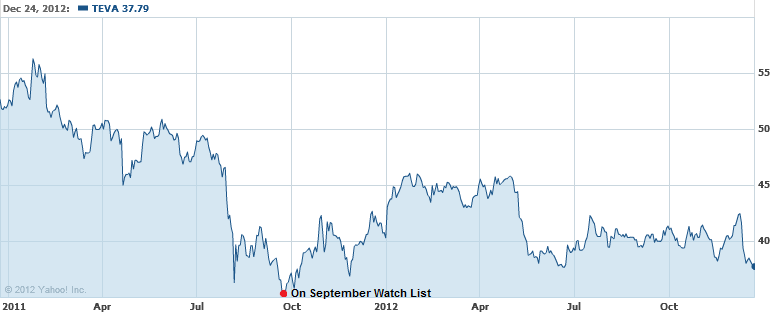
Teva Pharmaceutical (TEVA) was on the watch list on September 23, 2011 (found here) when the stock was trading at $35.26. At its highest point in January 2012, TEVA increased +30% from the September 2011 low. However, since the January 2012 high, TEVA has fallen –18% to the current price of $37.79 or +7.18% above the price of September 23, 2011. On September 23, 2011, TEVA sported a dividend yield of 2.10% and a P/E ratio of 10.08. Now, TEVA has a P/E of 15.4 and a dividend yield of 2.10%.
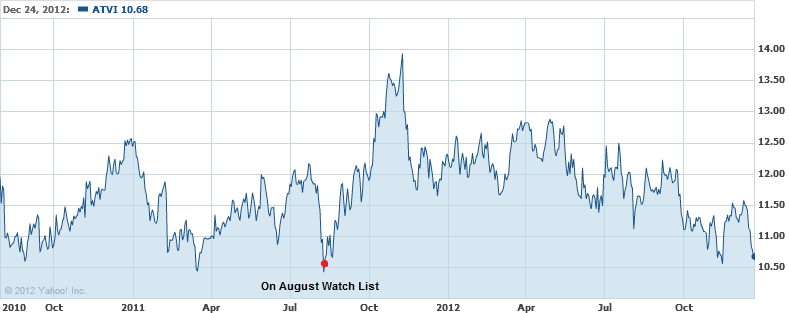
Activision Blizzard (ATVI) was on the watch list on August 12, 2011 (found here) when the stock was trading at $10.71. No sooner than ATVI was on our list that it rose +30% to the November 8, 2011 high. ATVI is now selling at the same price as August 2011, however, the stock has a lower P/E ratio and a lower P/B ratio. If we suppose that the stock has not moved up at all in the last year, this could be considered an undervalued stock.
As is often the case with most stocks, early gains are offset with declines, at least in the first year, which explains why we’re so focused on the 52-week low. Most stocks seem to run in cycles of 1 to 2 years. Stocks that fall to a new low after one year should be at or below the price from the prior year. Stocks that fall to a new low after 2 years could be significantly above the low of two years prior but a 52-week low.
Watch List Performance Review
In our ongoing review of the Nasdaq 100 Watch List, we have taken the stocks from our list of December 16, 2011 (found here) and have checked their performance one year later. The companies on that list are provided below with the closing prices from December 16, 2011 to December 14, 2012.
|
Symbol
|
Name |
2011 | 2012 | % change |
| BMC | BMC Software, Inc. | 33.17 | 40.18 | 21.13% |
| VMED | Virgin Media Inc. | 20.95 | 36.07 | 72.17% |
| CTRP | Ctrip.com International, Ltd. | 23.1 | 21.15 | -8.44% |
| SYMC | Symantec Corporation | 15.46 | 18.68 | 20.83% |
| BRCM | Broadcom Corporation | 28.72 | 32.06 | 11.63% |
| Average | 23.46% | |||
| NDX | Nasdaq 100 | 2,238.18 | 2,658.05 | 18.76% |
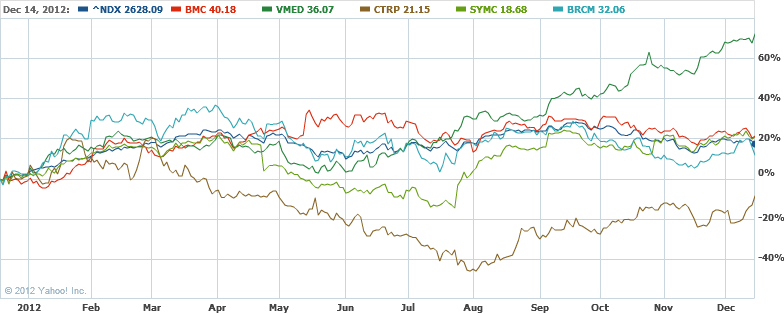
The performance of the top five stocks from the December 16, 2011 watch list was reasonable. However, despite the outcome after a year, all five of the stocks achieved +20% gains within the first three months.
U.S. Dividend Watch List: December 21, 2012
Below are the 40 companies on our U.S. Dividend Watch List that are within 11% of their respective 52-week lows. Stocks that appear on our watch lists are not recommendations to buy. Instead, they are the starting point for doing your research and determining the best company to buy. Ideally, a stock that is purchased from this list is done after a considerable decline in the price and rigorous due diligence.
| Symbol | Name | Price | % Yr Low | P/E | EPS (ttm) | Dividend | Yield | Payout Ratio |
| SON | Sonoco Products Co. | 29.65 | 3.64% | 16.66 | 1.78 | 1.20 | 4.05% | 67% |
| NJR | New Jersey Resources | 39.97 | 3.79% | 17.92 | 2.23 | 1.60 | 4.00% | 72% |
| FDS | FactSet Research | 88.63 | 3.81% | 20.90 | 4.24 | 1.24 | 1.40% | 29% |
| CFR | Cullen/Frost Bankers | 54.76 | 4.32% | 14.49 | 3.78 | 1.92 | 3.51% | 51% |
| ED | Consolidated Edison | 56.05 | 4.51% | 14.71 | 3.81 | 2.42 | 4.32% | 64% |
| TEG | Integrys Energy Group | 53.26 | 4.84% | 16.80 | 3.17 | 2.72 | 5.11% | 86% |
| ANAT | American Nat'l Insurance | 67.00 | 5.21% | 9.82 | 6.82 | 3.08 | 4.60% | 45% |
| WABC | Westamerica BanCorp. | 42.79 | 5.65% | 14.26 | 3.00 | 1.48 | 3.46% | 49% |
| ATR | AptarGroup Inc. | 47.76 | 5.69% | 19.65 | 2.43 | 0.88 | 1.84% | 36% |
| OMI | Owens & Minor | 28.51 | 5.71% | 16.67 | 1.71 | 0.88 | 3.09% | 51% |
| PRK | Park National Corp. | 64.29 | 5.74% | 14.58 | 4.41 | 3.76 | 5.85% | 85% |
| SCG | SCANA Corporation | 46.22 | 6.69% | 14.86 | 3.11 | 1.98 | 4.28% | 64% |
| WEYS | Weyco Group | 23.49 | 6.72% | 15.25 | 1.54 | 0.68 | 2.89% | 44% |
| UBSI | United Bankshares | 24.10 | 6.92% | 14.88 | 1.62 | 1.24 | 5.15% | 77% |
| DCI | Donaldson | 32.85 | 7.67% | 20.03 | 1.64 | 0.36 | 1.10% | 22% |
| CBU | Community Bank System | 27.38 | 7.88% | 13.90 | 1.97 | 1.08 | 3.94% | 55% |
| INTC | Intel Corp. | 20.77 | 7.98% | 9.07 | 2.29 | 0.90 | 4.33% | 39% |
| CWT | California Water Service | 18.19 | 8.02% | 16.69 | 1.09 | 0.63 | 3.46% | 58% |
| MCD | McDonald's Corp. | 90.18 | 8.25% | 16.98 | 5.31 | 3.08 | 3.42% | 58% |
| VVC | Vectren Corp. | 29.74 | 8.30% | 15.02 | 1.98 | 1.42 | 4.77% | 72% |
| BOH | Bank of Hawaii Corp. | 44.87 | 8.36% | 12.40 | 3.62 | 1.80 | 4.01% | 50% |
| PPL | PP&L Corporation | 28.92 | 8.40% | 10.40 | 2.78 | 1.44 | 4.98% | 52% |
| TRMK | Trustmark Corp. | 22.53 | 8.53% | 12.87 | 1.75 | 0.92 | 4.08% | 53% |
| PX | Praxair, Inc. | 108.66 | 8.66% | 19.37 | 5.61 | 2.20 | 2.02% | 39% |
| JW-A | John Wiley & Sons | 38.77 | 8.84% | 12.23 | 3.17 | 0.80 | 2.06% | 25% |
| ETP | Energy Transfer Partners | 43.82 | 9.03% | 10.07 | 4.35 | 3.58 | 8.17% | 82% |
| IBM | IBM | 193.42 | 9.06% | 13.91 | 13.91 | 3.40 | 1.76% | 24% |
| YUM | Yum! Brands | 63.88 | 9.38% | 18.79 | 3.40 | 1.34 | 2.10% | 39% |
| AJG | Arthur J Gallagher | 35.07 | 9.56% | 20.88 | 1.68 | 1.36 | 3.88% | 81% |
| SYBT | S.Y. BanCorp. | 22.26 | 9.98% | 12.10 | 1.84 | 0.80 | 3.59% | 43% |
| MSEX | Middlesex Water | 19.26 | 10.18% | 22.40 | 0.86 | 0.75 | 3.89% | 87% |
| BDX | Becton, Dickinson | 78.86 | 10.20% | 14.11 | 5.59 | 1.98 | 2.51% | 35% |
| RBCAA | Republic BanCorp. | 21.56 | 10.22% | 3.81 | 5.66 | 0.66 | 3.06% | 12% |
| NWN | Northwest Natural Gas | 45.25 | 10.34% | 20.02 | 2.26 | 1.82 | 4.02% | 81% |
| CTBI | Comm. Trust BanCorp | 32.19 | 10.50% | 11.29 | 2.85 | 1.26 | 3.91% | 44% |
| AROW | Arrow Financial Corp. | 24.99 | 10.59% | 13.66 | 1.83 | 1.00 | 4.00% | 55% |
| CLC | Clarcor Inc. | 47.29 | 10.62% | 19.46 | 2.43 | 0.54 | 1.14% | 22% |
| WGL | WGL Holdings | 39.79 | 10.65% | 14.68 | 2.71 | 1.60 | 4.02% | 59% |
| APD | Air Products & Chemicals | 84.28 | 10.73% | 15.49 | 5.44 | 2.56 | 3.04% | 47% |
| KO | Coca-Cola Co | 36.89 | 10.83% | 19.31 | 1.91 | 1.02 | 2.76% | 53% |
| 40 Companies | ||||||||
Watch List Review
The 100+ year industrial and consumer packaging product company, Sonoco (SON), topped our list for the first time. Sonoc lowered its 3rd quarter guidance by -19% citing weaker demand in consumer and industrial packaging. The firm is also struggling with inconsistent operations at their uncoated recycled paperboard mills. Despite slowing growth, the dividend remains their top priority. Analysts estimates earnings to rise in 2013 from $2.19 to $2.31. The current dividend yield of 4% and payout ratio of 67% is an attractive combination. Sonoco's acquisition of Tegrant could become an additional growth driver.
There are 2 utility companies in our top five, New Jersey Resources (NJR) and Consolidated Edison (ED). While the shares remain very close to the 52-week low, we feel that income oriented investors have moved into these names prematurely and are pushing the yields lower than they typically would be at the bottom of a utility cycle. While the 4% yield and forecasted low Fed fund rate makes these names attractive, we would opt for more growth from other sectors such as medical equipment and/or semiconductor.
FactSet Research (FDS) lands on the third spot this week. The company reported 1Q EPS that was above Wall Street expectations and yet the shares traded down. The 1Q EPS came in at $1.14 compared to the consensus estimate of $1.10. The top line grew 7.5% from the prior year, including contribution of StreetAccount. The U.S. revenue grew 7% year-over-year and non-U.S. revenue rose even higher at 8.3%. Despite the good news, Wall Street may not be happy with FDS' shrinking margins which came in at 33.7% versus 34.0%. The biggest contribution to the declining margins came from absorption of StreetAccount employees and rising headcount. Income investors may look past their 1.4% yield but the firm’s dividend yield rarely reach 1%. At the bottom of 2008/2009 market, the yield topped 1.6%.
Top Five Performance Review
In our ongoing review of the NLO Dividend Watch List, we have taken the top five stocks on our list from December 23, 2011 and have check their performance one year later. The top five companies on that list can be seen in the table below.
| Symbol | Name | 2011 Price | 2012 Price | % change |
| TR | Tootsie Roll Industries Inc | 23.74 | 26.93 | 13.44% |
| BMO | Bank of Montreal | 54.40 | 61.42 | 12.90% |
| JW-A | John Wiley & Sons Inc. | 43.99 | 38.77 | -11.87% |
| BCR | CR Bard, Inc. | 85.12 | 98.18 | 15.34% |
| FRS | Frisch's Restaurants, Inc | 19.50 | 18.11 | -7.13% |
| Average | 4.54% | |||
| DJI | Dow Jones Industrial | 11,871.84 | 13,190.84 | 11.11% |
| SPX | S&P 500 | 1,283.35 | 1,430.15 | 11.44% |
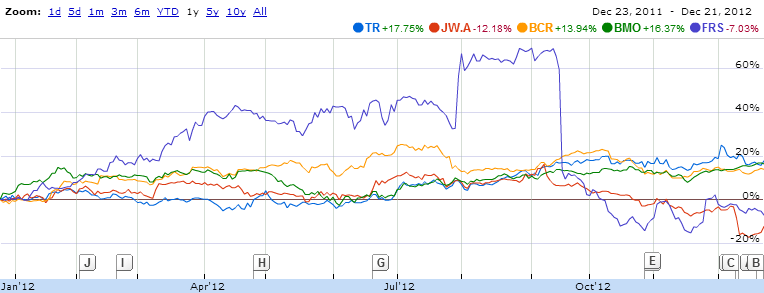
Our watch list performance didn’t keep up with the gains in the market due to major declines in John Wiley (JW-A) and Frisch’s Restaurant (FRS). However, all of the top 5 companies were able to achieve 15% gains in less than a year. Frisch even topped most companies with a rise above 60% after the company announced 2 special dividend payments.
Comments Off on U.S. Dividend Watch List: December 21, 2012
Posted in NLO Dividend Watch List
What is Next for Herbalife (HLF)?
On May 2, 2012, Herbalife’s (HLF) stock price closed at $51.71. At that time, we ran Edson Gould’s Speed Resistance Lines [SRL] to determine what the potential downside price would be (found here). We determined that the conservative downside target was $45.45 and the extreme downside target was $24.33.
On December 21, 2012, Herbalife (HLF) has managed to exceed our expectations by falling through the conservative downside target of $45.45 and within 11% of the extreme downside target of $24.33 by closing at $27.27. The total decline since May 2, 2012 has been –47.26%.
Now we’re ready to re-examine what the prospects are for HLF based on the updated market activity.

At the current price of $27.27, HLF has fallen below the ascending extreme downside target of $24.33. This suggests that a $24.33 handle on this stock is almost guaranteed on an intra-day basis, at minimum.
After reaching the inevitable low in the current decline, we expect HLF to increase at least +30%. If $24.33 were the low, then rising to $31.63 would not be out of the question. This would be similar to the rise of the stock price from the May 2012 low to the late July 2012 high. However, rising above the ascending $34.89 line (now at $41; ± $3-$4) could be a point where the stock price could stall and then decline dramatically. In order for us to feel that the rise in HLF is sustainable, we’d like to see the stock rise, at minimum, above the $50.14 level based on Dow’s Theory.
Aside from declining to the $24.33 price, we’re concerned that if the $21.12 price is broken to the downside then HLF might retest the 2009 low of $6-$7 range. Because the single digit numbers are so extreme, we’d opt to split the difference and say that the potential downside target below $21.12 is $14.06.
Note: Any money committed to HLF, either long or short, should be considered a speculation. This piece is a continuation of the examination of Edson Gould’s speed resistance lines as explained in prior articles (found here). This is not an endorsement to sell short at the current levels nor buy these stocks once falling below the extreme downside targets.
Comments Off on What is Next for Herbalife (HLF)?
Posted in Edson Gould, HLF, SRL
Canadian Dividend Watch List: December 21, 2012
This is a list of Canadian dividend stocks that currently, or in the past, had a history of consecutive dividend increases. For those wishing to find the most complete fundamental information on these companies, we recommend visiting one of Canada’s leading financial websites, the Financial Post (found here). However, Yahoo!Finance probably has the better long-term charts and historical dividend data.
| Symbol | Name | Price | P/E | EPS | Yield | P/B | % from low |
| EMA.TO | Emera Inc. | 34.22 | 18.92 | 1.81 | 4.10% | 2.87 | 6.83% |
| FTS.TO | Fortis Inc. | 33.93 | 20.09 | 1.66 | 3.70% | 1.64 | 7.10% |
| FFH.TO | FAIRFAX FINANCIAL HOLDINGS LTD. | 359.24 | - | - | 2.80% | ∞ | 7.24% |
| IMO.TO | Imperial Oil Ltd. | 43.09 | 9.88 | 4.34 | 1.10% | 2.33 | 8.32% |
| TRI.TO | Thomson Reuters Corporation | 28.77 | - | -1.07 | 4.40% | 1.41 | 8.76% |
| EMP-A.TO | Empire Company Limited | 59.17 | 10.76 | 5.5 | 1.60% | 1.12 | 10.70% |
Watch List Summary
What happened to all of the companies on the watch list this month? Simply put, there were fewer companies within 10% of their 52-week low compared to the November 15, 2012 watch list (found here). So, what happened to the companies from the November 15th list? The table below tells the story:
|
symbol
|
Name | 15-Nov | 21-Dec | % change |
| CCO.TO | Cameco Corp. | 16.73 | 20.03 | 19.73% |
| AGF-B.TO | AGF Management Limited | 9.13 | 9.75 | 6.79% |
| TIH.TO | Toromont Industries Ltd. | 19.19 | 21.34 | 11.20% |
| IGM.TO | IGM Financial Inc. | 38.98 | 42.43 | 8.85% |
| GS.TO | Gluskin Sheff + Associates, Inc. | 13.95 | 14.84 | 6.38% |
| CNQ.TO | Canadian Natural Resources | 27.58 | 28.86 | 4.64% |
| PWF.TO | Power Financial Corporation | 25.56 | 27.39 | 7.16% |
| FTT.TO | Finning International Inc. | 22.13 | 24.46 | 10.53% |
| CCA.TO | Cogeco Cable Inc. | 37.58 | 39.13 | 4.12% |
| CTC-A.TO | Canadian Tire Corp. Ltd. | 66.39 | 70.02 | 5.47% |
| CU.TO | Canadian Utilities Ltd. | 64.61 | 70.9 | 9.74% |
| ESI.TO | Ensign Energy Services Inc. | 14.13 | 15.13 | 7.08% |
| TRP.TO | TransCanada Corp. | 44.25 | 47.35 | 7.01% |
| Average change since Nov. 15th | 8.36% |
The last month has been excellent for a majority of the companies that were on the November 15th Watch List. Of the companies that were on the watch list, the top half of the list gained an average of +9.60% with Cameco Corp. leading the way. The bottom half of the list gained an average of +7.30% with Cogeco Cable lagging behind all of the stocks. On the average, all of the stocks not on the list this month gained, as a group, +8.36%.
We prefer to concentrate our holdings at 10% of the portfolio and above. Afterwards, we like to take gains of +10% or more. Obviously, we would have missed the +9.73% gains that CCO.TO achieved after hitting the +10% gain mark. However, we’re very comfortable with consistent small gains that are above average annual market returns (approximately +11% annually for the last 50 years) and letting the profits run while reallocating the rest of the capital to other investment opportunities.
Gold Stock Indicator Update
Currently the gold stock indicator is below the long-term buy indication. This means that those who are interested in long-term holdings of gold stocks should be in an accumulation phase.
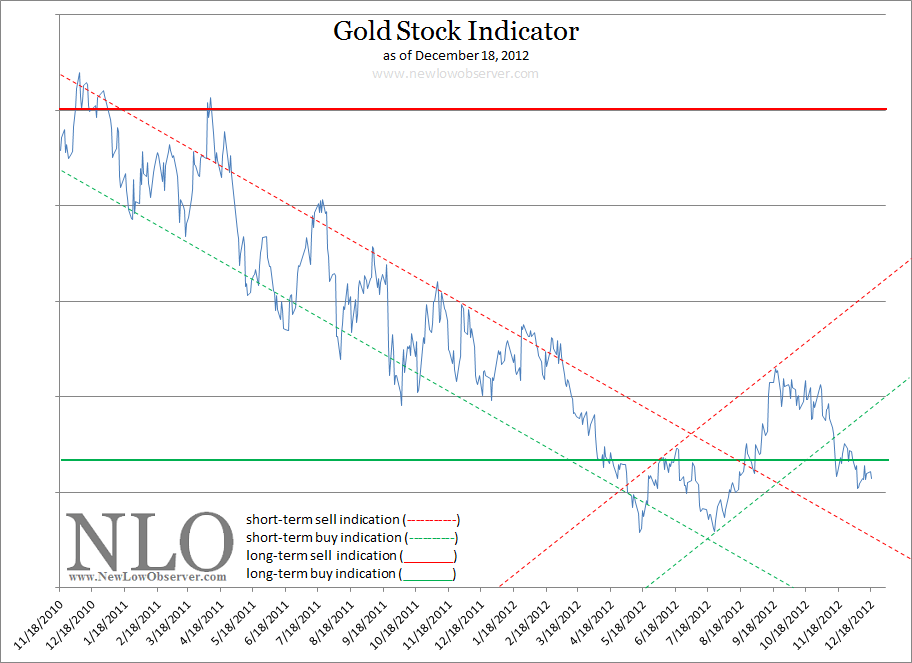
Naturally, we don’t know how much lower gold stocks can decline, however, from a historical perspective gold stocks are considered a buy at the current level and below.
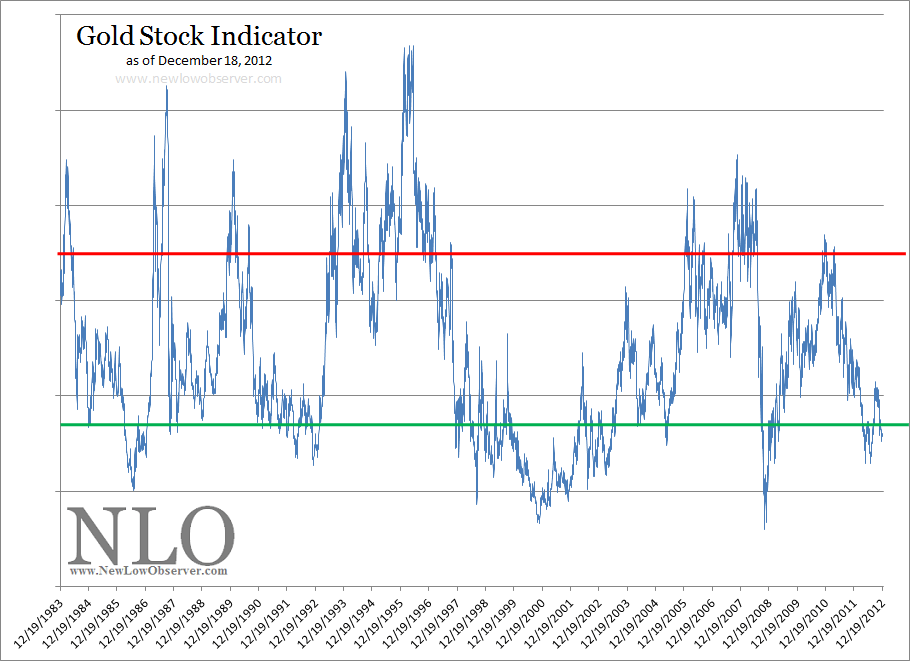
We believe that investors in gold stocks should build in at least -20% to -50% downside risk when buying gold stocks at the current level.
Comments Off on Gold Stock Indicator Update
Posted in Gold Stock Indicator
Apple’s Downside Targets Revised
Since our last article on Apple (AAPL), on April 14, 2012, and upon further review, it was revealed that our downside targets based on Edson Gould’s Speed Resistance Lines were actually too optimistic. Below is the revised downside targets:
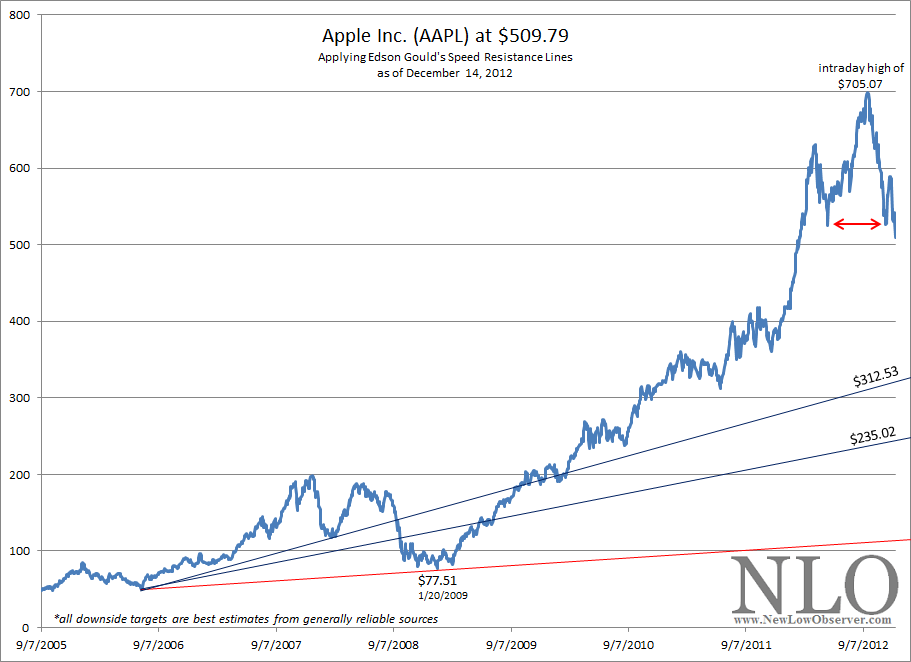
The revised conservative downside target is $312.53 while the extreme downside target is $235.02. Our previous downside target, from our April 14, 2012 posting (found here), was found to have errors in the $424.15 and $117.05 figures.
What stands out is the fact that Apple (AAPL) has declined significantly below the $530 support level (red arrows) that was initially established, retested and then violated to the downside. All that seems to remain on the downside, before the next support level, is at the $422 range.
The current revision suggests that there is a lot further to go on the downside. However, as Apple is no ordinary company neither is it an ordinary stock.
Comments Off on Apple’s Downside Targets Revised
Posted in AAPL
Nasdaq 100: 2012 Re-Rank Review
On December 14, 2012, the Nasdaq OMX Group announced the names of the companies that would be added and dropped from the Nasdaq 100 Index (found here). This year there were ten companies added and dropped.
The ten companies added in 2012 were:
| Symbol | Name | Price | P/E | EPS | Yield | P/B | % from low |
| ADI | Analog Devices, Inc. | 41.35 | 19.41 | 2.13 | 2.9 | 3 | 23.88% |
| CTRX | Catamaran Corporation | 49.2 | 72.04 | 0.68 | - | 2.21 | 77.23% |
| DISCA | Discovery Communications, Inc. | 60.82 | 22.23 | 2.74 | - | 3.54 | 54.64% |
| EQIX | Equinix, Inc. | 198.56 | 81.21 | 2.44 | - | 4.28 | 102.01% |
| LBTYA | Liberty Global Inc. | 60.31 | 74.64 | 0.81 | - | 5.58 | 55.84% |
| LMCA | Liberty Media Corporation | 110.5 | 7.65 | 14.45 | - | 2.03 | 49.14% |
| REGN | Regeneron Pharmaceuticals, Inc. | 179.71 | 83.39 | 2.16 | - | 21.11 | 242.63% |
| SBAC | SBA Communications Corp. | 69.62 | - | -1.36 | - | 19.09 | 76.79% |
| VRSK | Verisk Analytics, Inc. | 48.84 | 26.97 | 1.81 | - | 57.62 | 27.06% |
| WDC | Western Digital Corporation | 37.78 | 4.97 | 7.6 | 2.6 | 1.14 | 33.45% |
Another company that was added to the Nasdaq 100 Index was Facebook (FB). FB is acting as a replacement to the departure of Infosys (INFY) (WSJ article here) which is jumping ship from being a Nasdaq-listed company to a New York Stock Exchange-listed company.
The ten companies dropped in 2012 were:
| Symbol | Name | Price | P/E | EPS | Yield | P/B | % from low |
| APOL | Apollo Group Inc. | 21.02 | 6.05 | 3.48 | - | 2.59 | 14.49% |
| EA | Electronic Arts Inc. | 15.3 | 332.61 | 0.05 | - | 2.21 | 42.06% |
| FLEX | Flextronics International Ltd. | 6.09 | 8.3 | 0.73 | - | 1.65 | 11.33% |
| GMCR | Green Mountain Coffee Roasters Inc. | 40.32 | 17.68 | 2.28 | - | 2.7 | 135.65% |
| LRCX | Lam Research Corporation | 36.37 | 50.51 | 0.72 | - | 1.27 | 16.68% |
| MRVL | Marvell Technology Group Ltd. | 8.21 | 14.06 | 0.58 | 2.9 | 0.95 | 16.45% |
| NFLX | Netflix, Inc. | 93.3 | 120.39 | 0.78 | - | 7.17 | 76.67% |
| RIMM | Research In Motion Limited | 14.04 | 0 | -1.17 | - | 0.76 | 125.72% |
| VRSN | VeriSign, Inc. | 35.9 | 21.92 | 1.64 | 0 | -209.82 | 9.42% |
| WCRX | Warner Chilcott plc | 11.7 | 8.01 | 1.46 | 4.6 | -4.14 | 7.83% |
Apollo Group (APOL) is finally be dropped after we were certain that it would be eliminated in the 2010 re-ranking (November 26, 2010 article here). Not being booted from the index meant an increase in price of over +60% from Dec. 2010 to Jan. 2012. Unfortunately, because the stock was in a rising trend for all of 2011, probably due to not getting dropped in late 2010, the stock has decline –39% from the Nov. 26, 2010 article and –63% from the Jan. 2012 high.
There are many analysts that think the Nasdaq Composite and Nasdaq 100 have a lot of upside potential since the previous highs were 4,900 and 4,600, respectively. Unfortunately, with the constant addition and subtraction of companies in the index, the Nasdaq Composite and top 100 may be mired at the current levels for some time to come.
We have outlined our thesis on the negative impact of adding and deleting companies to an index in our article titled “Dow Jones' Decline Largely Impacted by Index Changes.” We believe that this explains why the decline from 1929-32 was so deep and the subsequent rise to break even from 1932-54 took so long (article here). This was followed up with our article that highlighted the fact that recovery from the 1932 low was much quicker than the Dow Jones Industrial Index reflected in an article titled “Recovery From 1929 Crash Was Quicker Than Most People Think” (found here). A similar phenomenon of underperformance due to frequent changes with overvalued stocks is being experienced in the Nasdaq Composite and Nasdaq 100 index.
2011 Additions and Deletions Performance Review
In 2011, there were five companies added and five companies dropped (found here) to/from the Nasdaq 100 Index. The following is the 1-year performance of those companies.
| Symbol | Name of companies added | 2011 | 2012 | % change |
| AVGO | Avago Technologies | 30.61 | 31.14 | 1.73% |
| FOSL | Fossil, Inc. | 86.36 | 90.67 | 4.99% |
| GOLD | Randgold Resources | 108.51 | 99.65 | -8.17% |
| MNST | Monster Bev. (prev. Hansen Nat.) | 48.57 | 53.38 | 9.90% |
| NUAN | Nuance Communications | 24.74 | 22.01 | -11.03% |
| Average change for companies added to Nasdaq 100 index: | -0.51% | |||
| Symbol | Name of companies dropped | 2011 | 2012 | % change |
| FLIR | FLIR Systems, Inc. | 25.67 | 20.36 | -20.69% |
| ILMN | Illumina Inc. | 28.37 | 51.22 | 80.54% |
| NIHD | NII Holdings Inc. | 20.23 | 6.32 | -68.76% |
| QGEN | Qiagen NV | 14.34 | 17.6 | 22.73% |
| URBN | Urban Outfitters Inc. | 26.34 | 38.6 | 46.55% |
| Average change for companies dropped from Nasdaq 100 index: | 12.08% | |||
As was the case in last year’s changes to the 2010 Nasdaq 100, the stocks that were added could not exceed the returns of the stocks that were dropped from the index. In the period from 2010 to 2011, the companies that were added lost –15.58% while the companies that were dropped lost “only” –3.45%. Among the companies added to the index last year, based on our analysis of previous trends, we had said the following of Monster Beverage (formerly Hansen Natural):
“We believe that the recent re-introduction of Hansen Natural (HANS) will be among the top performing stocks at the time of the next re-ranking of the Nasdaq 100.”
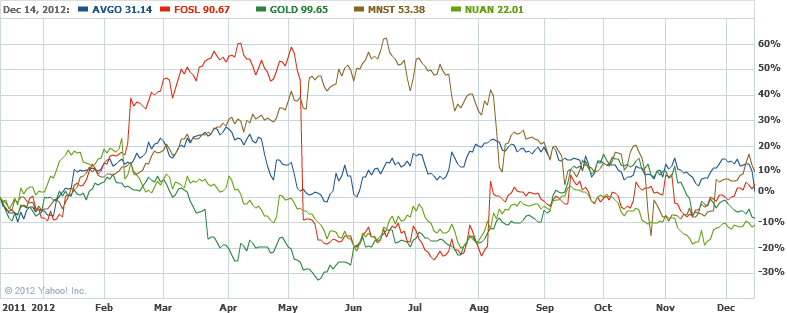
One year later, Monster Beverage provided the top gain of all the stocks that were added last year.
Another observation made of the 2011 Nasdaq re-ranking was the following:
“Of the stocks that were added to the index (2010 re-ranking), the non-tech related companies, Dollar Tree (DLTR) and Whole Foods (WFM), outperformed with gains of 48% and 40%, respectively. This suggests that the “basics” will outperform in the coming year…”
Monster Beverage (MNST) and Fossil Inc. (FOSL), both not technology-related, provided the largest intra-year moves by rising as much as +60% before coming back to earth. It should be noted that non-technology stocks performed the best over the last year. While Randgold (GOLD) is not a technology stock, it was added to the index based on the hype surrounding the rise in the price of gold and was a more reactionary inclusion suggesting that underperformance was likely.
2010 Additions and Deletions Performance Review
The distinction of being added to the Nasdaq 100 should be considered an achievement. However, the path usually isn’t so easy after being added to the index.
In the middle of a bull market run, the stocks that were added to the Nasdaq 100 Index on December 20, 2010 (found here) have underperformed by a wide margin when compared to the Nasdaq 100 over the same period. Of the seven companies that were added at the time, only two stocks (both non-technology companies) have gains.
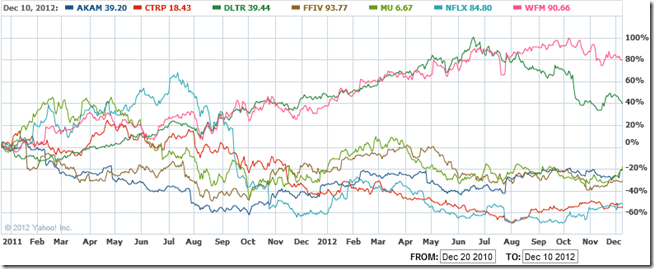
Most investors would associate being added to the technology heavy Nasdaq 100 as an achievement. However, as we’ve indicated with the Dow Industrials in the past (found here and here), being added to an index usually occurs when a stock has already seen its best performance and is far likelier to decline than rise over the medium term (1-3 year period).
| Symbol | Company | 2010 | 2012 | % change |
| AKAM | Akami | 50.39 | 39.2 | -22.21% |
| CTRP | Ctrip.com | 40.96 | 18.43 | -55.00% |
| DLTR | Dollar Tree | 28.12 | 39.44 | 40.26% |
| FFIV | F5 Networks | 136.64 | 93.77 | -31.37% |
| MU | Micron Tech | 8.14 | 6.67 | -18.06% |
| NFLX | Netflix | 186.24 | 84.8 | -54.47% |
| WFM | Whole Foods | 51.35 | 90.66 | 76.55% |
| Average | -9.19% | |||
| NDX | Nasdaq 100 | 2223.04 | 2647.57 | 19.10% |
All of the companies listed above are great for their own reasons, however, as a group the average return was –9.19% while the Nasdaq 100 Index managed to increase over +19% in the same 2-year period.
Nasdaq 100 Summary
-
The Nasdaq 100 cannot exceed the highs of 1999-2000 if the index is constantly adding high priced and overvalued stocks while at the same time taking out fairly valued and underpriced stocks.
-
Although more popularly known as a technology index, the Nasdaq 100 addition of companies that are not in the technology sector are expected to perform better than those associated with technology over the next 2-3 year periods.
-
Former Nasdaq 100 stocks that are being dropped from the index should be considered as potential investment opportunities based on their fundamental attributes.
Comments Off on Nasdaq 100: 2012 Re-Rank Review
Posted in Nasdaq 100, re-rank review
Nasdaq 100 Watch List: December 12, 2012
Below are the Nasdaq 100 companies that are within 10% of their respective 52-week lows. Stocks that appear on our watch lists are not recommendations to buy. Instead, they are the starting point for doing your research and determining the best company to buy. Ideally, a stock that is purchased from this list is done after a considerable decline in the price and rigorous due diligence.
| Symbol | Name | Price | P/E | EPS | Yield | P/B | dividend | payout ratio | % from low |
| WCRX | Warner Chilcott plc | 11.3 | 7.73 | 1.46 | 4.4 | -4.33 | 0.5 | 34.25% | 2.26% |
| DLTR | Dollar Tree, Inc. | 38.65 | 15.53 | 2.49 | - | 5.61 | - | - | 4.12% |
| VOD | Vodafone Group | 26 | - | -0.55 | 3.9 | 1.14 | 1.02 | -185.45% | 4.21% |
| BBBY | Bed Bath & Beyond Inc. | 58.18 | 13.52 | 4.3 | - | 3.34 | - | - | 4.68% |
| TEVA | Teva Pharmaceutical | 39.47 | 16.08 | 2.45 | 1.9 | 1.58 | 0.81 | 33.06% | 5.53% |
| MSFT | Microsoft Corporation | 27.24 | 14.72 | 1.85 | 3.4 | 3.34 | 0.92 | 49.73% | 7.08% |
| INTC | Intel Corporation | 20.67 | 9.01 | 2.29 | 4.5 | 2.09 | 0.9 | 39.30% | 7.49% |
| KLAC | KLA-Tencor Corporation | 47.08 | 11.45 | 4.11 | 3.4 | 2.36 | 1.6 | 38.93% | 8.96% |
| MCHP | Microchip Technology Inc. | 31.7 | 30.16 | 1.05 | 4.5 | 3.12 | 1.41 | 134.29% | 9.61% |
| ^NDX | NASDAQ-100 | 2,674.57 | - | - | - | - | - | - | 21.04% |
Watch List Summary
A stock that we’re interested in is Dollar Tree (DLTR). Dollar Tree has had a substantial run in the last five years. As the price of the stock has recently peaked at $56.34 on June 20, 2012, the decline has almost been as substantial.

Dollar Tree (DLTR) has declined -31% from the most recent peak. The highlight of this stock is the ability to remain in a rising trend from the low in January 2008 in spite of the -40% decline in the general stock market.
From a technical standpoint, the stock has established a significant support level at $37.71. So far, the stock has the potential to increase from the current level to at least $42.18 level on the upside. However, falling below the support level means that the stock could easily achieve the conservative downside target of $25.88 (extreme downside target is $18.78).
A decline to $25.88 is equal to –54%. Such a decline would not be unusual as it would only be slightly more than the decline in the stock from July 2007 at $14.74 to January 2008 at $7.41.
According to Dow Theory, Dollar Tree has the following downside targets:
-
$39.93
-
$31.72 (downside fair value)
-
$23.52
More research and a potential purchase should take place at $25.88 and below.
Watch List Performance Review
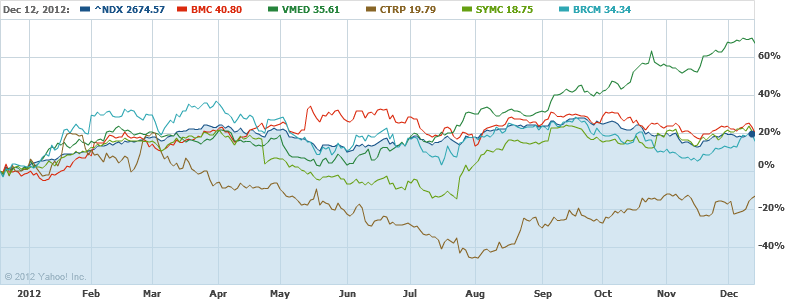
In our ongoing review of the Nasdaq 100 Watch List, we have taken the stocks from our list of December 16, 2011 (found here) and have checked their performance one year later. The companies on that list are provided below with the closing prices from December 16, 2011 to December 12, 2012.
|
Symbol
|
Name |
2011 | 2012 | % change |
| BMC | BMC Software, Inc. | 33.17 | 40.8 | 23.00% |
| VMED | Virgin Media Inc. | 20.95 | 35.61 | 69.98% |
| CTRP | Ctrip.com Int'l | 23.1 | 19.79 | -14.33% |
| SYMC | Symantec Corp. | 15.46 | 18.75 | 21.28% |
| BRCM | Broadcom Corp. | 28.72 | 34.34 | 19.57% |
| Average | 23.90% | |||
| NDX | Nasdaq 100 Index | 2238.18 | 2674.57 | 19.50% |
Overall, the watch list slightly exceed the Nasdaq 100 index by +4.40%. All stocks achieved gains of +20% within 5 months. Virgin Media (VMED) exceeded our expectations by a wide margin. In fact, the stock only went up after being on the watch list by rising +69% in the last year.
Comments Off on Nasdaq 100 Watch List: December 12, 2012
Posted in BBBY, DLTR, Nasdaq 100 Watch List, TEVA, Teva Pharmaceutical, VOD, WCRX
Insurance Watch List: December 7, 2012
The following is one of our personal favorite watch lists. We started tracking the insurance industry in January 2011 and we’re very impressed with the results so far.
Anyone who wishes to be successful in insurance stocks should read the book The Davis Dynasty by John Rothchild. The book starts with Shelby Collum Davis investing approximately $50,000 to $100,000 that ultimately grew to $900 million after 47 years. The strategies employed by Davis seem more accessible to average investors as opposed to Warren Buffett’s leveraged strategies and education from Benjamin Graham.
| Symbol | Name | Price | P/E | EPS | Yield | P/B | payout ratio | % from low |
| NSEC | National Security Group Inc. | 7.6 | - | -3.14 | 1.3 | 0.63 | -3.18% | 0.00% |
| MIG | Meadowbrook Insurance Group | 5.44 | - | -0.33 | 1.5 | 0.49 | -24.24% | 2.64% |
| GLRE | Greenlight Capital Re, Ltd. | 23.01 | 6.06 | 3.8 | - | 0.96 | 0.00% | 3.46% |
| RLI | RLI Corp. | 64.23 | 12.35 | 5.2 | 2 | 1.52 | 24.62% | 3.83% |
| PKIN | Pekin Life Insurance Company | 10.75 | 59.39 | 0.18 | 1.1 | 1.56 | 66.67% | 4.37% |
| FRFHF | Fairfax Financial Holdings | 352.5 | - | -34.42 | - | 0.98 | 0.00% | 4.71% |
| TWGP | Tower Group Inc. | 17.54 | 12.73 | 1.38 | 4.3 | 0.63 | 54.35% | 6.30% |
| ANAT | American National Insurance Co. | 68.05 | 9.98 | 6.82 | 4.5 | 0.47 | 45.16% | 6.86% |
| AIZ | Assurant Inc. | 34.81 | 4.93 | 7.06 | 2.4 | 0.53 | 11.90% | 7.41% |
| CRVL | CorVel Corporation | 42.4 | 20.53 | 2.06 | - | 3.97 | 0.00% | 7.45% |
| RGA | Reinsurance Group of America | 51.99 | 6.4 | 8.12 | 1.8 | 0.57 | 11.82% | 7.51% |
| WSH | Willis Group Holdings Plc | 34.52 | 15.92 | 2.17 | 3.1 | 2.27 | 49.77% | 7.94% |
| TDHOY | T&D Holdings, Inc. | 5.29 | 15.11 | 0.35 | - | 0.42 | 0.00% | 8.18% |
| ASI | American Safety Insurance Hlds | 17.21 | 33.03 | 0.52 | - | 0.48 | 0.00% | 9.27% |
-
Avoid insurance stocks with payout ratios that are in the negative or exceeding 100%
-
Insurance stocks with low average trading volume have low liquidity and are considered higher risk
Watch List Summary
Since the publication of our watch list dated November 6, 2012, we have acquired two insurance stocks, American National Insurance (ANAT) on December 3, 2012 and Reinsurance Group of America (RGA) on December 6, 2012. Combined, the stocks comprise 26% of our partnership portfolio.
Of interest to us on the current watch list is Greenlight Capital Re (GLRE). The company has been publicly traded since 2007. Although relatively new, we believe that with GLRE being in the reinsurance sector it is the most lucrative opportunity for insurance investing at the current time.
According to Dow Theory, Greenlight Capital Re has the following downside targets:
-
$22.93
-
$19.49
-
$16.07
-
$9.20
The short-term upside target is $26.35.
Our interest in Greenlight Capital Re is not based on David Einhorn’s involvement with the company. In fact, we believe that Einhorn’s notoriety and ever changing investment stance is a possible liability. Careful consideration of company fundamentals is required for anyone interested in this stock.
U.S. Dividend Watch List: December 7, 2012
Below are the 55 companies on our U.S. Dividend Watch List that are within 11% of their respective 52-week lows. Stocks that appear on our watch lists are not recommendations to buy. Instead, they are the starting point for doing your research and determining the best company to buy. Ideally, a stock that is purchased from this list is done after a considerable decline in the price and rigorous due diligence.
| Symbol | Name | Price | % Yr Low | P/E | EPS (ttm) | Dividend | Yield | Payout Ratio |
| OMI | Owens & Minor, Inc. | 27.57 | 2.22% | 16.12 | 1.71 | 0.88 | 3.19% | 51% |
| RBCAA | Republic BanCorp., Inc. | 20.03 | 2.40% | 3.54 | 5.66 | 0.66 | 3.30% | 12% |
| WABC | Westamerica BanCorp. | 42.00 | 3.70% | 14.00 | 3.00 | 1.48 | 3.52% | 49% |
| SON | Sonoco Products Co. | 29.76 | 4.02% | 16.72 | 1.78 | 1.20 | 4.03% | 67% |
| ED | Consolidated Edison, Inc. | 56.03 | 4.48% | 14.71 | 3.81 | 2.42 | 4.32% | 64% |
| LKFN | Lakeland Financial Corp. | 24.54 | 4.56% | 11.47 | 2.14 | 0.68 | 2.77% | 32% |
| INTC | Intel Corp. | 20.16 | 4.81% | 8.80 | 2.29 | 0.90 | 4.47% | 39% |
| BOH | Bank of Hawaii Corp. | 43.48 | 5.00% | 12.01 | 3.62 | 1.80 | 4.14% | 50% |
| JW-A | John Wiley & Sons Inc. | 42.72 | 5.17% | 13.14 | 3.25 | 0.80 | 1.87% | 25% |
| ATR | AptarGroup Inc. | 47.70 | 5.55% | 19.63 | 2.43 | 0.88 | 1.84% | 36% |
| SJW | SJW Corp. | 23.89 | 5.90% | 19.58 | 1.22 | 0.71 | 2.97% | 58% |
| NWN | Northwest Natural Gas | 43.44 | 5.93% | 19.22 | 2.26 | 1.82 | 4.19% | 81% |
| MCD | McDonald's Corp. | 88.48 | 6.21% | 16.66 | 5.31 | 3.08 | 3.48% | 58% |
| MSEX | Middlesex Water Co. | 18.58 | 6.29% | 21.60 | 0.86 | 0.75 | 4.04% | 87% |
| IBKC | IBERIABANK Corp. | 47.07 | 6.30% | 19.61 | 2.40 | 1.36 | 2.89% | 57% |
| TEG | Integrys Energy Group Inc | 53.37 | 6.61% | 16.84 | 3.17 | 2.72 | 5.10% | 86% |
| WEYS | Weyco Group, Inc. | 23.48 | 6.68% | 15.25 | 1.54 | 0.68 | 2.90% | 44% |
| CWT | California Water Service | 17.97 | 6.71% | 16.49 | 1.09 | 0.63 | 3.51% | 58% |
| ANAT | American Nat'l Insurance | 68.05 | 6.86% | 9.98 | 6.82 | 3.08 | 4.53% | 45% |
| NJR | New Jersey Resources | 41.20 | 6.99% | 18.48 | 2.23 | 1.60 | 3.88% | 72% |
| CBU | Community Bank System | 27.18 | 7.09% | 13.80 | 1.97 | 1.08 | 3.97% | 55% |
| CLC | Clarcor Inc. | 45.87 | 7.30% | 18.88 | 2.43 | 0.54 | 1.18% | 22% |
| PX | Praxair, Inc. | 107.31 | 7.31% | 19.13 | 5.61 | 2.20 | 2.05% | 39% |
| CFR | Cullen/Frost Bankers, Inc. | 54.00 | 7.38% | 14.29 | 3.78 | 1.92 | 3.56% | 51% |
| VVC | Vectren Corp. | 29.49 | 7.39% | 14.89 | 1.98 | 1.42 | 4.82% | 72% |
| TMP | Tompkins Financial Corp. | 38.55 | 7.62% | 15.73 | 2.45 | 1.52 | 3.94% | 62% |
| TRMK | Trustmark Corp. | 22.35 | 7.66% | 12.77 | 1.75 | 0.92 | 4.12% | 53% |
| WGL | WGL Holdings, Inc. | 38.74 | 7.73% | 14.30 | 2.71 | 1.60 | 4.13% | 59% |
| ETP | Energy Transfer Partners | 43.31 | 7.76% | 9.96 | 4.35 | 3.58 | 8.27% | 82% |
| PRK | Park National Corp. | 64.31 | 7.78% | 14.58 | 4.41 | 3.76 | 5.85% | 85% |
| CASY | Caseys General Stores | 49.82 | 7.95% | 16.50 | 3.02 | 0.66 | 1.32% | 22% |
| IBM | IBM | 191.95 | 8.23% | 13.80 | 13.91 | 3.40 | 1.77% | 24% |
| WBS | Webster Financial Corp. | 19.82 | 8.31% | 11.13 | 1.78 | 0.40 | 2.02% | 22% |
| FNB | F.N.B. Corp. | 10.72 | 8.39% | 13.92 | 0.77 | 0.48 | 4.48% | 62% |
| ONB | Old National BanCorp. | 11.79 | 8.46% | 12.41 | 0.95 | 0.36 | 3.05% | 38% |
| SFNC | Simmons First National | 24.26 | 8.50% | 15.96 | 1.52 | 0.80 | 3.30% | 53% |
| SCG | SCANA Corporation | 45.90 | 8.56% | 14.76 | 3.11 | 1.98 | 4.31% | 64% |
| PPL | PP&L Corporation | 28.98 | 8.62% | 10.42 | 2.78 | 1.44 | 4.97% | 52% |
| SJI | South Jersey Industries | 49.89 | 8.91% | 14.72 | 3.39 | 1.77 | 3.55% | 52% |
| APD | Air Products & Chemicals | 83.06 | 9.13% | 15.27 | 5.44 | 2.56 | 3.08% | 47% |
| EXPD | Expeditors International | 37.34 | 9.18% | 23.34 | 1.60 | 0.56 | 1.50% | 35% |
| FDS | FactSet Research Systems | 93.25 | 9.22% | 22.63 | 4.12 | 1.24 | 1.33% | 30% |
| ABM | ABM Industries, Inc. | 19.56 | 9.58% | 20.16 | 0.97 | 0.58 | 2.97% | 60% |
| FULT | Fulton Financial Corp. | 9.62 | 9.94% | 12.33 | 0.78 | 0.32 | 3.33% | 41% |
| GD | General Dynamics Corp. | 67.19 | 9.99% | 10.00 | 6.72 | 2.04 | 3.04% | 30% |
| PNY | Piedmont Natural Gas Co. | 31.37 | 10.03% | 20.11 | 1.56 | 1.20 | 3.83% | 77% |
| DCI | Donaldson Co. Inc. | 33.58 | 10.06% | 20.48 | 1.64 | 0.36 | 1.07% | 22% |
| GRC | Gorman-Rupp Company | 28.10 | 10.15% | 19.93 | 1.41 | 0.40 | 1.42% | 28% |
| THFF | First Financial Corp. | 29.86 | 10.31% | 11.48 | 2.60 | 0.96 | 3.22% | 37% |
| SRCE | 1st Source Corp. | 21.76 | 10.46% | 11.10 | 1.96 | 0.68 | 3.13% | 35% |
| UBSI | United Bankshares, Inc. | 24.93 | 10.60% | 15.39 | 1.62 | 1.24 | 4.97% | 77% |
| GWW | W.W. Grainger Inc. | 191.09 | 10.78% | 20.35 | 9.39 | 3.20 | 1.67% | 34% |
| CAH | Cardinal Health, Inc. | 40.90 | 10.81% | 12.94 | 3.16 | 1.10 | 2.69% | 35% |
| BDX | Becton, Dickinson and Co. | 77.63 | 10.82% | 13.89 | 5.59 | 1.98 | 2.55% | 35% |
| AROW | Arrow Financial Corp. | 24.42 | 10.90% | 13.34 | 1.83 | 1.00 | 4.10% | 55% |
| 55 Companies | ||||||||
Watch List Review
Owens & Minor (OMI) topped our list again this week. The stock was virtually unchanged from a week ago and nothing material developed so we’ll refer you to our previous post commentary here.
Republic BanCorp (RBCAA) is second on our list and has become a big topic of discussion within our team. The company fundamentals appear to be simply stunning. RBCAA has exhibited a dividend growth rate of 13% annually in the past five years. Earnings have exceeded that rate at 16.5% annually and book value trailing at 11.5% over the past 5 years. So while the company trades at a 25% discount to its book value and at 3x earnings, we are afraid of its balance sheet. The company’s long-term debt is $764M, nearly double the size of its market cap of $420M. Cash on hand is $96M with 12% of debt. Debt is a major thing we are worry about. Besides that, the 12% payout ratio suggests that the company has a large margin of safety on the earnings side. The bank weathered the financial crisis without having to cut the dividend and that’s a big positive on the stock.
Top Five Performance Review
In our ongoing review of the NLO Dividend Watch List, we have taken the top five stocks on our list from December 9, 2011 and have check their performance one year later. The top five companies on that list can be seen in the table below.
| Symbol | Name | 2011 Price | 2012 Price | % change |
| AVP | Avon Products, Inc. | 16.58 | 14.62 | -11.82% |
| BDX | Becton, Dickinson and Co. | 72.92 | 77.63 | 6.46% |
| WST | West Pharmaceutical | 37.38 | 54.71 | 46.36% |
| BCR | CR Bard, Inc. | 85.70 | 97.46 | 13.72% |
| FNFG | First Niagara Financial Group Inc. | 8.73 | 7.59 | -13.06% |
| Average | 8.33% | |||
| DJI | Dow Jones Industrial | 12,184.26 | 13,155.13 | 7.97% |
| SPX | S&P 500 | 1,255.19 | 1,418.07 | 12.98% |
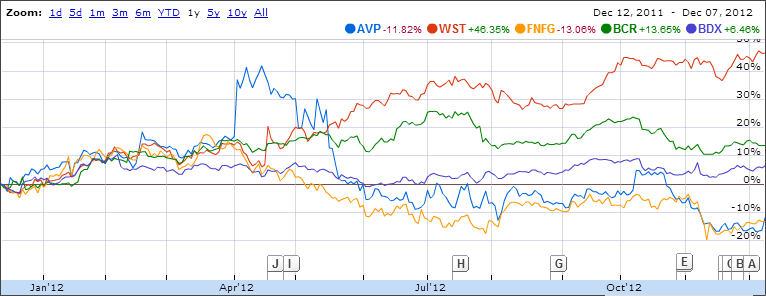
Our watch list managed to gain slightly more than the Dow Industrial Index but failed to outperform the S&P500 Index. The biggest decline came from First Niagara Financial (FNFG) because the company cut their dividend by half. The 97% payout ratio gave us a first sign of what was to come with the dividend payment.
Avon's (AVP) decline of -12% came after the company couldn’t managed to capitalized on the buyout rumor which boost the stock up as high as 40% within 4 months. Our sale of AVP on March 30, 2012 (found here) seemed like a huge mistake after only a +10% gain. However, since our sale of the stock, AVP has declined -24.48%.
In all case, however, all five companies managed to gain 10% within the first three months.
Comments Off on U.S. Dividend Watch List: December 7, 2012
Posted in NLO Dividend Watch List