Author Archives: nlo-admin

Canadian Dividend Watch List: January 15, 2013

This is a list of Canadian dividend stocks that currently, or in the past, had a history of consecutive dividend increases. For those wishing to find the most complete fundamental information on these companies, we recommend visiting one of Canada’s leading financial websites, the Financial Post (found here). However, Yahoo!Finance probably has the better long-term charts and historical dividend data.

Continue reading

2012 Performance Review

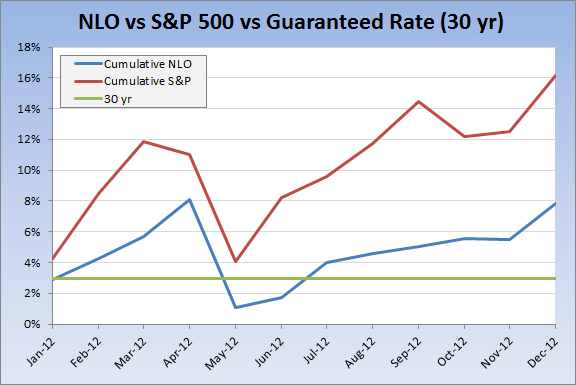
Below is a chart of how our investment portfolio performed against the S&P 500 index and the 30-year Treasury based on the January 3, 2012 rate (found here).

image

Our portfolio exceeded the guaranteed rate (30-yr treasury) by almost double.  However, the S&P 500 exceeded our 2012 return by more than double.

Below is the cumulative performance of our investment strategy since 2006 when we codified our investment approach in the last quarter of 2005.  We have compared our performance to the indexes indicated, based on $10,000 invested over the subsequent period of time.

Year Dow Indu.  $ 10,000.00 S&P 500  $ 10,000.00 Nasdaq  $ 10,000.00 NLO Portfolio  $ 10,000.00
2006 16.29%  $ 11,629.00 15.74%  $ 11,574.00 9.52%  $ 10,952.00 18.30%  $ 11,830.00
2007 6.43%  $ 12,376.74 5.46%  $ 12,205.94 9.81%  $ 12,026.39 19.80%  $ 14,172.34
2008 -33.84%  $   8,188.45 -37.22%  $   7,662.89 -40.54%  $   7,150.89 14.35%  $ 16,206.07
2009 18.82%  $   9,729.52 27.11%  $   9,740.30 43.89%  $ 10,289.42 36.65%  $ 22,145.60
2010 11.02%  $ 10,801.71 14.32%  $ 11,135.11 16.91%  $ 12,029.36 7.14%  $ 23,726.79
2011 5.53%  $ 11,399.05 0.00%  $ 11,135.11 -1.80%  $ 11,812.83 6.20%  $ 25,197.85
2012 7.26%  $ 12,226.62 16.20%  $ 12,939.00 15.91%  $ 13,692.25 7.80%  $ 27,163.28

Dow Theory: Waiting for Confirmation

Today the Dow Jones Transportation Averaged (DJT) closed at a new all-time high.

Continue reading

Technical Review: Carbo Ceramics (CRR)

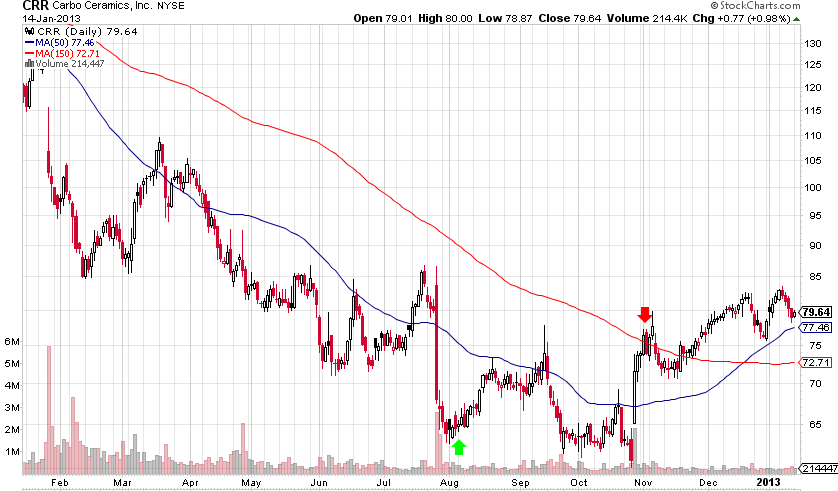
Carbo Ceramics (CRR) was one of the companies that appeared at the top of our dividend watch list for many weeks beginning in February 2012. The watch list served as a beginning point for our research and we took a position in August (found here) at $65.02 (green arrow on chart below). Within three months, we saw shares of CRR rally to $74, a +13.8% gain. As such, we ‘hedged’ our position by selling the principal (found here) and let the profit run (red arrow on chart below).

Recent activity in Carbo Ceramics price suggests that, on a technical basis, the decline is over. Though a rally to its intraday peak of $180 is not expected, we believed there is a good opportunity for those interested in a short to medium-term speculative position in the stock.

image

In our view, the biggest bull case, on a technical basis, is that the 50-day moving average has crossed above the 150-day moving average creating what some call a "golden cross." We rely on the 150-day versus the more popular 200-day moving average for the fact that it is the road less traveled and provides an indication ahead of the crowd.

Currently, shares of Carbo Ceramics are trading just above the 50-day moving average, making this an ideal short-term transaction. For those who wish to trade this generally significant technical pattern, we’d consider selling if shares close below the 150-day moving average or if the stock gains +10% or more.

From a fundamental standpoint, Carbo Ceramics (CRR) provides long-term holders of the stock with the following attributes:

  • According to Value Line Investment Survey, the fair value for CRR is 14 times 2012 cash flow of $6.50, or a stock price of $91, a gain of +14% above the current price of $79.64. As an alternative, if the estimates by Value Line are correct, the 2013 fair value figure is $100.10, a potential gain of +25.69%.
  • Value Line indicates that Carbo Ceramics has increased the dividend for 12 consecutive years in a row.
  • Carbo Ceramics book value has had an annualized growth rate of +14.73%.
  • Carbo Ceramics has no debt

What Is the Downside Risk If I Want to Hold CRR for the Long-Term?

Dow Theory has the following downside targets for Carbo Ceramics:

  • $61.34
  • $44.39
  • $27.43

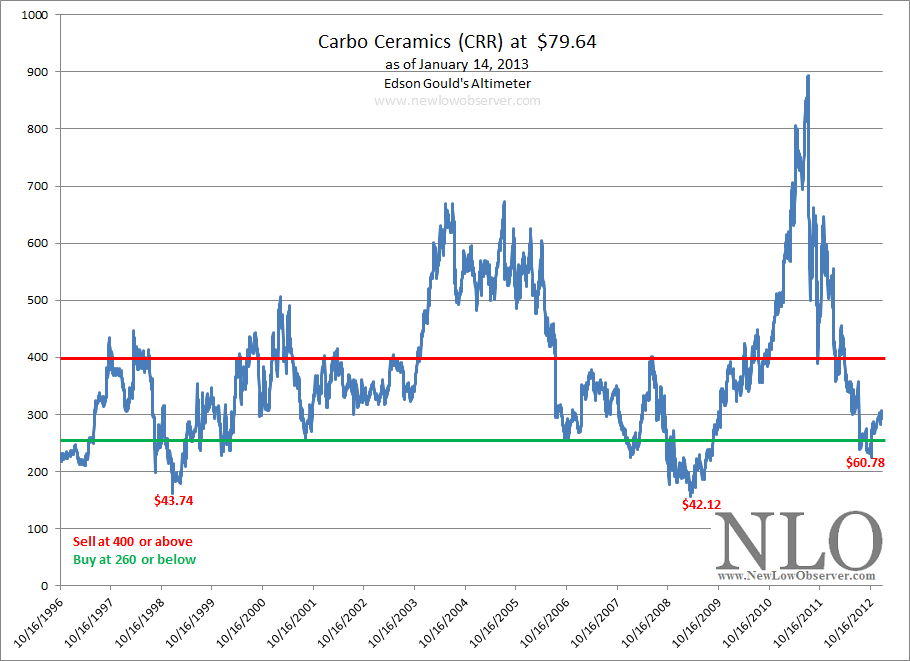
Based on the work of Edson Gould, Carbo Ceramics has the following Altimeter:

CRR 1-14-2013

Carbo Ceramics would have to fall to $70.20 in order to be considered a buy using the Altimeter above. However, as has been the case in the past, seldom does the Altimeter decline to the buy level and then immediately reverse to the upside. therefore we’d expect a push below the $70.20 level for good measure.

image

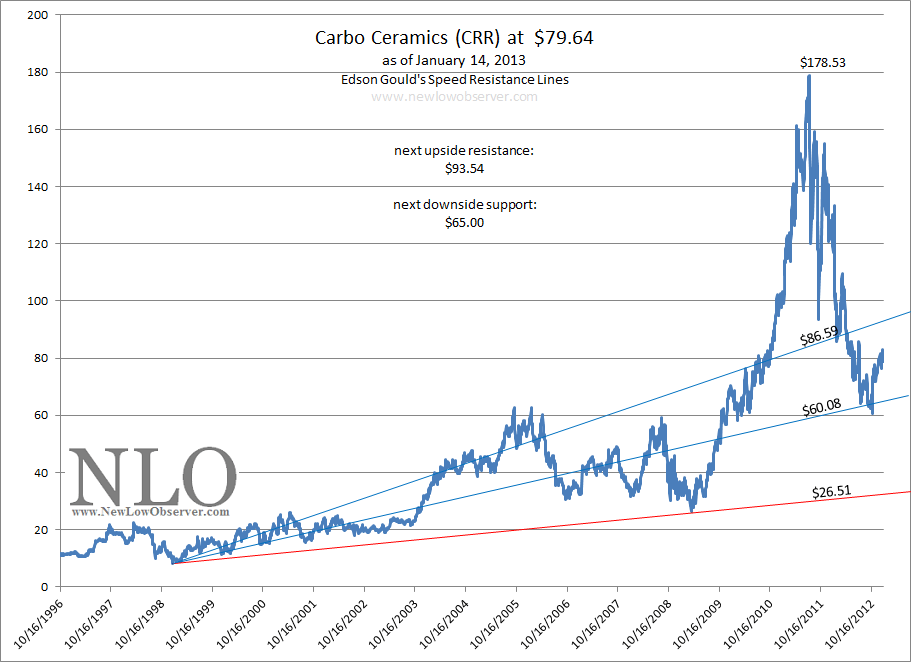
Edson Gould’s Speed Resistance Lines have $65 as the downside support level.

The most conservative of the three downside targets mentioned above is the Dow Theory level of $61. This seems be the most appropriate level to consider a first, or second, purchase if the desire is to hold Carbo Ceramics for the long-term.

U.S. Dividend Watch List: January 11, 2013

Below are the 27 companies on our U.S. Dividend Watch List that are within 11% of their respective 52-week lows. Stocks that appear on our watch lists are not recommendations to buy. Instead, they are the starting point for doing your research and determining the best company to buy. Ideally, a stock that is purchased from this list is done after a considerable decline in the price and rigorous due diligence.

Continue reading

Nasdaq 100 Watch List: January 11, 2013

Below are the Nasdaq 100 companies that are within 10% of their respective 52-week lows. Stocks that appear on our watch lists are not recommendations to buy. Instead, they are the starting point for doing your research and determining the best company to buy. Ideally, a stock that is purchased from this list is done after a considerable decline in the price and rigorous due diligence.

Continue reading

Review: Green Mountain Coffee Roasters

This is a follow-up to our May 2, 2012 piece on downside and upside targets for Green Mountain Coffee Roasters (GMCR).

At the time, GMCR had traded as low as $28.50 (-38.9%)  in after-hours trading.  We gave a downside target of $22.53 due to the fact that the stock had declined below our projected support level of $37.21, as indicated on October 25, 2011.  Since our May 2, 2012 article, GMCR has declined as low as $17.11, see chart below.

Continue reading

Review: Netflix and Herbalife

Netflix (NFLX) is the first stock under review.  Our prior work on this stock can be found here (September 22, 2011).

Continue reading

U.S. Dividend Watch List: January 4, 2013

We’ve reached the beginning of 2013 and here are the 22 companies on our U.S. Dividend Watch List that are within 11% of their respective 52-week lows. Stocks that appear on our watch lists are not recommendations to buy. Instead, they are the starting point for doing your research and determining the best company to buy. Ideally, a stock that is purchased from this list is done after a considerable decline in the price and rigorous due diligence.

Continue reading

The Convergence of Stock Market Forces

In our last posting of Dow Theory we mentioned the need for caution on premature calls of a new bull market.  We pointed out that with the Dow Transports and Dow Industrials so close to their respective all-time highs, investors should wait for confirmation of both indexes before getting too excited.  Now we’d like to introduce another observation of Charles H. Dow’s with regards to stock market cycles which might be the perfect antidote to further movement higher.

In June 2010, we published an article titled “The 4 to 4 1/2 Year Market Cycle” (found here).  In that article, we quoted Dow as saying the following:

Continue reading

Dow Theory Update

We may be on the cusp of a Dow Theory cyclical and secular bull market signal.  However, where the rubber hits the road when it comes to Dow Theory is discretion and confirmation.  Discretion is needed for the purpose of avoiding frequent and erroneous calls. Confirmation is needed to ensure the quality of the analysis. We’re hoping that the chart below clarifies what investors need to know about the recent stock market activity.

Continue reading

Transaction Alert

Continue reading

Abbott Labs Update

On September 19, 2012 (found here), we recommended that investors consider selling Abbott Labs (ABT), at least the principal portion.  At the time, ABT was trading at a split-adjusted $33.  by October 16, 2012, shortly after our sell recommendation, Abbott rose as high as $34.67 or +5.06%.

Continue reading

U.S. Dividend Watch List: December 28, 2012

We’ve reached the end of 2012 and here are the 60 companies on our U.S. Dividend Watch List that are within 11% of their respective 52-week lows. Stocks that appear on our watch lists are not recommendations to buy. Instead, they are the starting point for doing your research and determining the best company to buy. Ideally, a stock that is purchased from this list is done after a considerable decline in the price and rigorous due diligence.

Symbol Name Price % Yr Low P/E EPS (ttm) Dividend Yield Payout Ratio
ED Consolidated Edison, Inc.  54.93 0.04% 14.42 3.81 2.42 4.41% 64%
INTC Intel Corp.  20.23 0.10% 8.83 2.29 0.90 4.45% 39%
CFR Cullen/Frost Bankers, Inc. 54.08 1.01% 14.31 3.78 1.92 3.55% 51%
NJR New Jersey Resources Corp. 39.03 1.35% 17.50 2.23 1.60 4.10% 72%
TEG Integrys Energy Group Inc 51.61 1.59% 16.28 3.17 2.72 5.27% 86%
MCD McDonald's Corp.  87.58 1.93% 16.49 5.31 3.08 3.52% 58%
PRK Park National Corp. 63.08 2.29% 14.30 4.41 3.76 5.96% 85%
OMI Owens & Minor, Inc. 28.05 2.48% 16.40 1.71 0.88 3.14% 51%
FDS FactSet Research Systems 87.68 2.69% 20.68 4.24 1.24 1.41% 29%
SON Sonoco Products Co. 29.45 2.94% 16.54 1.78 1.20 4.07% 67%
SCG SCANA Corporation 45.10 4.11% 14.50 3.11 1.98 4.39% 64%
WABC Westamerica BanCorp.  42.17 4.12% 14.06 3.00 1.48 3.51% 49%
WEYS Weyco Group, Inc.  22.95 4.27% 14.90 1.54 0.68 2.96% 44%
ATR AptarGroup Inc. 47.34 4.76% 19.48 2.43 0.88 1.86% 36%
PPL PP&L Corporation 28.18 5.62% 10.14 2.78 1.44 5.11% 52%
NWN Northwest Natural Gas Co. 43.32 5.63% 19.17 2.26 1.82 4.20% 81%
VVC Vectren Corp. 29.02 5.68% 14.66 1.98 1.42 4.89% 72%
ETP Energy Transfer Partners 42.48 5.70% 9.77 4.35 3.58 8.43% 82%
CBU Community Bank System 26.91 6.03% 13.66 1.97 1.08 4.01% 55%
SJI South Jersey Industries 49.48 6.36% 14.60 3.39 1.77 3.58% 52%
DCI Donaldson Co. Inc. 32.46 6.39% 19.79 1.64 0.36 1.11% 22%
BOH Bank of Hawaii Corp. 44.08 6.45% 12.18 3.62 1.80 4.08% 50%
UBSI United Bankshares, Inc.  24.04 6.65% 14.84 1.62 1.24 5.16% 77%
ANAT American National Insurance 67.99 6.77% 9.97 6.82 3.08 4.53% 45%
RBCAA Republic BanCorp., Inc.  20.90 6.85% 3.69 5.66 0.66 3.16% 12%
IBM IBM 189.83 7.04% 13.65 13.91 3.40 1.79% 24%
TRMK Trustmark Corp.  22.23 7.08% 12.70 1.75 0.92 4.14% 53%
WGL WGL Holdings, Inc. 38.65 7.48% 14.26 2.71 1.60 4.14% 59%
AJG Arthur J Gallagher & Co. 34.47 7.69% 20.52 1.68 1.36 3.95% 81%
PNY Piedmont Natural Gas Co. 30.72 7.75% 18.51 1.66 1.20 3.91% 72%
PX Praxair, Inc. 107.90 7.90% 19.23 5.61 2.20 2.04% 39%
KO Coca-Cola Co 35.97 8.07% 18.83 1.91 1.02 2.84% 53%
BDX Becton, Dickinson and Co. 77.34 8.08% 13.84 5.59 1.98 2.56% 35%
WBS Webster Financial Corp. 20.41 8.10% 11.47 1.78 0.40 1.96% 22%
CWT California Water Service 18.21 8.14% 16.71 1.09 0.63 3.46% 58%
SYBT S.Y. BanCorp., Inc.  21.90 8.20% 11.90 1.84 0.80 3.65% 43%
JW-A John Wiley & Sons Inc. 38.56 8.25% 12.32 3.13 0.80 2.07% 26%
DBD Diebold, Inc. 30.03 8.57% 11.38 2.64 1.14 3.80% 43%
APD Air Products & Chemicals 82.93 8.96% 15.24 5.44 2.56 3.09% 47%
CTBI Community Trust BanCorp. 31.75 8.99% 11.14 2.85 1.26 3.97% 44%
AROW Arrow Financial Corp.  24.64 9.04% 13.46 1.83 1.00 4.06% 55%
TMP Tompkins Financial Corp. 39.11 9.18% 15.96 2.45 1.52 3.89% 62%
EGN Energen Corp. 43.90 9.39% 15.46 2.84 0.56 1.28% 20%
PEP PepsiCo Inc. 68.02 9.44% 18.09 3.76 2.15 3.16% 57%
CLX Clorox Co. 72.66 9.48% 17.64 4.12 2.56 3.52% 62%
ABM ABM Industries, Inc. 19.58 9.69% 17.18 1.14 0.60 3.06% 53%
MSEX Middlesex Water Company  19.18 9.73% 22.30 0.86 0.75 3.91% 87%
THFF First Financial Corp. 29.71 9.75% 11.43 2.60 0.96 3.23% 37%
LKFN Lakeland Financial Corp.  25.78 9.84% 12.05 2.14 0.68 2.64% 32%
IBKC IBERIABANK Corp.  48.71 10.00% 20.30 2.40 1.36 2.79% 57%
MRK Merck & Co., Inc 40.64 10.11% 18.47 2.20 1.72 4.23% 78%
SYK Stryker Corp. 54.45 10.16% 14.64 3.72 1.06 1.95% 28%
CLC Clarcor Inc. 47.15 10.29% 19.40 2.43 0.54 1.15% 22%
CAH Cardinal Health, Inc.  40.72 10.32% 12.89 3.16 1.10 2.70% 35%
XOM Exxon Mobil Corp.  85.10 10.33% 9.00 9.46 2.28 2.68% 24%
ADP Automatic Data Processing 56.33 10.69% 19.90 2.83 1.74 3.09% 61%
MCY Mercury General Corp. 39.87 10.72% 10.22 3.90 2.45 6.14% 63%
YUM Yum! Brands, Inc. 64.72 10.82% 19.04 3.40 1.34 2.07% 39%
CAT Caterpillar Inc. 86.81 10.94% 8.89 9.76 2.08 2.40% 21%
ADM Archer Daniels Midland Co. 27.06 10.99% 18.92 1.43 0.70 2.59% 49%
60 Companies

Watch List Review

This week, we will refer you to our comments made last week on top company, Consolidated Edison (ED).  That commentary also apply to the fourth company on our list, New Jersey Resources (NJR).

Second on our list is Intel (INTC), the largest chip maker and a Dow component.  In addition to that, Intel made our Dog of the NLO list and Dog of the Dow.  More on that in our post Dog of the Dow – A Look Back at 2012 & Forward to 2013.

In addition to Intel, we’d like to highlight several blue chip companies on this list. McDonald’s (MCD), IBM (IBM), and Caterpillar (CAT).  These companies made the list and are mentioned in our article above.  With the Dow underperforming the S&P500 (+5.9% vs 11.5%), our guess is that these companies are poised to out perform in the year to come.

Dogs of the Dow – A Look Back at 2012 & Forward to 2013

The new year is right around the corner and we’re not letting the fiscal cliff stop us from searching for investment ideas.  We've decided to turn to an old strategy, the Dogs of the Dow which was introduced by Michael O’Higgins, for some potential opportunities.  The Dogs of the Dow strategy suggests that you buy the top ten highest yielding stocks of the Dow Jones Industrial Average at the beginning of  each year.

Below is the performance of the "Dogs" for 2012.

Ticker Company 2012 Price Current Price 2012 Yield Current Yield YTD % Chg
T AT&T, Inc.                 30.5                 33.7 5.8% 5.3% 10.5%
VZ Verizon                 40.3                 43.5 5.0% 4.7% 7.9%
KRFT Kraft Foods                 38.0                 44.4 4.8% 4.4% 17.0%
MRK Merck                 37.9                 41.2 4.5% 4.2% 8.8%
PFE Pfizer Inc.                 21.9                 25.1 4.1% 3.8% 15.0%
GE General Electric                 18.2                 20.7 3.8% 3.7% 13.5%
DD Dupont                 46.6                 45.1 3.6% 3.8% -3.2%
JNJ Johnson & Johnson                 65.6                 70.1 3.5% 3.5% 6.9%
INTC Intel Corporation                 24.6                 20.5 3.5% 4.4% -16.7%
PG Procter & Gamble                 66.3                 68.0 3.2% 3.3% 2.5%
  Dogs of the Dow     4.16% 4.11% 6.21%

The top 10 highest yielding companies of the Dow averaged a return of +6.2% compared to the S&P 500 gain of +12.7% and our NLO portfolio gain of +7.4%.  The biggest laggard of the group was Intel (INTC) which is one of our top holdings, down -9% since our purchase.  Additionally, it should be noticed that Kraft Foods (KRFT) is no longer a component of the Dow Jones Industrial Average but has been the best performer of all ten companies.  As pointed out in our 2012 Nasdaq 100 Re-Rank Review (found here), stocks dropped from an index normally outperform, overall.  In the case of KRFT, it was dropped late in the year after spinning off a unit.

If tomorrow was the beginning of the new trading year, these companies would be the Dogs of the Dow for 2013.

Ticker Company Current Price Current Yield
T AT&T, Inc.                 33.7 5.3%
VZ Verizon                 43.5 4.7%
INTC Intel Corporation                 20.5 4.4%
MRK Merck & Co. Inc.                 41.2 4.2%
HPQ Hewlett-Packard                 14.0 3.8%
DD Dupont                 45.1 3.8%
PFE Pfizer Inc.                 25.1 3.8%
GE General Electric Company                 20.7 3.7%
JNJ Johnson & Johnson                 70.1 3.5%
MCD McDonald's Corp.                 88.7 3.5%
  Dogs of the Dow Average   4.07%

There are eight companies that are being carried over from the previous year.  Hewlett-Packard (HPQ) and McDonald’s (MCD) are the new additions.  Hewlett-Packard made the list after the stock slumped -45%.  Interestingly, HPQ has the lowest payout ratio using next years estimated earnings of $3.48.

The primary issue we have with the "Dogs of the Dow" strategy is that it assumes all 30 companies have similar retained earnings and payout ratios.  However, we believe that the dividend yield is a relative valuation and not absolute figure.  As an example, utilities and telecom companies will typically have higher yields than those of other industries such as technology.

As an alternative, we have come up with a different approach to the "Dogs" strategy to determine if there is any merit to our "relative value" assessment.  Instead of looking at the 10 highest yielding stocks of the Dow Jones Industrial Average, we will look at the top 10 stocks closest to their respective 52-week low.  We'll call this ‘Dogs of NLO’.

Here are the top 10 companies we came up with for 2013.

Ticker Company Current Price Current Yield
MSFT Microsoft Corporation           27.0 3.4%
MCD McDonald's Corp.           88.7 3.5%
INTC Intel Corporation           20.5 4.4%
DD Dupont           45.1 3.8%
AA Alcoa Inc.             8.6 1.4%
IBM IBM         192.7 1.8%
UNH UnitedHealth           54.4 1.6%
KO Coca-Cola           36.4 2.8%
MRK Merck & Co. Inc.           41.2 4.2%
CAT Caterpillar Inc.           87.7 2.4%
  Dogs of NLO Average   2.92%

It should be noticed that the dividend yield is considerably less than that of the Dogs of the Dow strategy.  Some could argue that having a low yield will likely result in a lower return, however, as we've demonstrated in an article dated titled "Low Yielding Stocks Offer Exceptional Gains" (found here), the one year gains for low yielding stocks can be outsized.  In another article dated November 10, 2010, titled "Comparing Two Dividend Strategies" (found here), a comparison of low dividend yielding stocks to high dividend yielding stocks, the low yielding stocks have outperfomed by an ever increasingly wide margin as time has passed (2-year updates found in an article titled "Comparing 2 Dividend Strategies: Redux").

Again, this article is to provide a look back at the Dogs of the Dow performance in 2012 and possible picks for 2013.  While we have offered alternative strategies, we haven’t back tested it therefore we cannot and will not guarantee the outcome.  However, we feel strongly that it has a higher chance of outperforming the strategy initiated by Michael O’Higgins in 1991. Only time will tell, so we'll be sure to check  back for a review one year from now.

Note: We've recently written about a technical breakout in Caterpillar (CAT) so we believed 2013 will be a great year for the stock.