
When introducing the topic of market cycles it is often looked upon as something that is more wishful thinking more than anything else. However, it is my hope that I can provided sufficient evidence to convince you that objective observation of the 4 to 4 ½ year market cycle is well worth your time.
Introduction of the topic of the 4 to 4 ½ year market cycle does not come lightly. On September 13, 1900, Charles H. Dow, founder and editor of the Wall Street Journal, referenced the 4-year cycle as noted below:
“We have frequently demonstrated that the stock market, while full of short fluctuations, has a continuing main movement, which often runs in one direction for three or four years at a time.”
Again on February 21, 1901, Dow makes reference to the 4 to 4 ½ year cycle by saying:
“For the past 25 years the commodity market and the stock market have moved almost exactly together. The index number representing many commodities rose from 88 in 1878 to 120 in 1881. It dropped back to 90 in 1885, rose to 95 in 1891, dropped back to 73 in 1896, and recovered to 90 in 1900. Furthermore, index numbers kept in Europe and applied to quite different commodities had almost exactly the same movement in the same time. It is not necessary to say to anyone familiar with the course of the stock market that this has been exactly the course of stocks in the same period.”
All of the period that Dow mentions are based on the 4 year market cycle. However, you don’t need to have a background in secular bull or bear markets from the 19th century to understand the value and weight of the 4 to 4 ½ year market cycle. In the Richard Russell’s Dow Theory Letter dated July 5, 1979, the 4 to 4 ½ year cycle is mentioned again. Of the cycle in question, Russell said:
“We appear to have skipped the surest thing in the market this year, and that is the bottoming of the 4 to 4 ½ year cycle.”
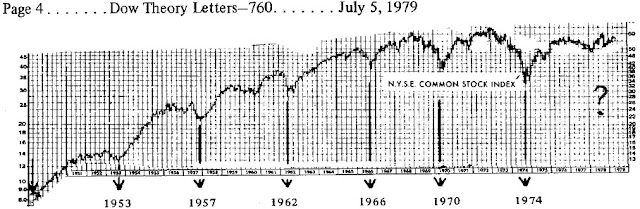
Russell said this even though in retrospect we can clearly see, from a technical standpoint, that 1978 was the actual bottom in the cycle. Only four years later was the ultimate bottom of 1982 that would be the launching pad for the bull market from Dow 1,000 to Dow 10,000. In the same 1979 issue of the Dow Theory Letters, Russell includes a chart that points out the prior cycle bottoms since 1949 (1953, 1957, 1962, 1966, 1970, 1974, 1978) which I’ve included below.
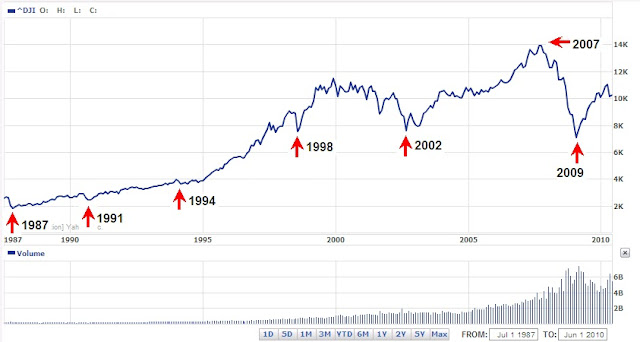
We’ve pointed out that 1982 was the cycle bottom that launched a powerful bull market. However, that bull market wasn’t without interruptions. In the chart below we note the 4 to 4 ½ year cycles that took place along the way (1987, 1991, 1994,1998, and 2002).
Every cycle implies a halfway point that a reversal may take place from. For the 4 to 4 ½ year cycle, this means that the first two years of the cycle are spent going up. No matter whether there is secular bull or secular bear market, the 4 to 4 ½ year market cycle plays itself out for the most part.
Our last major market bottom was March 9, 2009. If my observations on this topic are correct, then we have at least until January 2011 to June 2011 before the half cycle is complete. Afterwards, the market would either trade in a range or establish a well-defined bottom in accordance with the 4 to 4 ½ year market cycle.
Sources:
-
Schultz, Harry, A Treasury of Wall Street Wisdom, Investors Press (Palisades Park, New Jersey), 1966, page 16.
-
Bishop, George W.,Charles H. Dow: Economist, Dow Jones (Princeton, New Jersey), 1967, pages 97 & 107.
-
Russell, Richard, Dow Theory Letters, (San Diego, California), July 5, 1979, page 3 & 4.
-
Sether, Laura, Dow Theory Unplugged, W&A Publishing (Cedar Falls, Iowa), 2009, page 50.