Performance Review
Below is the 1-year performance of the Canadian dividend stocks from our September 2013 watch list.
| symbol |
Name |
2013 |
2014 |
% change |
| TRP.TO |
TransCanada Corp. |
45.72 |
58.14 |
27.17% |
| BEI-UN.TO |
Boardwalk Real Estate Investment Trust |
56.76 |
68.21 |
20.17% |
| IFC.TO |
Intact Financial Corporation |
61.19 |
72.27 |
18.11% |
| REF-UN.TO |
Canadian REIT |
41.18 |
47.85 |
16.20% |
| CAR-UN.TO |
Canadian Apartment Properties REIT |
20.44 |
23.41 |
14.53% |
| BDT.TO |
Bird Construction |
12.37 |
13.98 |
13.02% |
| EMA.TO |
Emera Inc. |
29.95 |
33.76 |
12.72% |
| LB.TO |
Laurentian Bank of Canada |
44.98 |
49.56 |
10.18% |
| AX-UN.TO |
Artis Real Estate Investment Trust |
14.03 |
15.33 |
9.27% |
| FTS.TO |
Fortis Inc. |
31.46 |
34.12 |
8.46% |
| REI-UN.TO |
Riocan Real Estate Investment Trust |
24.16 |
25.63 |
6.08% |
| CWT-UN.TO |
Calloway REIT |
24.67 |
25.75 |
4.38% |
| FCR.TO |
First Capital Realty Inc. |
17.00 |
17.55 |
3.24% |
| CUF-UN.TO |
Cominar REIT |
19.09 |
18.93 |
-0.84% |
| NWC.TO |
The North West Company |
23.48 |
22.26 |
-5.20% |
| D-UN.TO |
Dundee REIT |
30.16 |
27.85 |
-7.66% |
| TLM.TO |
Talisman Energy Inc. |
11.38 |
9.93 |
-12.74% |
| TA.TO |
TransAlta Corp. |
13.69 |
11.79 |
-13.88% |
| JE.TO |
Just Energy Group |
6.50 |
5.28 |
-18.77% |
|
|
|
Average |
5.50% |
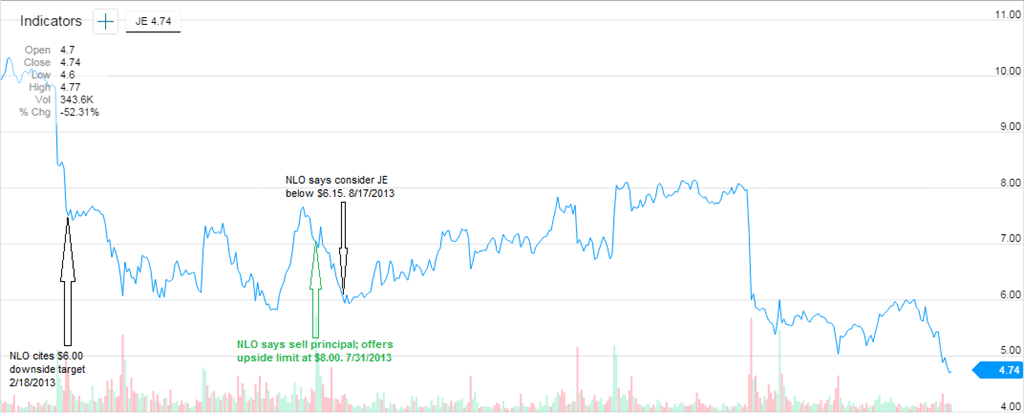
The performance of the September 2013 Watch List severely underperformed the Toronto Stock Exchange which gained +16.99%. A fascination of ours is the performance of a stock that we have covered here at NLO for a short period of time, Just Energy (JE.TO). On February 18, 2013, we said the following of Just Energy:
“On the technical front, Just Energy is fast approaching the 2009 low of $6.60 after breaking below the November 2012 low of $8.00. There appears to be tremendous technical support at the $6.00 level going all the way back to 2003. If you’re interested in this stock, consideration of purchases of Just Energy should be entered into in three phases, once at $6.60, $6.00 and $4.00. Naturally, breaking below $6.00 on the downside suggests that the floor’s the limit.”
Since February 18, 2013, JE.TO fell slightly below our $6.00 target and then took off to the $7.90 level. We recommended that investors consider selling the principal in JE.TO on July 31, 2013. In that July 2013 posting we also said:
“We are resigned to the possibility that $8.00 could be a technical resistance level. Additionally, the $6 support level has moved down to the March low of $5.89. No use getting fancy about exceptional gains as the dividend has already been cut -32% since our February posting (found here).”
As soon as JE.TO fell to the $6.00 level on August 17, 2013, we suggested that JE.TO was worth considering with the following commentary:
“Because JE.TO is trending lower, we recommend reassessing the stock when and if it declines to the $6.15 level. The dividend for JE.TO should not be a consideration for this stock as there are continued risks to the dividend going forward.”
As Just Energy has managed to achieve almost all of our upside and downside targets, we can only refer back to our comments from February 2013 regarding the support level at $4.00. Anyone still interested in this stock should be willing to accept the considerable downside risk. Additionally, the $6.00 level is the new resistance for the stock. If JE.TO were to fall well below the $4.00 level then that would become the new upside resistance. It would take exceptional news to propel the stock above the $6.00 level.

The top five stocks from our watch list last year had the following performance:
| symbol |
Name |
2013 |
2014 |
% change |
| CAR-UN.TO |
Canadian Apartment Properties REIT |
20.44 |
23.41 |
14.53% |
| REI-UN.TO |
Riocan Real Estate Investment Trust |
24.16 |
25.63 |
6.08% |
| CWT-UN.TO |
Calloway REIT |
24.67 |
25.75 |
4.38% |
| FCR.TO |
First Capital Realty Inc. |
17.00 |
17.55 |
3.24% |
| CUF-UN.TO |
Cominar REIT |
19.09 |
18.93 |
-0.84% |
For all of our concern about REITs, they managed to do better than we expected.
Canadian Dividend Watch List
Below is the Canadian Dividend Watch List for September 26, 2014:
Continue reading →