Below is the one year performance of our August 23, 2013 Nasdaq 100 Watch List stocks (8/23/2013 to 8/26/2014):
| Symbol |
Name |
2013 |
2014 |
% change |
| SHLD |
Sears Holdings Corp |
39.6 |
34.67 |
-12.45% |
| EQIX |
Equinix, Inc. |
170.01 |
217.25 |
27.79% |
| TEVA |
Teva Pharmaceutical |
38.3 |
52.22 |
36.34% |
| CHRW |
Robinson Worldwide |
57.2 |
68.45 |
19.67% |
| EXPE |
Expedia Inc. |
48.84 |
87.43 |
79.01% |
| NUAN |
Nuance Comm. |
19.31 |
17.17 |
-11.08% |
| MXIM |
Maxim Integrated |
27.71 |
30.91 |
11.55% |
| BRCM |
Broadcom Corp. |
25.24 |
38.81 |
53.76% |
| ISRG |
Intuitive Surgical |
390.09 |
478.68 |
22.71% |
| NWSA |
News Corporation |
15.75 |
17.62 |
11.87% |
|
|
|
Avg. % change |
23.92% |
|
|
|
|
|
| NDX |
Nasdaq 100 Index |
|
|
30.26% |
The watch list of stocks gained +23% versus a gain of +30% in the Nasdaq 100 Index. The best performing stock, with gains of +79%, was Expedia which was a strong interest stock featured on our July 26, 2013 watch list. At the time, we said the following:
Travel website operator Expedia (EXPE) has suddenly dropped in on our watch list with a –27.38% decline in the stock price on Friday July 26, 2013. We’re not sure that a –28% decline in quarterly earnings requires a –27% decline in the stock price. This type of activity suggests that since June 2012, investors had not sufficiently assessed the prospects of the company before acquiring the stock. Extreme swings in the price indicate that there is more downside risk.
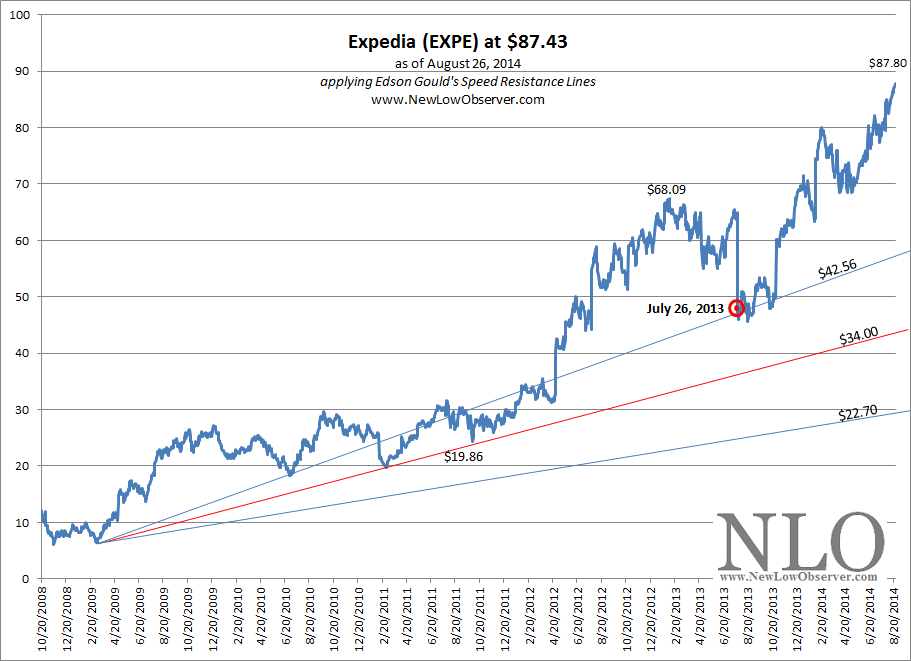
Applying Edson Gould’s Speed Resistance Lines gives us a conservative downside target of $42.56 and an extreme downside target of $22.70.
Our expectation is that there is a good chance that Expedia will decline to the $34 level. Once falling below $34, Expedia should be reviewed on a fundamental basis as a going concern. There may be significant opportunity for this stock as the performance has been in line with industry competitors.
As is often the case, we were too conservative in believing that EXPE would achieve the rising $34.00 level. Instead, EXPE fell exactly to the rising $42.56 level and moved higher from there (updated chart below).

Another strong interest stock in the same July 26, 2013 posting, Equinix (EQIX) also fell only as low as the conservative downside target. From the peak price of $229.02, EQIX spent only four trading days below $158.37. It has been nothing but an uphill climb since.
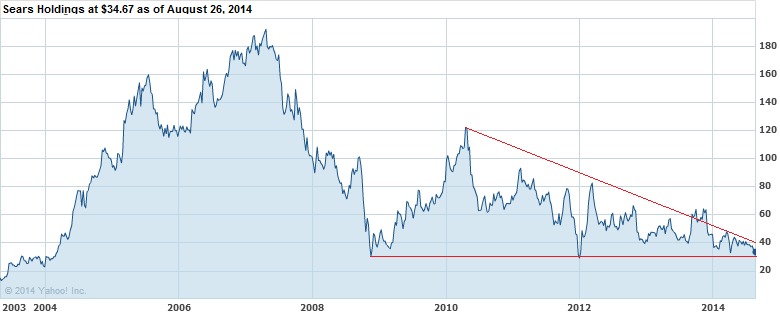
The worst performing stock was Sears Holdings (SHLD). Sears has essentially traded with descending peaks since 2007 with price support at around $30. A break below $30 could result in significant loss for any remaining shareholders. Private equity firms must be circling Sears at the prospect of a decline below the long-term support.

The strong interest stock from the August 23, 2013 watch list was Maxim Integrated Products (MXIM). At the time we said of MXIM:
“The stock of most interest to us is Maxim Integrated Products (MXIM). Maxim has had a great run since our March 20, 2010 highlight of the chip sector as potential investment candidates (found here). In the chart below, since the 2008 trough, Maxim has maintained a consistent ability to rebound from the conservative downside target of $26.97. However, if the stock cannot hold the line at $26.91, then we expect that the stock will fall to the $19.03 level. The extreme downside target is $11.10, however, we don’t expected this to be achieved. Potential investments at the current level along with stepped up amounts of capital at $19.03 and $15.87 is recommended.”
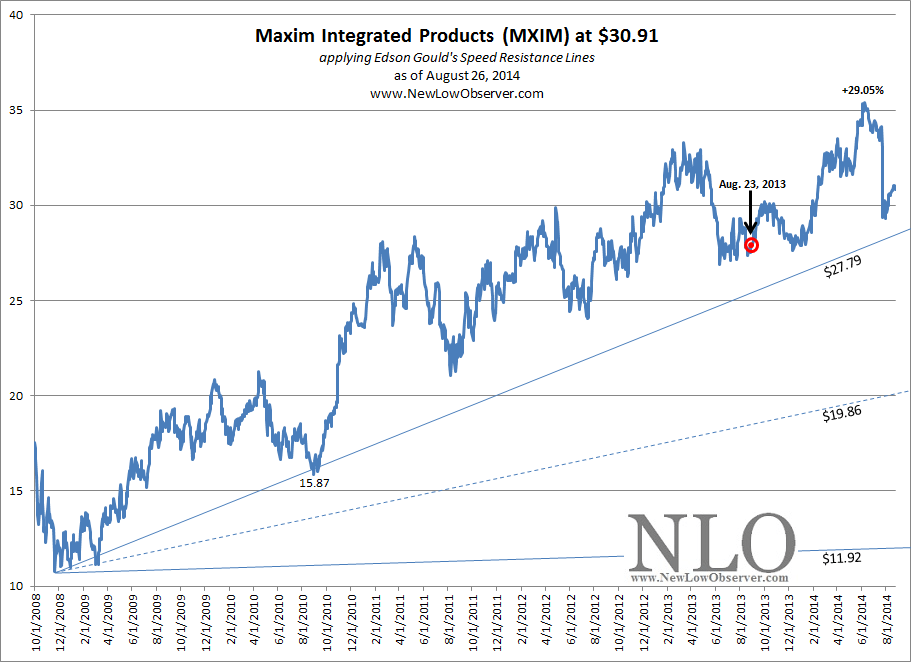
Since August 23, 2013, Maxim increased as much as +29.05% before falling to a 1-year gain of “only” +11%. If we include the dividend of 3.80%, the total return would be +15% for the last year. Below is the updated SRL for MXIM with new conservative and extreme downside targets.

Although Maxim has fallen considerably since the June 2014 peak, we’re only willing to re-consider the stock after falling at or below the rising $27.79 level.
Investment Consideration
To put all of the gains (and losses) into perspective, we like to compare any profits with the historical market return. Below are the annualized compounded annual growth rates (CAGR) for the last 50, 40, 30, 20 and 10 years (adjusted for inflation) [source].
| years |
CAGR |
| 50 |
5.90% |
| 40 |
5.80% |
| 30 |
8.42% |
| 20 |
6.71% |
| 10 |
6.67% |
If an investor can achieve two times (2x) the 30-year CAGR in a single year, it is worth considering alternative investment opportunities while selling the principal and allowing the profits to compound in those stocks that pay a dividend.