Author Archives: nlo-admin

U.S. Dividend Watch List: May 23, 2014

Top Five Watch List Performance Review

In our ongoing review of the NLO Dividend Watch List, we have taken the top five stocks on our list from May 24, 2013 and have checked the performance one year later. The top five companies on that list can be seen in the table below.

Symbol Name 2013 Price 2014 Price % change
WEYS Weyco Group 23.76 27.17 14.4%
CTWS Connecticut Water Service 28.83 31.97 10.9%
NWN Northwest Natural Gas 43.77 44.52 1.7%
FRS Frisch's Restaurants, Inc 16.99 23.66 39.3%
SO Southern Company 45.20 43.08 -4.7%
      Average 12.3%
         
DJI Dow Jones Industrial 15,303.10 16,606.27 8.5%
SPX S&P 500 1,649.60 1,900.53 15.2%

Weyco (WEYS) gain of 14% didn't beat out the market gain of 15% but such performance is exceptional nonetheless. We stated that the stock was range bound and multiple was contracting. Such contraction allowed earnings to catch up and build a support on stock price. While earning fell 4%, multiple by nearly 20% which was the key gain in the stock.

Frisch's Restaurants (FRS) was the best performer on our list with gain of nearly 40%. The key driver was the rise in earning. A quick glance at last year data would suggest that EPS rose by 140% (from $0.66 to $1.60). On a fiscal year basis (ending in May) the company earned $1.35 per share in 2013.

We highlight one important key aspect about the second company on the list, Connecticut Water (CTWS) and that is to be aware of investment made in utilities companies during rising rate cycle. Although Connecticut Water did extremely well considering the circumstances, the majority of utility companies did not. The four utility companies average gain was 0% for the year with Consolidated Edison (ED) as the worse performer declining 7%.

U.S. Dividend Watch List: May 23, 2014

The S&P 500 reached its all time high and closed above the 1,900 mark.  Despite that, we are seeing large number of companies.  At the end of the week, there are 53 companies on our watch list.  Please see below for the complete list. Continue reading

Dow Altimeter Review

As the Dow Industrials meander near all-time highs, it is necessary to review Edson Gould’s Altimeter for the index.

Continue reading

Dow Theory

On September 30, 2013, we posted our Dow Theory analysis.  In that assessment, we acknowledged that our June 2013 review of Dow Theory was incorrect.  Additionally, we pointed out the importance of using Dow Theory as an asset allocation tool rather that a strict “buy” or “sell” indicator.  A couple of excerpts appear below:

“Since June 21st, as indicated in the chart below, the Dow Industrials and Dow Transports have managed to achieve successive new highs in early August 2013 and mid-September 2013.  In addition, the call for a bear market came slightly before the bottom in the market in late June 2013.”

“In short, we use Dow Theory indications as asset allocation signals rather than strict buy/sell signals.”

Accepting the reality that we were not in a bear market was challenging.  However, realizing it in enough time, along with the fact that Dow Theory is used as an allocation tool, has spared us excessive losses and/or missed opportunities.

Traditional Dow Theory

Recently Dow Theory has registered a confirmation of the bullish trend.  On May 12, 2014, the Dow Jones Industrial Average confirmed the new highs in the Dow Jones Transportation Average.  In fact, on the same day, both indexes made new all-time highs.

image

That this is still a bull market requires a review of various factors that could be at play, both positive and negative.  As an example, already the Dow Jones Industrial Average has increased +151% since the March 9, 2009 low.  The amount of the increase is less than the average for the period of 1836 to 1914, a time when the Federal Reserve never existed.  As stated in the article titled “Is the Fed Responsible for the Stock Market Rise Since 2009?” the average increase when the Federal Reserve didn’t exist was +167%.  This suggests that the current rise may have some room to go on the upside.

Dow Theory Reconsidered

There are many who follow the traditional Dow Theory which is really a refined version of William Peter Hamilton’s writings from his Wall Street Journal and Barron’s newspaper columns as well as his book Stock Market Barometer.  The theory itself is generally sound.  More often than not it is the interpreter of the theory that gets it wrong.  However, we can’t help but feel it necessary to point out the specific words of Charles H. Dow which possibly leads to a market theory slightly different from what the legions of modern Dow Theorists are willing to accept.

The following excerpts from the Wall Street Journal outline Dow’s theory on the role of the industrials as it originally was stated:

“This is preeminently the period of industrial speculation, yet the creation of industrial stocks has become pronounced only within a year.”

“…it follows that there must be a very strong body of [venture] capitalists prepared at present to resist anything like a collapse in the industrial market and to promote by every means in their power firm or advancing prices for the market as a whole.  and this effort on their part is being powerfully supported by the excellent conditions of practically all branches of trade.”

Dow, Charles H. Review and Outlook. Wall Street Journal. April 22, 1899.

Our interpretation of the preceding quotes is that industrial stocks were, in 1899, considered to be the equivalent to modern small cap stocks which are more speculative in nature and often prone to manipulation and collapse.  The best confirmation of this concept is found in the following New York Times quote:

“Our London correspondent, in yesterday’s Financial Supplement, gave expression to the feeling which the English investor or speculator very naturally has as to the securities that usually go under the title of industrials in our markets.  It is one of distrust and hesitation.  It would be very strange if it were not.

“As to the investor, we suppose that no one on this side of the water would claim that our industrials, taking them ‘by and large,’ the older with the new, the more solid with the more inflated, can be regarded as ‘investment’ securities.”

New York Times. “The Industrials and The Boom”. March 14, 1899. page 6.

By most measures, the New York Times article, from one month earlier in 1899, confirms our view that industrial stocks were of low quality.  Now we need to see what Dow intended for the role of transportation and industrial stocks.

“…railway [transportation] stocks generally occupy a position much stronger than that held by the industrials.”

“The growth of the business of the country accrues on the old stocks [transportation stocks].  The Industrial list occupies an entirely different position.  There has been a very large creation of securities [initial public offerings].  Stocks have been bought on very limited information as to the value of the property acquired.  Attack of these stocks brings selling from those who know little in regard to the worth of what they have bought; also from those who got in at low figures [company insiders] and who propose to get out as well as they can.  This is the ideal condition for bear attacks, checked only by the possibility of not being able to borrow stock [for short selling].  The thoughtfulness of promoters [investment banks] in providing ample capital relieves this danger to great extent and will relieve it altogether when the new Industrials come to be distributed.”

Dow, Charles H. Review and Outlook.  Wall Street Journal. May 31, 1899.

Our views is that Dow’s theory was intended to be based on blue chip high quality stocks to be compared against small cap speculative stocks.  At the time, railroad stocks were the “old stocks” that had a blue chip status while the industrials were the newer [non-railroad] more speculative stocks.  We no longer live in a world where railroad stocks dominate the landscape of companies to invest in. Also, transportation stocks generally don’t provide consistent and/or rising dividend payments as was the case of railroad stocks in the last quarter of the 1800’s.

What would be the equivalent indexes of Dow’s comparison between old blue chip stocks to newer more speculative stocks? We believe that the Dow Jones Industrial Average qualifies as the blue chip barometer and the Russell 2000 small cap index qualifies as the speculative barometer.  Using all of the other elements of Dow Theory except for the Dow Jones Transportation Average, we believe that we would be following Dow’s theory exactly as it was intended.

Just to reiterate, Dow was not specifically concerned with the comparison between industrial stocks because they made the goods and transportation stocks because they shipped those same goods, a popular and logical story that is expounded on what Dow had intended.  However, based on the quotes above, we believe Dow was comparing companies of older blue chip quality that were well established and could be relied upon for their dividends in contrast to newer companies with little in the way of verifiable earnings, nascent but unstable dividends and highly susceptible to manipulation (i.e. small illiquid stock).

If we look at a comparison between the Industrials and the Russell 2000 index, the picture is very different from the confirmation of the bullish trend in the review of the transportation and industrial index above.

image

As can be seen above, while the Dow Industrials has managed to exceed the previous peaks of December 2013 and April 2014, the Russell 2000 has not been able to exceed the peak of March 2014.  Under the rules of Dow Theory, this would be considered a non-confirmation of the rising trend.  However, this does not signal a new bear market.  Instead, it only suggests that investors remain cautious about new investments.

A bear market would be signaled if the Dow Industrials and Russell 2000 were to simultaneously decline below the previous retracement levels during the rise from the March 2009 low to the current market levels.  In the chart above, the initial warning would come if the Russell 2000 and Dow Industrials declined below their respective February 2014 lows.

U.S. Dividend Watch List: May 17, 2014

Top Five Watch List Performance Review

In our ongoing review of the NLO Dividend Watch List, we have taken the top five stocks on our list from May 17, 2013 and have checked the performance one year later. The top five companies on that list can be seen in the table below.

Symbol Name 2013 Price 2014 Price % change
WEYS Weyco Group 23.86 25.90 8.5%
FRS Frisch's Restaurants, Inc 16.90 23.51 39.1%
CTWS Connecticut Water Service 29.03 31.87 9.8%
AROW Arrow Financial Corp. 24.84 25.27 1.7%
NWN Northwest Natural Gas 44.90 44.58 -0.7%
      Average 11.7%
         
DJI Dow Jones Industrial 15,354.40 16,491.31 7.4%
SPX S&P 500 1,667.47 1,877.86 12.6%

We didn’t make specific highlights on any companies from the list.  The market pushed to its all-time high last year providing us with little opportunity to invest.  Despite this fact, our top five managed a double digit gain and nearly matched that of the S&P 500.  If we were to include the performance of John Wiley (JW-A), our average again would be +16.5% as John Wiley returned +40%, excluding dividends, in one year.

U.S. Dividend Watch List: May 17, 2014

When the market reached its peak last year, there were only 6 companies on our list.  This time around, there are 56 companies!  We don’t have any definitive answer to why this has occurred.  The implication of this, however, is that it could be a bearish sign.  Despite all this, we believe there are great companies to start researching for long-term investment and income opportunities.  Below are the 56 companies on our watch list.

Continue reading
Transaction Alert

On May 12, 2014, we carried out the following transaction(s) in our partnership:

Nasdaq 100 Watch List: May 9, 2014

Below is the watch list of stocks that we are following from the Nasdaq 100 Index.

U.S. Dividend Watch List: May 9, 2014

Top Five Watch List Performance Review

In our ongoing review of the NLO Dividend Watch List, we have taken the top five stocks on our list from May 10, 2013 and have checked the performance one year later. The top five companies on that list can be seen in the table below.

Symbol Name 2013 Price 2014 Price % change
IBKC IBERIABANK Corp. 46.80 62.01 32.5%
WEYS Weyco Group 23.68 25.41 7.3%
CTWS Connecticut Water Service 28.74 32.38 12.7%
FRS Frisch's Restaurants, Inc 16.90 23.55 39.3%
AROW Arrow Financial Corp. 24.69 25.54 3.4%
      Average 19.1%
         
DJI Dow Jones Industrial 15,118.49 16,583.34 9.7%
SPX S&P 500 1,633.70 1,878.48 15.0%

Iberiabank (IBKC) had a tremendous run over the last year.  Below is the commentary we made last year.

The company’s book value has increased at an annual rate of +11.5% over the past five years while the dividend has risen at +6% annually over the same period.  Countering the positives, earnings per share has fallen from the peak in 2006 at $3.57 to the bottom in 2009 at $0.19.  The current earnings per share is $2.59, which far from the bottom in 2009.  The company never cut its dividend through the credit crisis but it has yet to increase their payout.  The stock trades at a 10% discount to its book value and yields 2.9%.

The company’s dividend payment has remained unchanged at $1.36 per share.  Anyone who purchased shares at the 10% discount to book value would have done well as shares are now trading at 17% above book value.

Weyco (WEYS) was second on our list and did relatively well.  We highlighted the worrisome trend in the underlying fundamentals of the company.  Growth has slowed tremendously in both sales, profits, and cash flow.  The market appeared to be pricing in these factors.

U.S. Dividend Watch List: May 9, 2014

Minor divergence occurred between the blue-chip and the overall market as the Dow rose +0.4% compared with the S&P 500 falling -0.2%.  Below are 22 companies that are in our watch list this week.

Continue reading

Gold Stock Indicator: May 9, 2014

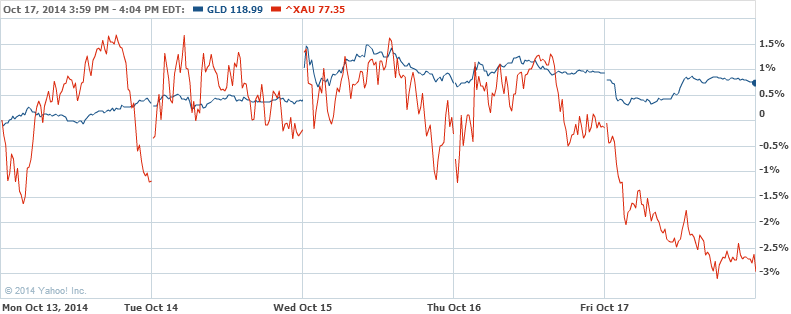
This week there was a lot of downside action for the price of gold and gold stocks as represented in the chart below.

image

The gold ETF declined –1.86% while gold stocks fell –4.51%.  The good news is that gold and gold stocks have traded in a range for the last year.  The bad news is that gold and gold stocks cannot seem to break above the previous peaks in that same one year range.

Quick Take: Coach

“The story has long been told of the steel magnate who looked out of his office window at the rows of smoking factory chimneys, contemplated the healthy pile of unfilled orders on his desk, sent a memorandum to his production assistant to hire a hundred more men, and called his stockbroker to sell all the stocks he owned.  ‘Are you crazy or something?’ asked the broker.  ‘No,’ came the reply.  ‘In all my years the future for our business has never looked as good as it does right now.  Therefore I must assume that from now on it can only look worse.’

source: Harry, Schultz D. Bear Markets, How to Survive and Make Money in Them. Prentice-Hall, New Jersey. 1964.  page 5.

Continue reading

Buffett’s Berkshire Hathaway Buys SNC-Lavalin Unit

On May 1, 2014, it was announced that Berkshire Hathaway Energy would buy SNC-Lavalin’s AltaLink unit for $3.2 billion in cash. As indicated at Bloomberg.com (found here), “…the deal adds 280 substations and about 12,000 kilometers (7,500 miles) of transmission lines…”

On April 2, 2012 (found here), we said the following of SNC-Lavalin (SNC.TO):

“Our next stock is SNC-Lavalin (SNC.TO).  According to Yahoo!Finance, SNC.TO “provides engineering and construction, and operations and maintenance services worldwide.”  Edson Gould’s Altimeter, as applied to SNC-Lavalin Group (SNC.TO) presents a pattern that is quite unique.  Again, Edson Gould’s Altimeter compares the current stock price as it relates to the quarterly dividend that is currently being paid.  SNC.TO has a descending Altimeter with the normal undervalued range at $43.60.  The next upside target for SNC.TO is at $55, however, we’re waiting for resolution on the potential downside action.

image

“Our worst case scenario is that SNC.TO will continues on the declining trend and reach our downside target of $30.80.  In our assumption, the worst case downside target continues to slide as time passes until proven otherwise.  Again, while there are major upside targets at $55 and $69, we’d rather wait for the final verdict on retracing back above $43.60 or falling to $30.80.”

At the time, we believed that SNC-Lavalin was undervalued but with some room to decline further.  Unfortunately, the lowest SNC-Lavalin declined was to $35.04 on September 4, 2012.  We had projected that SNC-Lavalin, in the worst case scenario, could decline –24.41% instead of –14%.  We were wrong about the extent of the worst case on the downside.

image

As we fast forward to May 2, 2014, we see that Warren Buffett and company are finding value in the purchase of the AltaLink unit of SNC-Lavalin.  However, this interest in AltaLink comes after SNC-Lavalin’s stock price has risen +27% since our 2012 coverage.

Gold Stock Indicator: May 2, 2014

Another trendless week for the price of gold and gold stocks.

image

Below is the updated XAU Gold Stock Indicator (GSI):

Quick Take: NetApp

"...a shifty eyed guy with a cheap suit and scoffed shoes may commit a lot of crimes but a Ponzi scheme is never going to be one of them.  Ponzi schemers are by definition done by people who seem trustworthy, if they’re not they can’t even start.  The can’t pull it off.  So, people who think they would instantly recognize a crook like Bernie Madoff, are deluding themselves.  That’s one of the dangerous lies we tell ourselves.  They’re going to look like responsible respectable people.”

Brinker, Bob. Money Talk; Diana Henriques author of Wizard of Lies. July 17, 2011. partial transcript

NetApp (NTAP)

The last time that we did a write-up on NTAP, as the price was in the declining phase, was January 20, 2012 (found here).  At the time, we said the following:

“After a 39% decline in price, NetApp (NTAP) is a prime candidate for a two transaction  purchase.  The first purchase should take place starting at $30.  The second purchase should take place around $23.47.”

NTAP was trading at $36.85 and ultimately fell as low as $26.33, which was a total decline of –55% from the prior peak set on February 7, 2011.  After NetApp fell below $30 on May 24, 2012, a purchase at or below $30 would have resulted in gains of +53% by September 2013 or +57% by January 2014.  The gains mentioned were 25% and 16%  greater than that of the Nasdaq 100 Index from the May 24, 2012 closing price, respectively.

image

Continue reading

Quick Take: Bed Bath and Beyond

“I put heavy weight on certainty…if you do that, the whole idea of a risk factor doesn’t make any sense to me. You don’t do it where you take a significant risk.  But it’s not risky to buy securities at a fraction of what they’re worth.” –Warren Buffett

source:

  • Jim Rasmussen, “Buffett Talks Strategy with Students,” Omaha World-Herald, January 2, 1994, p. 17s.
  • Lowe, Janet. Warren Buffett Speaks. John Wiley & Sons, New York. 1997. p. 105.

Bed Bath and Beyond (BBBY)

In our opinion, this stock could be a tale of two charts.  The first chart compares the performance of the stock price from 2000-2008 and 2008 to the present.  If the period from 2000 to 2008 is any guide, the price of BBBY may have more room on the downside.

Interestingly, the two periods are almost to scale and the period when the stock price peaked (so far) has been within days of each other.  If BBBY were to decline by the same percentage of –63.30%  from the previous peak, the stock price would decline to $29.78.

image

Continue reading

Nasdaq 100 Watch List: April 25, 2014

Watch List Performance Review

Below is the performance of the stocks from our April 26, 2013 watch list (found here):

Symbol Name % change
BIDU Baidu, Inc. 91.61%
EXPD Expeditors International. 13.07%
FFIV F5 Networks, Inc. 39.51%
TEVA Teva Pharmaceutical 26.30%
ALTR Altera Corp. 6.06%
GRMN Garmin Ltd. 56.22%
ISRG Intuitive Surgical, Inc. -24.73%
AVGO Avago Technologies Limited 94.15%
AAPL Apple Inc. 37.09%
WFM Whole Foods Market, Inc. -42.84%
CTXS Citrix Systems, Inc. -3.85%
  Average 26.60%

The performance of the entire watch list exceeded the Nasdaq 100 Index gain of +24.38% over the last year.  However, the top five stocks from the above list had an average gain of +35.31% and is charted below:

image

The ability of the top five stocks to exceed the Nasdaq 100 Index can be solely attributed to the performance of Baidu (BIDU).  Without the performance of Baidu, the remaining four stocks would have averaged a gain of +21.24%.  However, at the time, we said:

…all indications, based on the SRL, are that Baidu is worth considering in a two stage purchase plan, once at the current level and again at $67 or lower.” 

The opportunity to purchase Baidu at $67 or lower never arrived.  Making recommendations of a stock simply because the price had declined isn’t easy.  However, all fundamental AND technical indications were suggesting that Baidu was worth considering, at the time.

Nasdaq 100 Watch List: April 25, 2014

Below are the 14 Nasdaq 100 stocks that we think are worth your consideration:

Gold Stock Indicator: April 24, 2014

Since April 4, 2014, the price of gold has continued to vacillate in a range of +/- 1%.  Likewise, gold stocks have traded in a range of +/- 3%.

image

Below is the updated XAU Gold Stock Indicator: