Author Archives: nlo-admin

Qualcomm Chokes and Other Thoughts

On January 29, 2015, Qualcomm (QCOM) announced that a “…key customer passed on new chip…”  On the news, QCOM stock fell as much as –12%.

Royal Gold: SRL Update

On October 12, 2012, we posted the following SRL for Royal Gold:

image

We said the following of the above chart:

“The SRL for Royal Gold at $44.62 doesn’t seem outlandish given what has already occurred in the previous declines from prior peaks.  The X marks the first decline after a “minor” parabolic move that was later exceeded on a larger scale to point A1, B1 and C1.  Additionally, the  X reflects the minimum retracement from the top and has provided consistent support for the price for RGLD.

“We’d consider buying RGLD if it declines to either of the support levels of X3 or C2.  The movement of RGLD has been consistent with the price of gold (GLD) which is in stark contrast with gold stocks as represented by the Philadelphia Gold and Silver Stock Index (^XAU)....”

On July 12, 2013, we said the following of RGLD:

“RGLD has fulfilled almost all of our expectations for downside risk since October 2012.  Although we’d much rather see this stock reach the extreme downside target of $33.28, we feel that purchases at the current level and below would be consistent with asset accumulation and wealth building, in contrast to those who were considering the stock at or near the October 2012 levels.”

So far, Royal Gold has adhered to the SRL outlined on October 12, 2012 and July 12, 2013 as displayed in the chart below.

image

Royal Gold has a mid-range upside target of $100.39 and an extreme upside target of $133.85 based on Gould’s Speed Resistance Line.  However, the upside targets are somewhat immaterial when considered from the context of buying based on values.

Clean Harbors Update

On February 9, 2012, we posted Edson Gould’s Speed Resistance Lines (SRL) for Clean Harbors (CLH) with the downside risk for the stock.  At the time, the downside targets were:

  • $43.53 (conservative downside target)
  • $31.00 (mid range)
  • $22.53 (extreme downside target)

Since that time, we’ve revised the downside targets to reflect the following minor changes.

  • $43.97 (conservative downside target)
  • $33.70 (mid range)
  • $23.43 (extreme downside target)

A visual of the downside targets reveals the value of Gould’s SRL.

image

So far, CLH has adhered to the SRL that was initially outlined in 2012.  If we consider the period of 2007 to 2009, when the stock fell as low as $20.54 and extend that same decline to the current period, then CLH could decline as low as $41.40.  This assumption is predicated on the stock market not experiencing a precipitous decline from the current level.  A broad market decline would easily bring CLH to the ascending $23.43 level in the SRL. 

While the fundamentals are not glowing for CLH as it goes through the process of spinning off its oil and gas services unit, which could “…take more than a year for the spinoff to be completed…”, there are expectations that the current actions will refocus the company.

Speculators, those willing to accept the downside risk of –36%, could purchase CLH with 25% of intended funds at $45.10 and $41.40.  The final purchase would be at $31.00 or below.  Investors, those willing to hold for 5 years or more, would want to re-assess CLH at $34 and below.

Nasdaq 100 Watch List: January 23, 2015

U.S. Dividend Watch List: January 23, 2015

Top Five Watch List Performance Review

In our ongoing review of the NLO Dividend Watch List, we have taken the top five stocks on our list from January 24, 2014 and have checked the performance one year later. The top five companies on that list can be seen in the table below.

Symbol Name 2013 Price 2014 Price % change
PM Philip Morris International 81.50 82.82 1.6%
TGT Target Corp. 57.72 75.29 30.4%
T AT&T Inc 33.42 33.37 -0.1%
MCD McDonald's Corp. 94.43 89.56 -5.2%
WRB W.R. Berkley Corporation 40.18 49.90 24.2%
      Average 10.2%
         
DJI Dow Jones Industrial 15,879.11 17,672.60 11.3%
SPX S&P 500 1,790.29 2,051.82 14.6%

Watch List Review

Our top five kept pace with the Dow but lagged the S&P 500 by 4%. The best performer was Target (TGT). The stock was under tremendous pressure a year ago after the data breach but our team believed that it was a one-time event and took a sizable position. Expectations for Target were so low at the time that we believed all the bad news was priced into the stock.

The worst performer was McDonald (MCD) seemingly due to a drop in earnings by -8% in 2014. However, analyst estimate that net income will rise by +10% going forward, from $4.82 to $5.32. That places a forward P/E at 17x 2015 earnings.

An insurance company, W.R. Berkley (WRB), did well with a gain of +24%. Net income rose +21.5% for the year but what may have propelled the stock higher was the special dividend paid out at the end of 2014.

U.S. Dividend Watch List: January 16,2015

Although a volatile week, it turned out to be a great one for the bulls. The market had a solid gain of +3%. Despite the move higher, there are virtually the same number of companies on our watch list as last week. Pockets of weakness can be seen in several sectors on our list. Below are 27 companies on our watch list. Continue reading

Gold Stock Indicator: January 23, 2015

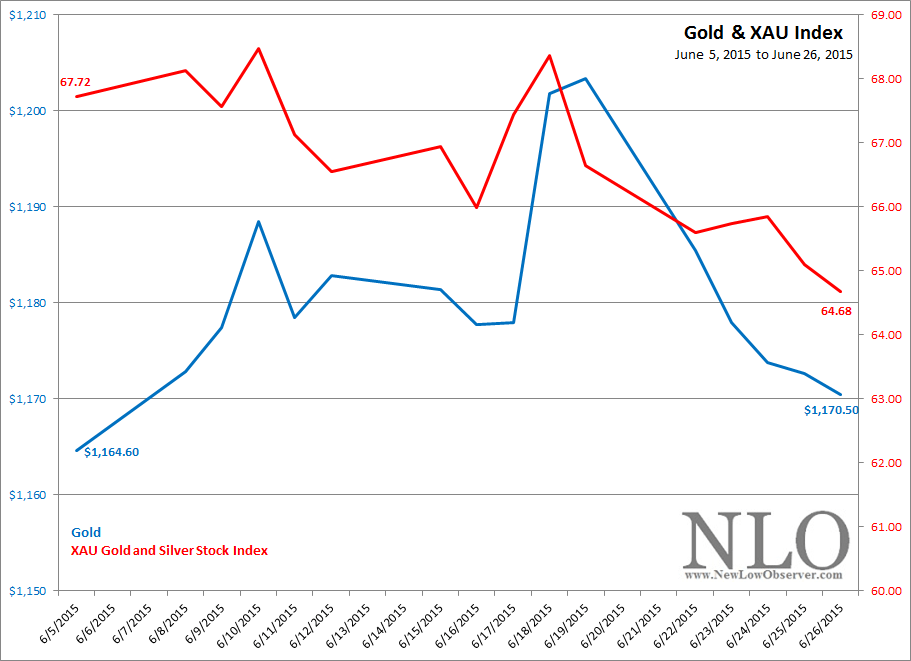
Gold, as represented by the SPDR Gold Shares (GLD), increased +1.89% this week while the Philadelphia Gold and Silver Stock Index (XAU) declined by-0.18%.  On a closing basis, each index made new highs this week.  However, some ground was given up on Friday.

image

2014 Performance Review

Below is a chart of how our investment portfolio performed against the S&P 500 index and the 30-year Treasury based on the January 2, 2014 rate (found here).

image

Analyst Estimates: U.S. Dividend Watch List

Below are the price projections based on analyst earnings estimates for the stocks on our recent U.S. Dividend Watch List dated January 16, 2015.  These estimates project the price change for the respective stocks by the end of 2015.

U.S. Dividend Watch List: January 16, 2015

Top Five Watch List Performance Review

In our ongoing review of the NLO Dividend Watch List, we have taken the top five stocks on our list from January 17, 2014 and have checked the performance one year later. The top five companies on that list can be seen in the table below.

Symbol Name 2013 Price 2014 Price % change
TGT Target Corp. 60.24 74.94 24.4%
PM Philip Morris International 83.33 82.70 -0.8%
T AT&T Inc 33.70 33.80 0.3%
TEG Integrys Energy Group Inc 53.64 80.59 50.2%
ED Consolidated Edison 53.96 69.10 28.1%
      Average 20.4%
         
DJI Dow Jones Industrial 16,458.56 17,511.57 6.4%
SPX S&P 500 1,838.70 2,019.42 9.8%

Watch List Review

Our top five outperformed the market by a wide margin. The biggest contribution came from the utility sector. The search for yield has driven shares of Integrys Energy (TEG) and Consolidated Edison (ED) up by +50% and +28%, respectively. Interestingly, shares of Philip Morris (PM) and AT&T (T) which yielded above 4.5% didn't fair too well and were virtually flat for the year. Another exceptional performer was Target (TGT) which was hit with bad news about a data hack, at the time. As we mentioned one year ago, we believed the news provided long-term investors with great opportunity to buy shares at discount.

U.S. Dividend Watch List: January 16,2015

It was a tough week to navigate the market as volatility spiked with surge in Swiss Franc which took the market by surprise. The Swiss Franc jumped by nearly +30% against the euro and +18% against the dollar after the Swiss National Bank's decision to eliminate the cap it placed on the value of the Franc. We believe that a "black swan" type of event such as this creates volatility in favor long-term investor. At the end of the week, there are 89 companies to search through. However, we've filtered out some companies and have displayed 39 below. Continue reading

Gold Stock Indicator: January 16, 2015

If you like excitement and intrigue then invest in gold.  However, if you want a heart pounding adrenaline rush then try investing in gold stocks.  This past week, gold did nothing but go up, closing out the week with a gain of over +4%.  Gold stocks, on the other hand, tested the fortitude of investors by falling more than –6% but eventually closing up nearly +3%.

image

The recent surge of gold was due to the Swiss National Bank’s decision to remove the cap on the Swiss Franc.  Many are calling the Swiss decision a turning point in the bear market for gold.  However, we’d want to remind investors that the turning point, if in fact it is the ultimate low for gold, was on November 5, 2014.  That was the time and place when the low was established before increasing in value.

image

Bitcoin Plunges, Downside Target $125

On January 14, 2015, Bitcoin declined as low as $170 per U.S. dollar.  This comes three months after our October 7, 2014 article titled, “Bitcoin: Speculators Unite…” in which we proposed the following:

“with an increase in price from $99.81 to $1,147.25, participants should always step back and reassess the situation.  The reason why is because there have been few instances where a parabolic increase in price is sustained in the form of a new plateau.  With this consideration in mind, we believed that the prospects of the downside targets, dismal as they seemed at such heights, were a distinct reality.”

However, the nature of the October 7, 2014 piece implied that the price of Bitcoin was headed higher.  Little did we know that the actual trajectory would be a continuation of the declining trend.  Since the October 5th low, Bitcoin was only able to increase by as much as +33.66%.  Ultimately, the decline that ensued since October 5th has equaled –43.23%.

Below is the Edson Gould’s Speed Resistance Lines for Bitcoin with an updated chart.

image

All we can say is that the worst case scenario of $125 was always a distinct possibility.  A decline to the $125 level is now well within reach as the market for Bitcoin goes into panic mode.

Canadian Dividend Watch List: January 13, 2015

Performance Review

Below is the performance of the stocks found on our January 15, 2014 watch list.

Symbol Name 2014 2015 % change
FTS.TO Fortis Inc. 30.41 39.29 29.20%
CUF-UN.TO Cominar REIT 18.43 19.31 4.77%
D-UN.TO Dundee REIT 29.63 26.72 -9.82%
FCR.TO First Capital Realty Inc. 17.45 19.5 11.75%
CWT-UN.TO Calloway REIT 25.32 30.14 19.04%
REI-UN.TO Riocan REIT 24.98 28.86 15.53%
ESI.TO Ensign Energy Services Inc. 16.22 9.44 -41.80%
CAR-UN.TO Canadian Apt Properties REIT 21.51 27.12 26.08%
EMA.TO Emera Incorporated 31.17 39.44 26.53%
TA.TO TransAlta Corp. 13.95 10.85 -22.22%
LB.TO Laurentian Bank of Canada 46.29 47.49 2.59%
CU.TO Canadian Utilities Ltd. 36.65 41.69 13.75%
Average 6.28%

At the time, we re-ranked the stocks based on the projected price change using analyst earnings estimates.  In our analysis we said the following:

“Through a process of elimination, we would start with the stocks that are expected to decline the most in value over the next year.”

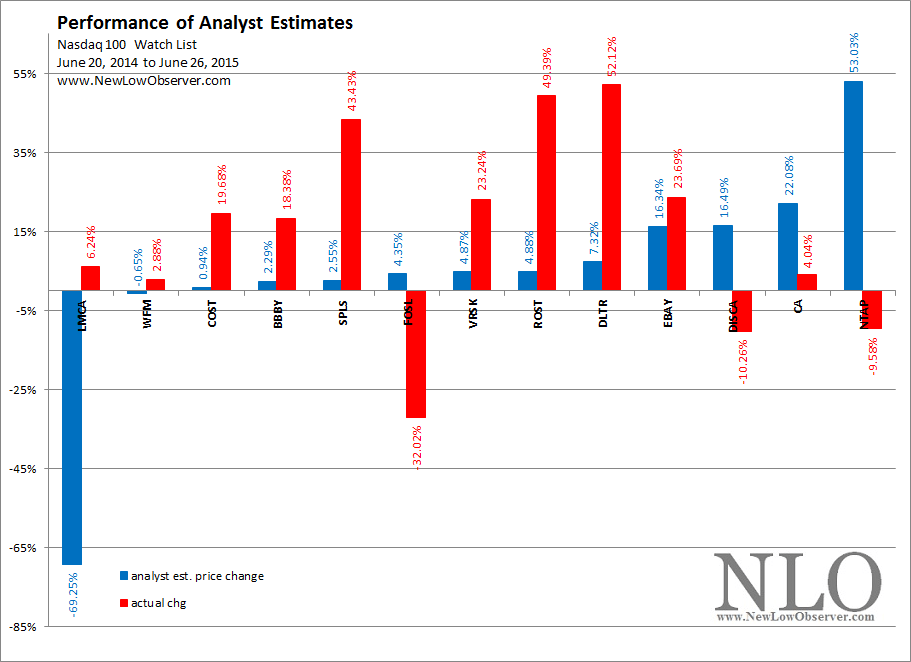
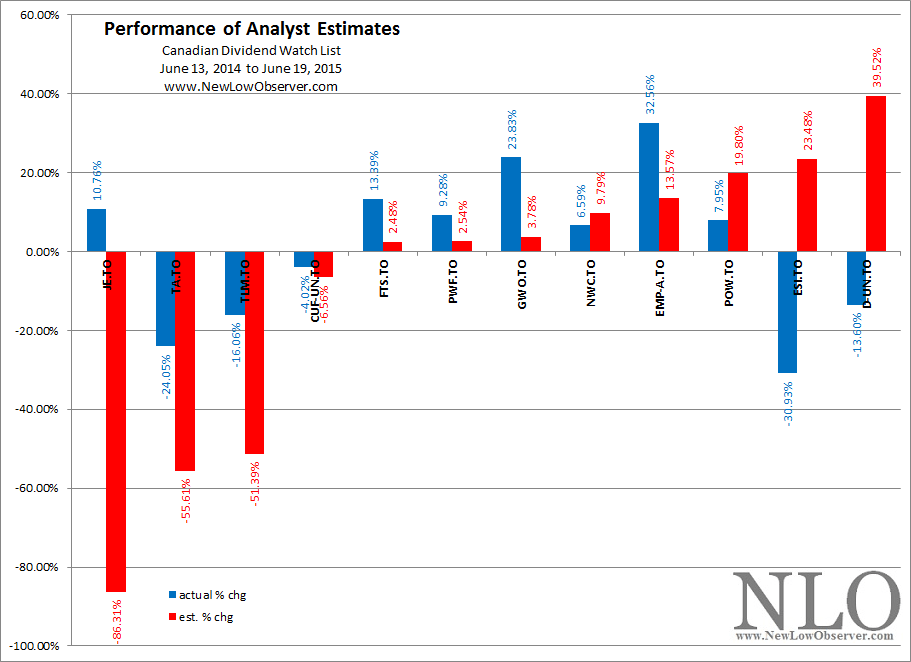
The chart below shows how the analyst estimates in blue varied dramatically compared to the actual performance in red after a year.

image

Again, the analyst estimates of earnings and our projections indicate that analysts will typically over-estimate the upside and downside prospects for a company.  In addition, analysts often mirror the current market sentiment for a company rather than take a view that comes in conflict with prevailing “wisdom.” In many respects, this allows for better anticipation of company prospects, provided the market retains its bullish mood.

Canadian Dividend Watch List: January 13, 2015

Below are the thirteen Canadian companies that are on our radar with the analyst estimates for the coming year.

Analyst Estimates

Below are the price projections based on analyst earnings estimates for the stocks on our recent Nasdaq 100 Watch List dated January 9, 2015.  These estimates project the 1 year price change for the respective stocks.

Consequences of Falling Oil Prices

Economic events never occur in a vacuum.  Usually there is a string of events that leads from one event to another. One big event can lead to an even bigger event that overshadows the prior calamities that triggered “The Big” event.  The February 9, 1983 issue of Richard Russell’s Dow Theory Letters covers  one market event that led to two major crises that happened at different periods in time.  The two events are joined at the hip based on the decline of oil prices.  This led two separate major bailouts that resulted in the structural shift in the way our brand of capitalism works.

The first event resulted in the Savings and Loan Crisis (S&L Crisis) and is thought to have begun in 1986 due to the Tax Reform Act of 1986 culminating in the bailout of many banks and the eventual bankruptcy of the Federal Savings and Loan Insurance Corporation (FSLIC).

The second event resulted in the Mexican Peso Crisis with the outcome that major banking institutions like Citibank and Goldman Sachs needed to be bailed out.  It is important to note that the Peso Crisis is considered to be as a result of the peso devaluation in 1994.

The true roots of both the S&L Crisis and the Peso Crisis is the decline of oil prices after the inflationary peak in 1980-1981.  Richard Russell’s Dow Theory Letter Issue 854 highlights the seeds of destruction that were going to be much larger than even Russell could have imagined. However, if anyone wishes to understand how the snowball got rolling then this issue highlights the beginning.

The very first quote is an amazing insight of the American dependence of the high price of oil, Richard Russell says the following:

“We’re facing a situation (ironically) where the US is all for holding oil prices at a high level. The banks have lent huge sums of money both to private corporations and to oil producing nations-loans based on rising oil prices. If the oil price cracks badly,  the banks are going to have major problems. On top of that, the US depends on oil taxes (so called “excess profits” tax) for huge chunks of tax income. If oil prices crack then the profits for the oil companies will dive (which they are already doing) and the tax short-fall will be horrendous. (page 1)”

This commentary is staggering in the fact that it was so prescient.  The cracks in the armor of the American oil industry began in Texas when the easy money stopped raining down on oil dependent cities like Houston and Dallas.  In a 1988 issue of Dow Theory Letters, Russell had the following to say:

“With oil prices caving in, Texas now has more people leaving the state than coming in.( Dow Theory Letters. March 9, 1988. page 6.)”

The decline in oil prices led to a decline of jobs for that industry which resulted in a decline in real estate prices as people left the state of Texas.  Loans made by savings and loan institutions in the southwest U.S., to businesses and real estate investors, all went bad at the same time leading to the Savings and Loan Crisis (S&L Crisis).  The S&L Crisis cost several hundreds of billions of dollars and still exist as an off-budget item as part of our national debt.

The decline in the price of oil also crushed foreign economies dependent on the commodity.  The Mexican Peso Crisis, although officially listed as beginning in 1994, had its roots in the early 1980’s.  The natural outcome of this crisis was the bailout of large banking institutions like Citibank and Goldman Sachs when the government stepped in and bought the bad debt held by the bank’s all in gamble.

Likewise, the current boom in commodity rich countries (although somewhat cooler at present) like Australia, Brazil, Russia, China and India could experience significant shocks to their system depending on the level of loans made as “investments” by foreign banking institutions based on the potential of future growth.

Few understood or believed the impact and importance of high oil prices to the American economy at the time.  Even fewer understood the direct reliance of the U.S. government to high oil prices.  Investors should watch for the potential fallout that may arise from the recent precipitous decline in the price of oil.  The troubles afflicting Russia and Brazil’s Petrobras may be early indications of where the pain may be felt.

Nasdaq 100 Watch List: January 9, 2015

Performance Review

Below is the performance of the seven stocks from the January 10, 2014 Nasdaq 100 watch list compared to the performance of the Nasdaq 100 Index in the last year.

Symbol Name 2014 2015 % change
ALTR Altera Corp. 31.47 36.96 17.45%
SHLD Sears Holdings 36.71 34.3 -6.56%
GOLD Randgold Resources 61.57 74.91 21.67%
MXIM Maxim Integrated Products 28.15 32.99 17.19%
CHRW CH Robinson Worldwide 57.7 72.06 24.89%
EBAY eBay Inc. 52.16 55.63 6.65%
FAST Fastenal Company 47.7 45.99 -3.58%
  Average change 11.10%
         
  Nasdaq 100     18.18%

As a group, the stocks on our list underperformed the Nasdaq 100 by a wide margin. The first five stocks on our list averaged a gain of +14.92%.  Two stocks that we took positions in at the time were Altera (ALTR) and Randgold (GOLD).

Analyst Review

The chart below is what the analysts suggested the stocks would do…

image

…This is the graphical representation of what actually happened.

image

The observation of the data should be clear, the analysts expected declines for the coming year and the opposite occurred.  The projections were that Randgold (GOLD) would decline by nearly –50% and the stock increased by +21.67%.  From our perspective, the analysts provide a reasonable sound board for what to anticipate, as has been demonstrated with our Canadian and U.S. Watch Lists.

Nasdaq 100 Watch List: January 9, 2015

Below are the nine Nasdaq 100 companies that are on our radar.