On February 23, 2015, we executed the following transactions:
- Japan
- Market Indicator
- Price Momentum Indicators
- Richard Russell
- Silver
- Speed Resistance Lines
- U.S. Dividend Watch List
On February 23, 2015, we executed the following transactions:
Below are the seven Nasdaq 100 companies that are on our radar. We will be adding to our current position in one of the stocks listed below.
The market finished the week on a high note with the S&P 500 closing at all-time highs. The blue chip Dow Industrial Average topped its all-time high as well, closing at 18,144. The deal to extend Greece’s aid for four months may have been the catalyst but we believe that the market climbs a wall of worry. Despite bullish market sentiment, our watch list contains 50 companies, suggesting that there is interal weakness in the market. While not all fifty companies are worth considering, there are pockets of opportunity. Continue reading
Below are the eight Canadian companies that are on our radar with the analyst estimates for the coming year.
Posted in Canadian Dividend Watch List
Below is the performance of the nine stocks from the February 14, 2014 Canadian Dividend watch list compared to the Toronto Stock Exchange gain of +9.16%.
| Symbol | Name | 2014 | 2015 | % change |
| TLM.TO | Talisman Energy | 11.66 | 9.52 | -18.35% |
| FCR.TO | First Capital Realty | 17.33 | 20.07 | 15.81% |
| FTS.TO | Fortis Inc. | 30.71 | 39.53 | 28.72% |
| CWT-UN.TO | Calloway REIT | 25.77 | 30.45 | 18.16% |
| CAR-UN.TO | Canadian Apartment Properties | 21.52 | 26.98 | 25.37% |
| D-UN.TO | Dundee REIT | 29.31 | 27.26 | -6.99% |
| BNS.TO | The Bank of Nova Scotia | 63.29 | 67.4 | 6.49% |
| CUF-UN.TO | Cominar REIT | 18.45 | 19.65 | 6.50% |
| LB.TO | Laurentian Bank of Canada | 45.96 | 50.4 | 9.66% |
The average gain for all of the stocks listed was +9.49%. The best performing stock was Fortis (FTS.TO) with a gain of +28.72%. Over the last year has made 4 dividend payments with a dividend increase of +6.25% with the latest payment on February 12, 2015. The worst performing stock was Talisman Energy (TLM.TO) with a decline of –18.35%.
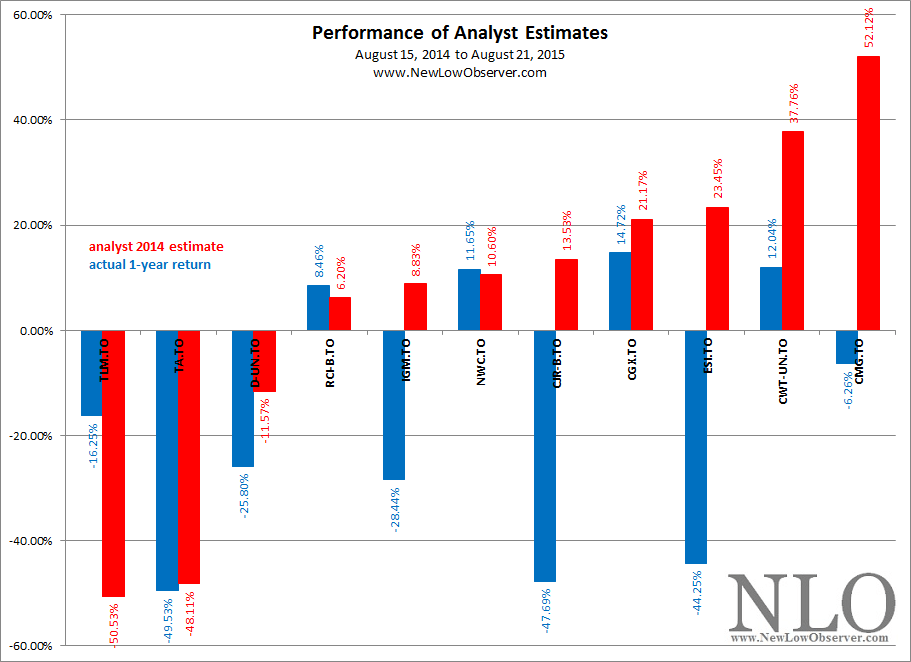
Analyst estimates for the listed stocks are compared to the actual performance in the chart below.
Talisman Energy (TLM.TO) was projected to have the worst decline and it did. However, it could have been much worse as depicted in the chart below. At one point, Talisman Energy stock price declined as much as –63% before Spanish oil giant Repsol (REP.MC) announced on December 15, 2014 the intention to buy TLM.TO.
Our commentary on the dire analyst expectations for Talisman Energy was:
“As far as we can tell, TLM.TO is not slated to be worth very much by the end of 2014. We’ll have to see how this picture plays out. However, if the stock market can keep its head above water for the next 10 months we wouldn’t be surprised to see TLM.TO to pull off a shocker.”
In the midst of a collapsing oil and stock prices, Talisman did pull off a shocker and just before the end of 2014.
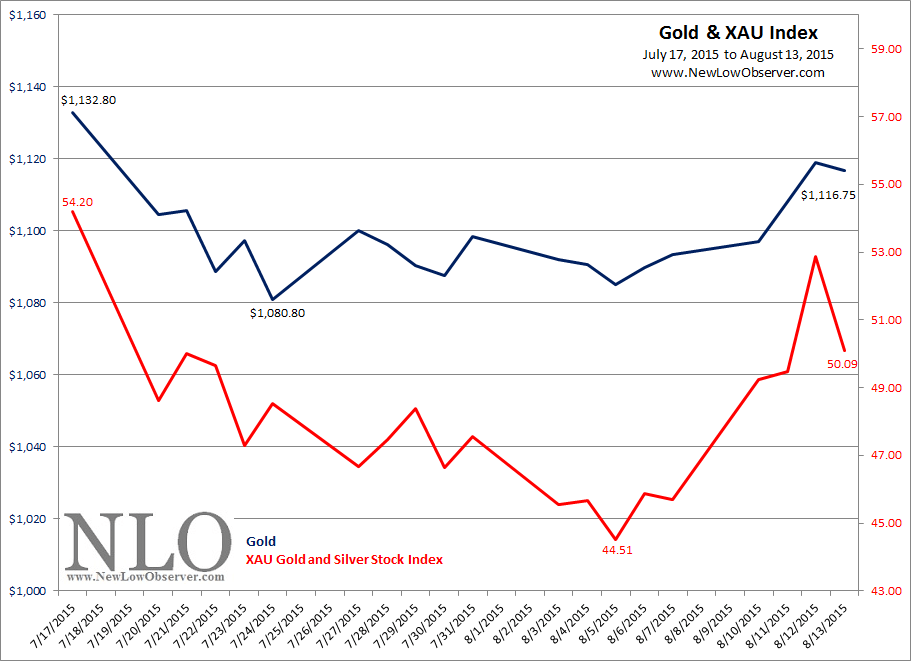
Since our January 30, 2015 posting, the price of gold, as represented by the SPDR Gold Shares (GLD), has declined –4.43% while the Philadelphia Gold and Silver Stock Index (XAU) has declined –2.87%.
It is unusual that the price of the gold stock index would decline less than that of the price of gold. Either the gold stock index needs to decline much further or the price of gold should rebound. Remember that gold stocks are the sentiment indicator for the price of gold, therefore, the pricing action above might suggest that the gold declines aren’t sustainable.
The Gold Stock Indicator is reflecting this relative strength with the marginal declines as indicated in the chart below.
On January 20, 2011, Morningstar.com presented an article titled “Morningstar Identifies Likely Takeover Candidates across Nine Sectors.” In that article, 20 companies were listed as potential takeover candidates. Of the 20 companies listed, 7 were actually taken over between the January 2011 and February 2015 period. Below is our general review of those transactions and the implications to an investor if they were to act on those suggestions.
The Methodology
According to Morningstar.com, there were two different methods for the determining the 20 companies. The first method used the following methodology (identified 3 out of 10 companies that were taken over):
“Morningstar equity analysts identified approximately 100 takeover targets across nine sectors: banking, basic materials, consumer, energy, healthcare, industrials, technology/communication services, and utilities. Potential takeover candidates for each sector were determined by unique and proprietary scoring systems for each sector, based on industry-specific drivers of merger and acquisition activity as well as factors such as free cash flow, management, and capital structure.
“Morningstar then examined its list of potential takeover candidates to identify the most compelling stocks for 2011, selecting companies that are the most attractively priced based on their price/fair value ratio and ranking in their respective, sector-specific potential takeover candidate list.”
The second method as applied by Morningstar.com’s division Footnoted analysts used the following screening process (identified 5 out of 10 companies that were taken over, 1 company appeared in the Morningstar list above).
“Footnoted released a list of potential takeover candidates for 2011, based on its analysis of Securities and Exchange Commission (SEC) filings. Morningstar acquired the Footnoted business in February 2010.
“Footnoted analysts combed through SEC filings, looking for signals that could point to a potential deal, including seemingly innocuous items such as new employment contracts or director and executive changes.”
The Companies
The Morningstar.com team accurately identified 30% of the companies that would be taken over while the Footnoted team got 50% correct. Overall, out of 20 companies listed, accurately identifying 35% as takeover candidates seems exceptional.
The seven companies that were taken over were:
Data Source
Because the transactions for these stocks have been completed, there are few sources on the internet to track where the price of the stock was on January 20, 2011 and where they eventually ended up by the time the deal was completed. However, we were able to find a website out of Germany (Ariva.de) that still had charting of the stock prices prior to the announcement and after the deals took place.
Of the seven companies listed above, we were not able to get accurate charting of the stock price for Lawson Software (LWSN). However, the remaining six stocks provide interesting food for thought when it comes to the reality of buying stocks that are candidates for takeover.
The Results
The first stock on the list is Clearwire Corp. At the time of the Morningstar.com article the stock was trading at slightly above $5. However, by July 2012, CLWR was trading at $1.03 per share or down –80%. Finally, by May 2013, CLWR received an offer from Sprint to be acquired for $5 a share. Anyone buying CLWR based on the Morningstar article would have had to endure the pain of the decline, not likely, or see a breakeven deal go through nearly two years later.
The next company was Petrohawk Energy (HW). At the time of the article, the stock had already experienced an increase from the low of about +36%. Once the takeover by BHP Billiton was announced on July 14, 2011, HW climbed an additional +76%. The timing of the article with the eventual takeover couldn’t have been better. In spite of the takeover by BHP and the jump in the stock price, shares of BHP fell –44% from the July 14, 2011 announcement to February 13, 2015 leaving holders of Petrohawk at the equivalent of a breakeven price when the Morningstar article was issued.
The next company is Leap Wireless (LEAP). The stock started off with a slight increase in price after the Morningstar.com article. However, by July 2011 everything started to fall apart for the stock. LEAP fell by –66% to the low on April 2012. It wasn’t until an announced takeover by AT&T before the stock price recovered all that was previously lost and tacked on an additional +34%. Again, an investor would have to have significant resolve to weather a –66% decline to see any benefit of a takeover offer. As is usually the case, anyone buying a stock with the hopes of a buyout must be willing to accept considerable downside risk.
Next is Copano Energy (CPNO). Copano Energy took a slight dip of –26% before the stock recovered and then a deal was announced by Kinder Morgan to acquire CPNO. The decline in CPNO was moderate and the eventual gain was equally so. Kinder Morgan declined –20% shortly after the acquisition was completed in early May 2013. As of February 13, 2015, Kinder Morgan sits at a +7% gain since the takeover of Copano Energy which is a considerable gain relative to most oil sector stocks and their performance in the last year.
Pride International (PDE) was next with a chart that shows the stock being acquired shortly after the Morningstar.com article. However, the takeout price was “only” +15% above the January 20, 2011 date. PDE was bought by Ensco and was announced on February 7, 2011. As is usually the case, Ensco fell –44% from the completion of the PDE acquisition leaving PDE holders with an equivalent price of $26.24. This would be a loss of –22% from the level that PDE was at when the Morningstar article was published.
Smurfit-Stone (SSCC) was the last company on the list and it was acquired by Rock-Tenn. The deal was slightly unusual because SSCC was larger than RKT. This was the most lucrative takeover deal that we were able to track from the listed stocks in the Morningstar article. Although SSCC only increased by +28.57% at the completion of the takeover by RKT the subsequent +90% gain in Rock-Tenn’s price justified the investment in SSCC.
Useful Lessons From Takeover Talk
Finally, the data that Footnoted provides is far better and accurate for takeover ideas. One out of every two stocks is an incredible record. We would recommend looking out for similar recommendation by Footnoted in the future.
On February 12, 2015, news of Expedia (EXPE) buying Orbitz (OWW) combined with the earnings release by TripAdvisor (TRIP) has resulted in OWW increasing +21.83% while TRIP has increased by +23.76%. This cannot be good news for Priceline (PCLN) shareholders as the likelihood of the company overpaying for TRIP grows.
Our February 6, 2015 Nasdaq 100 Watch List had the following review of TripAdvisor and Priceline:
A couple of stocks that have caught our eye are Priceline (PCLN) and TripAdvisor (TRIP). Both stocks are low in price relative to their March 2014 peaks.
There has been some recent talk about PCLN absorbing TRIP in a buyout. Below is the relative price difference between PCLN and TRIP. In the last year, mid-November 2014 was the best time for PCLN to leverage the stock price to buy TRIP while July 2014 was the worst time to use stock to buy TRIP.
While PCLN has changed on a relatively small basis over the last year, Ctrip.com (a company that we correctly analyzed on December 2011) has had a tremendous amount of relative price change over TRIP in the last year.
While TripAdvisor (TRIP) may not be the best investment over Priceline (PCLN) on a fundamental basis, the potential for a buyout of TRIP may make good investment sense due to the need to eliminate a competitor or to take advantage of existing clients, assets or infrastructure. Things could get worse for the market overall, pushing all of the stocks in the sector down. Barring a general market correction, investors probably have until the middle of December 2015 for a deal to be hammered out if the stock price doesn’t recover from the current levels.
We remain confident that TripAdvisor is the best relative value in the competition elimination game for the sector. In reality, Ctrip.com acquiring TRIP is very unlikely. However, we believe that with the recent jump in the price of TRIP, Priceline will feel the burn and get into a rampant bidding war for TRIP. This could result in TRIP being acquired for well above the most recent 52-week high of $110.
Below are the downside targets along with the conservative/extreme upside targets for TRIP based on Gould’s Speed Resistance Lines. Non-members of our site wishing to view the upside/downside targets can send an email to nlo@newlowobserver.com.
Below are the price projections based on analyst earnings estimates for the stocks on our recent U.S. Dividend Watch List dated February 6, 2015. These estimates project the price change for the respective stocks by the end of 2015. The stocks listed below are only a select group that was not shown on our January 19, 2015 analyst estimates.
Watch List Performance Review
In our ongoing review of the NLO Dividend Watch List, we have taken the top five stocks on our list from February 7, 2014 and have checked their performance one year later. The top five companies on that list can be seen in the table below.
| Symbol | Name | 2013 Price | 2014 Price | % change |
| MKC | McCormick & Company | 63.04 | 74.34 | 17.9% |
| CHRW | C.H. Robinson Worldwide | 52.39 | 70.51 | 34.6% |
| ERIE | Erie Indemnity Company | 68.43 | 90.49 | 32.2% |
| NWN | Northwest Natural Gas | 40.54 | 48.80 | 20.4% |
| T | AT&T Inc | 32.30 | 34.87 | 8.0% |
| Average | 22.6% | |||
| DJI | Dow Jones Industrial | 15,794.08 | 17,824.29 | 12.9% |
| SPX | S&P 500 | 1,797.02 | 2,055.47 | 14.4% |
McCormick (MKC) topped the list and we made a quick commentary about it. We said the following about the stock.
The stock currently yields 2.35% with a payout ratio of 51% and a P/E ratio of 21. Our initial assessment indicates that shares typically trade around a P/E of 17 and with a dividend yield of 2.35%. As such, we see MKC being at, or close to, undervalued level.
Our short assessment turned out to better than expected with the average of the stocks on our watch list outperforming the market.
We also thought that AT&T (T) would be well received for long-term investor with exceptional yield. The share performance didn’t turn out well but inclusion of dividend of 5.7%, the total return was comparable to the Dow.
U.S. Dividend Watch List: February 6, 2015
Below are 56 companies on our U.S. Dividend Watch List that are currently of interest to us. Continue reading
Performance Review
Below is the performance of the six stocks from the February 21, 2014 Nasdaq 100 watch list compared to the Nasdaq 100 Index gain of +15.46%.
|
Symbol
|
Name |
2014 | 2015 | change |
| SYMC | Symantec Corporation | $20.53 | $24.77 | 20.65% |
| MAT | Mattel, Inc. | $35.55 | $28.22 | -20.62% |
| CHRW | CH Robinson Worldwide | $54.12 | $70.51 | 30.28% |
| FAST | Fastenal Company | $45.61 | $42.33 | -7.19% |
| SPLS | Staples, Inc. | $13.09 | $16.57 | 26.59% |
| CSCO | Cisco Systems, Inc. | $22.13 | $27.24 | 23.09% |
The average gain for all of the stocks was +12.13%. Symantec (SYMC) was the stock of interest at the time. Our thoughts on SYMC were, “…we don’t see why the stock couldn’t decline a bit further until April or May.” In fact, SYMC declined as low as $17.95, a drop of –12.57%. However, the final low occurred in late March instead of the April/May projection.
At the time of the posting from last year, we outlined the analyst estimated price change for six stocks on our watch list. The projections were as follows:
![]()
The actual performance after one year is displayed below.
On the whole, it appears that the analysts were correct about the overall trend for the stocks on our watch list. two of three were (MAT, CHRW and FAST) were expected to be a mixed bag while three of three (CSCO, SYMC and SPLS) were expected to have price increases.
February 6, 2015 Watch List
Below are the 14 Nasdaq 100 companies that are on our radar. As readers know, we have recently taken a sizable position in one of the stocks on this list.
Mattel (MAT) has many fundamental attributes that are well worth considering which we’ve previously outlined. However, the technical side of the stock offers substantial food for thought. Below we cover aspects to Mattel that, although not popular, may offer additional insight to the stock price going forward.
It hasn’t been fun and games for the leading toy maker, Mattel (MAT). Last week, the struggling company announced that the CEO, Bryan Stockton resigned. The preliminary result from the holiday season was dismal with profits falling -59% from a year earlier. The stock was one of the worst performing in S&P 500 over the last year. Shares fell -34% in 2014 and are already down as much as -14% in 2015. Continue reading
Gold was essentially unchanged this past week while gold stocks were up nearly +4%. So far the trend is pointing to higher gold as the November 2014 low remains in place.